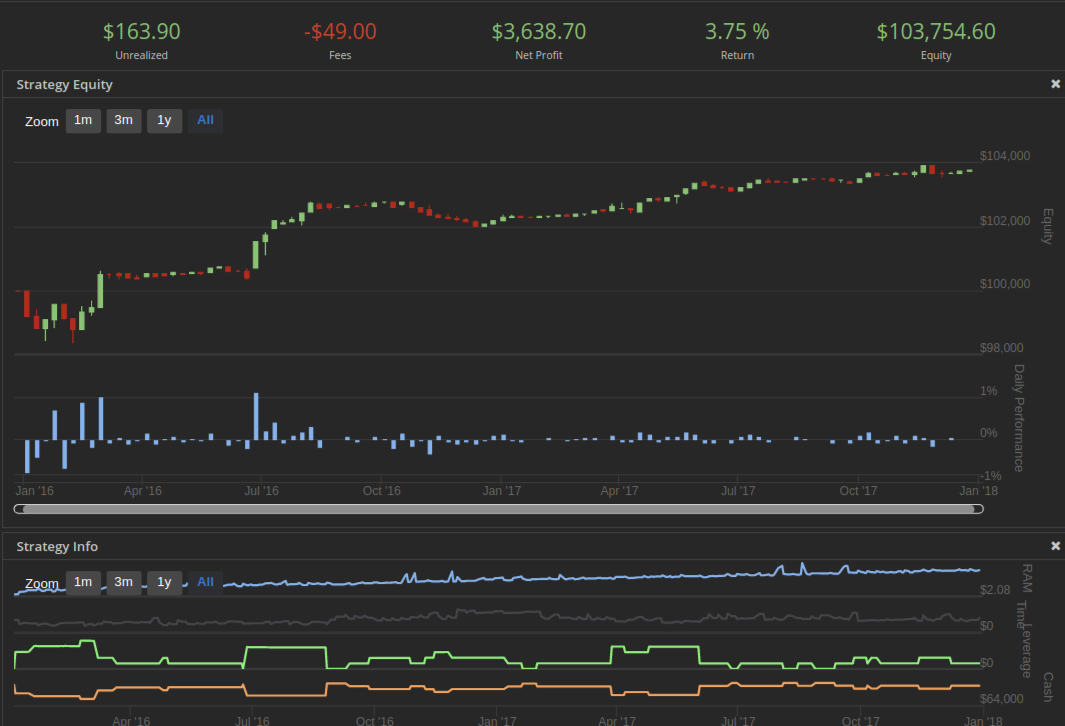
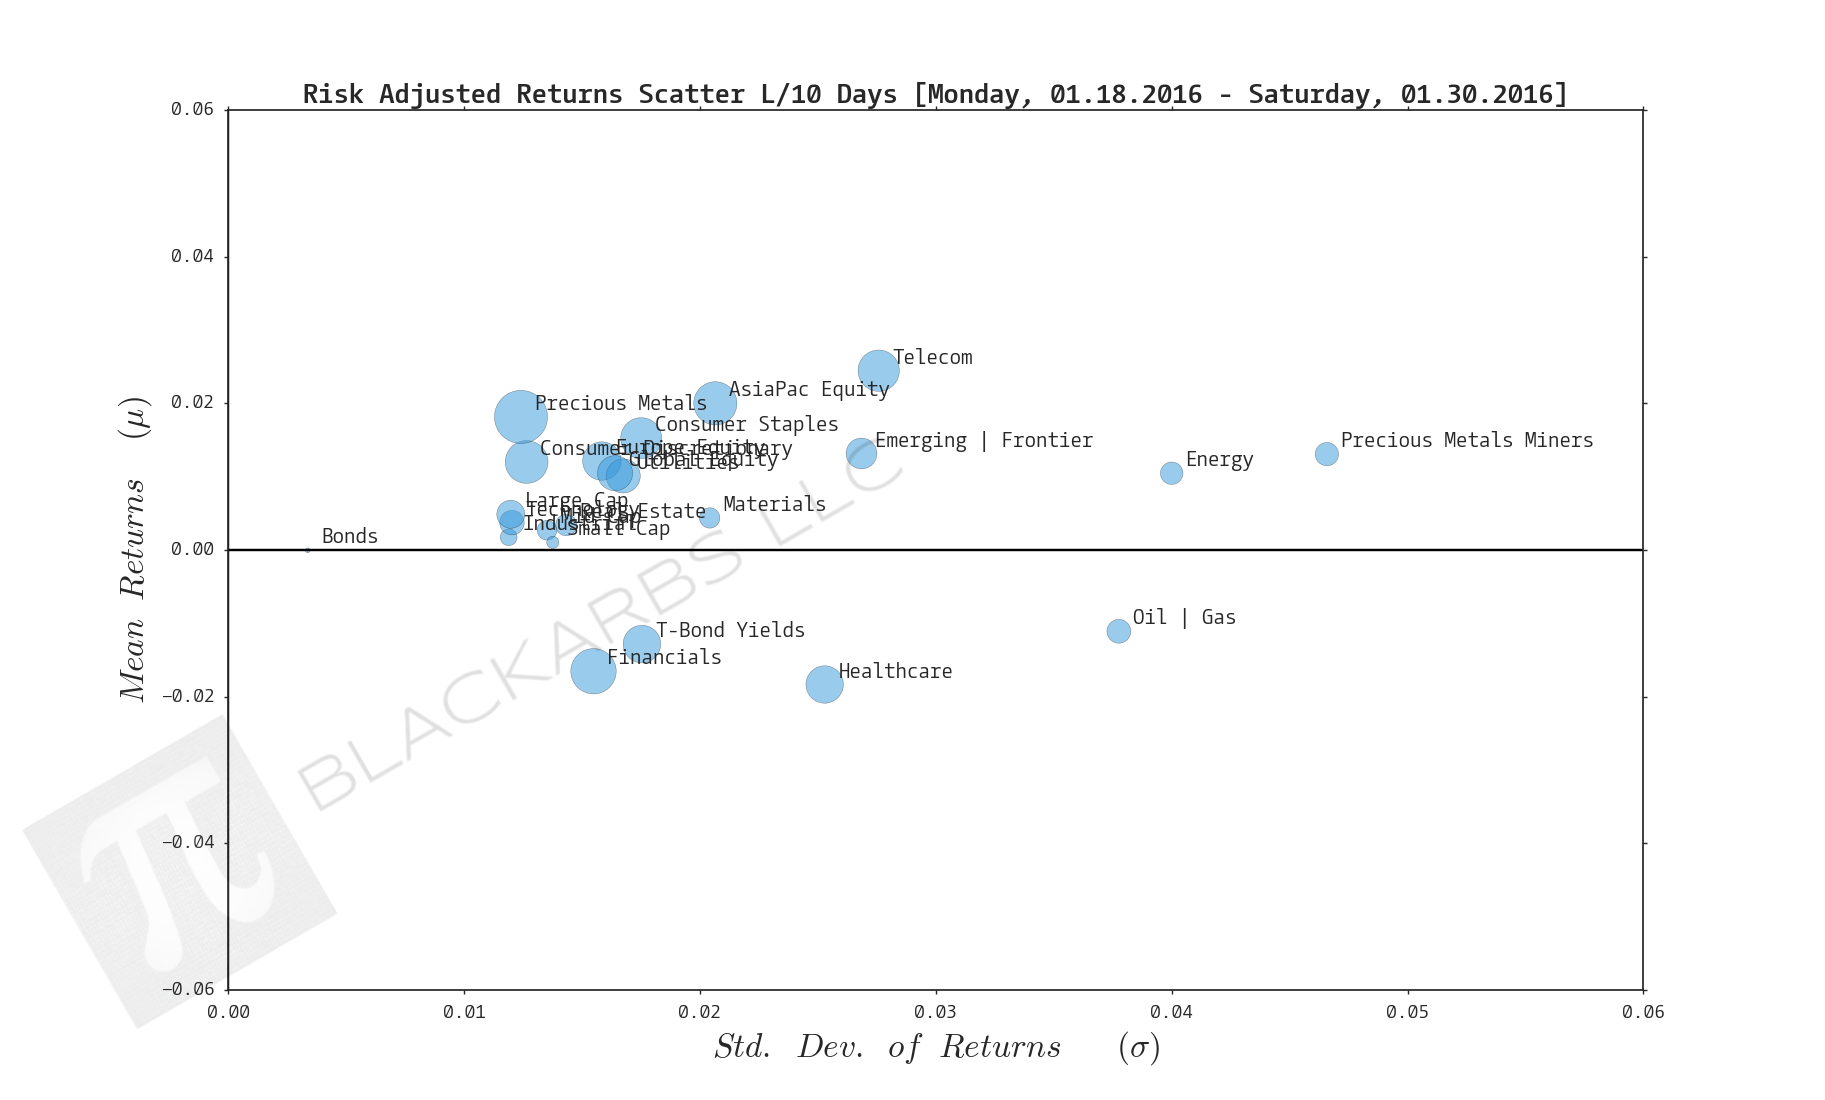
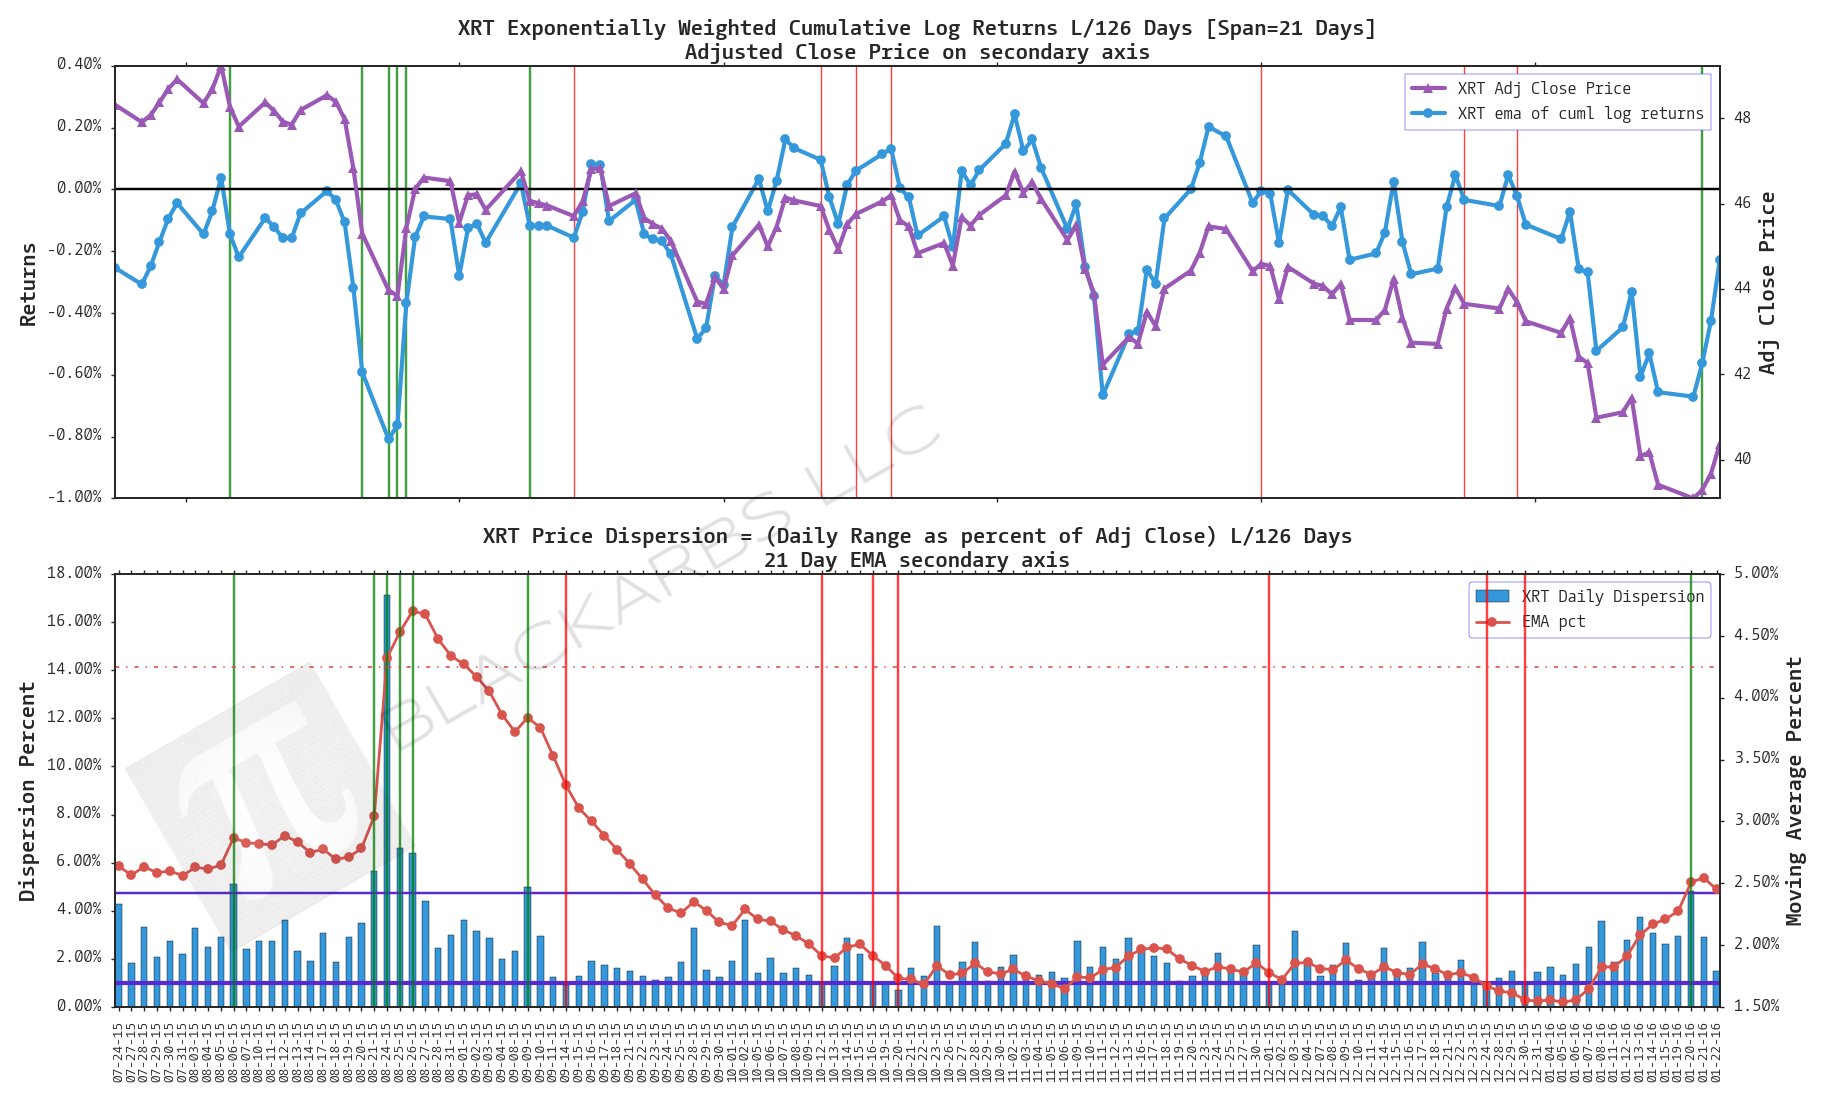
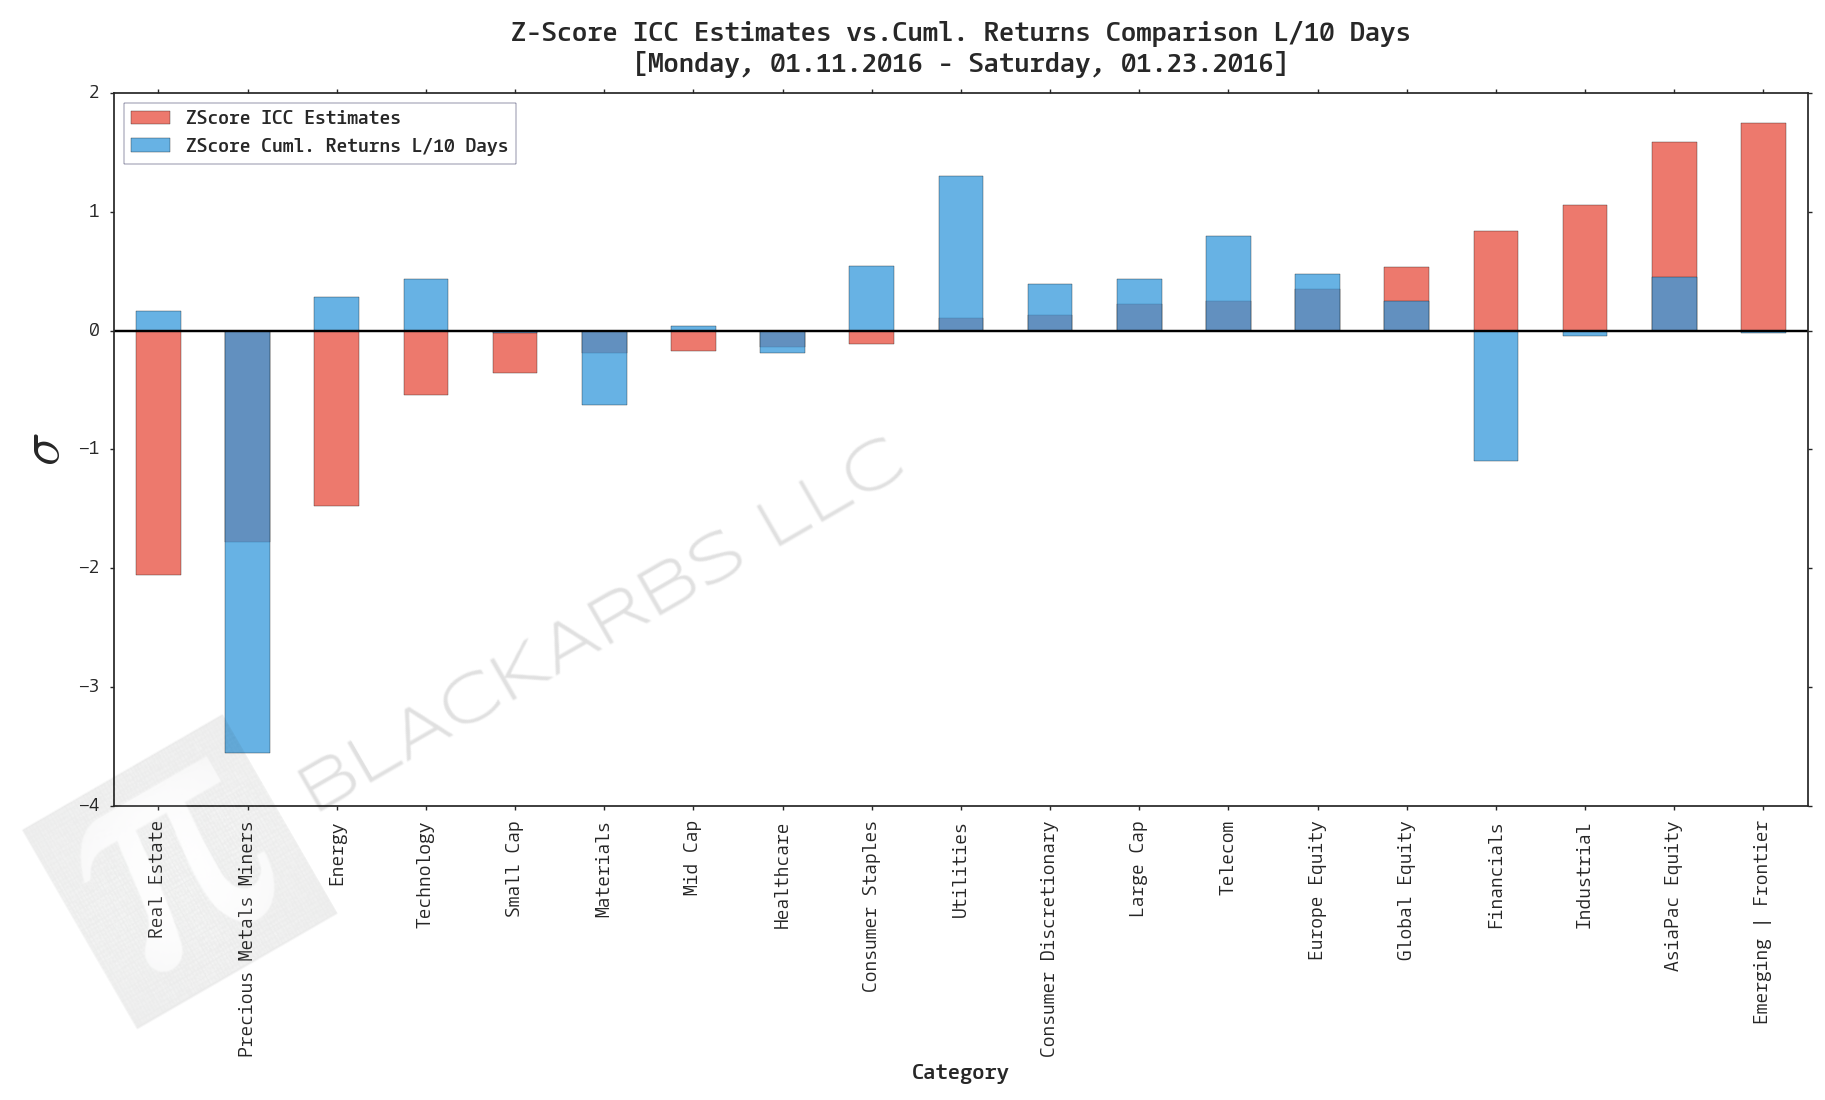
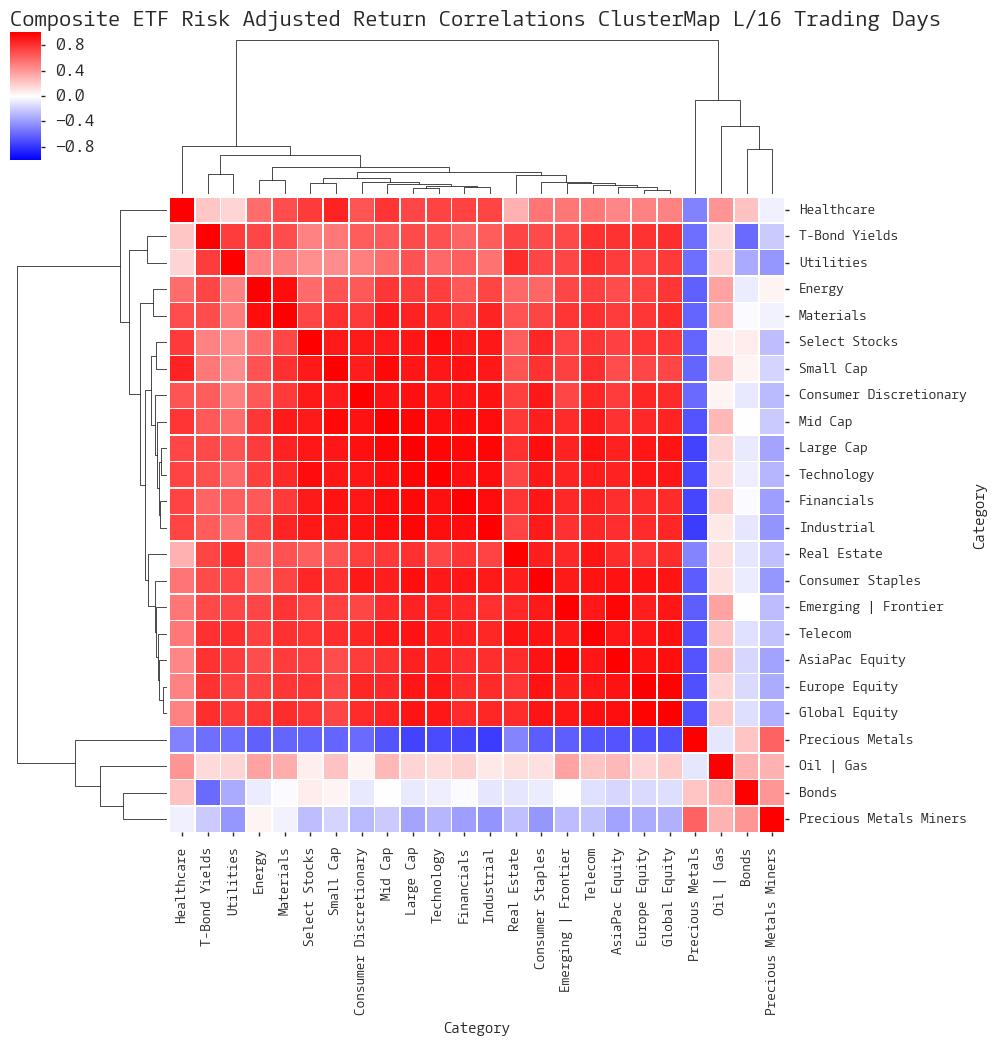
PythonQuant
Is it Possible to Know the Daily High or Low Intraday with 80% Accuracy?
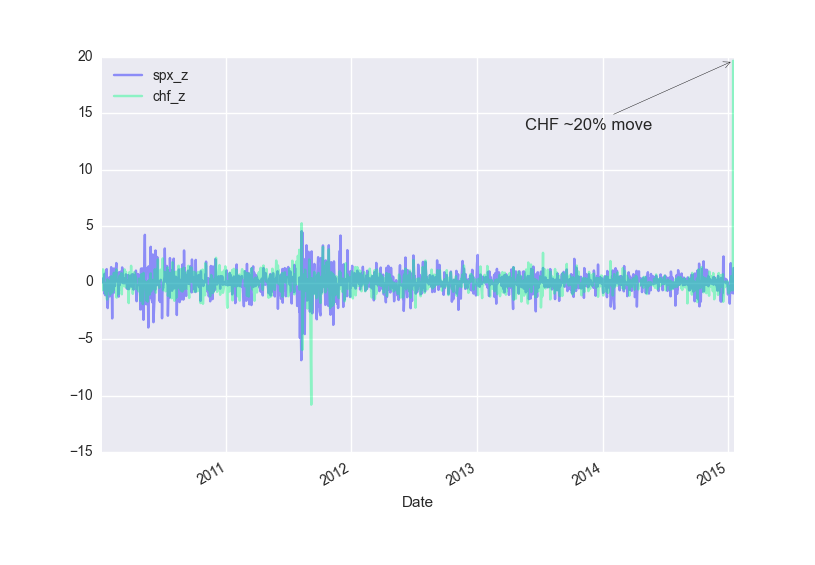
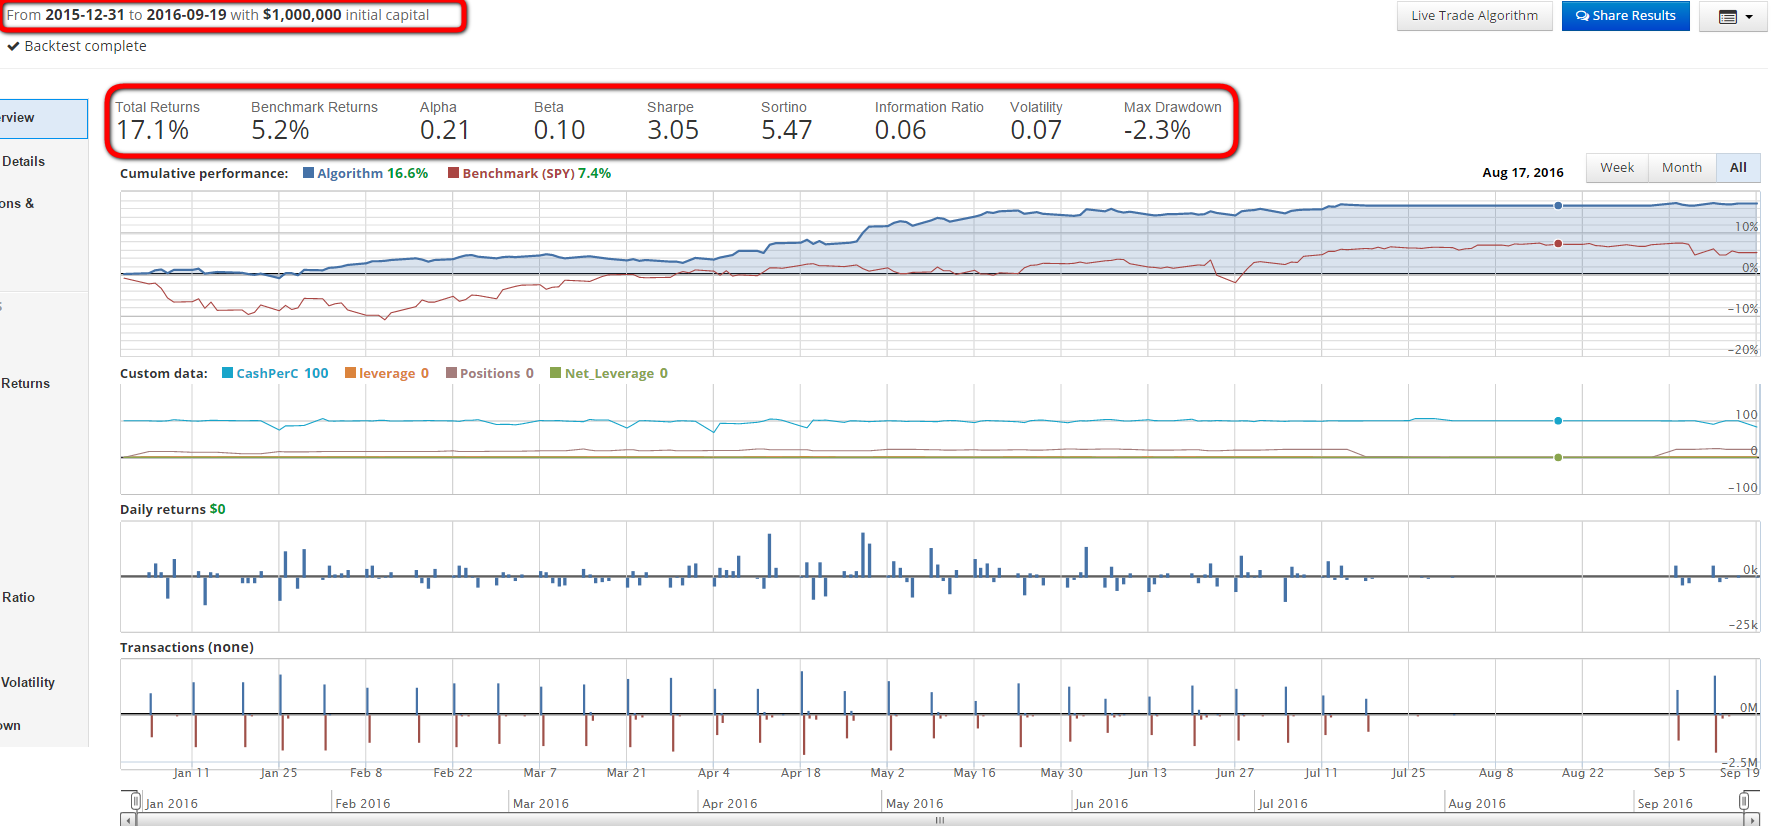
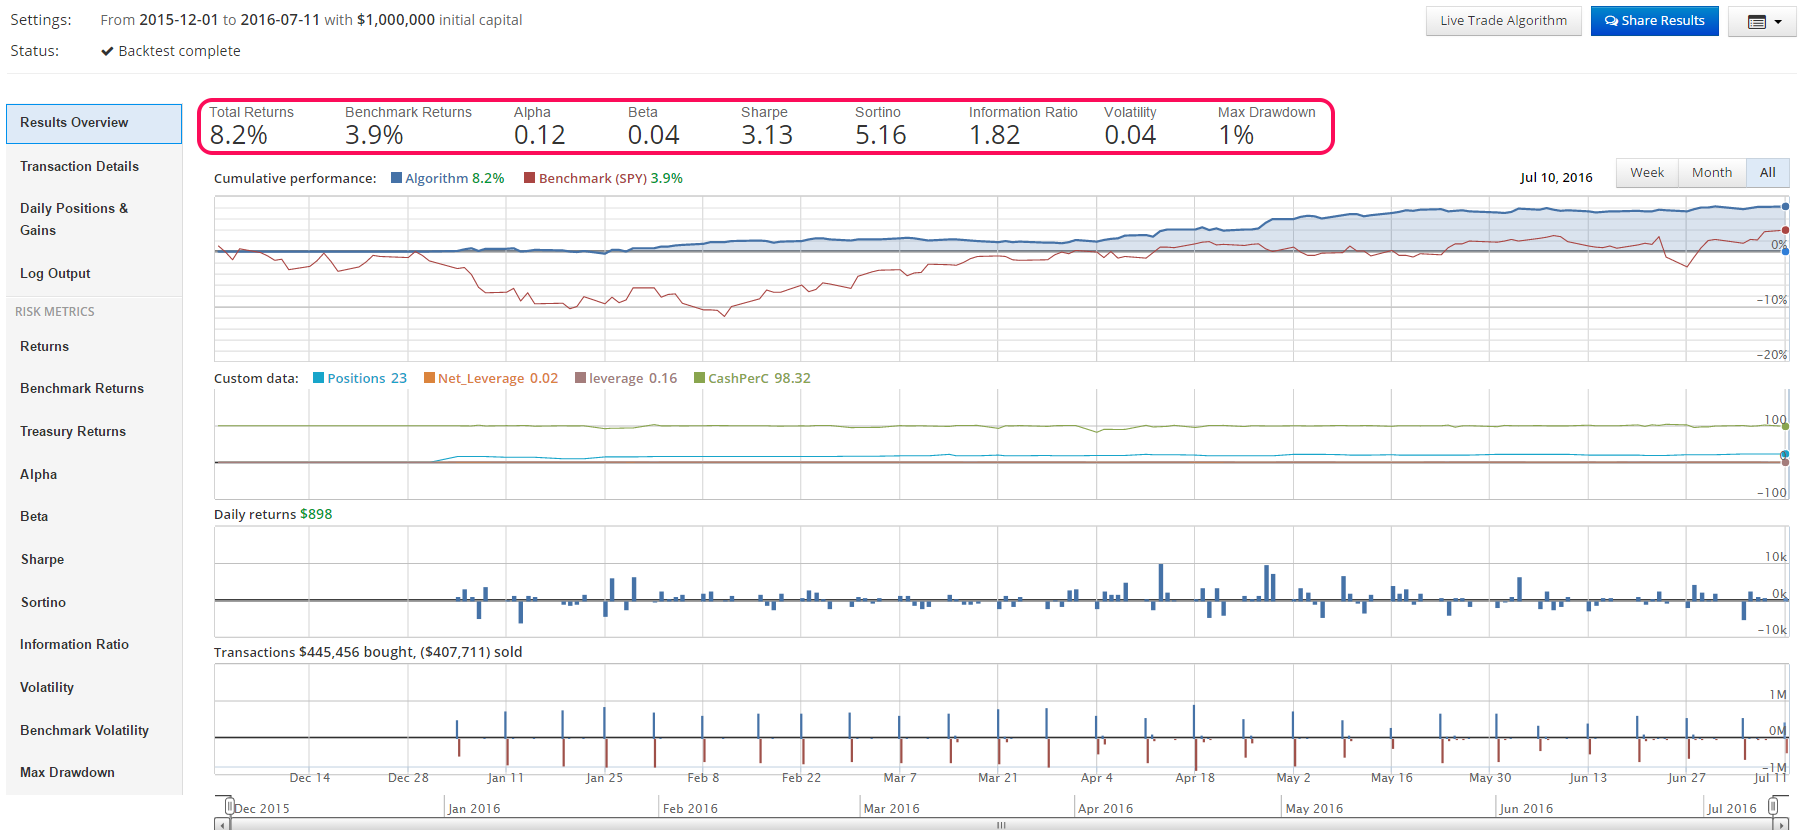
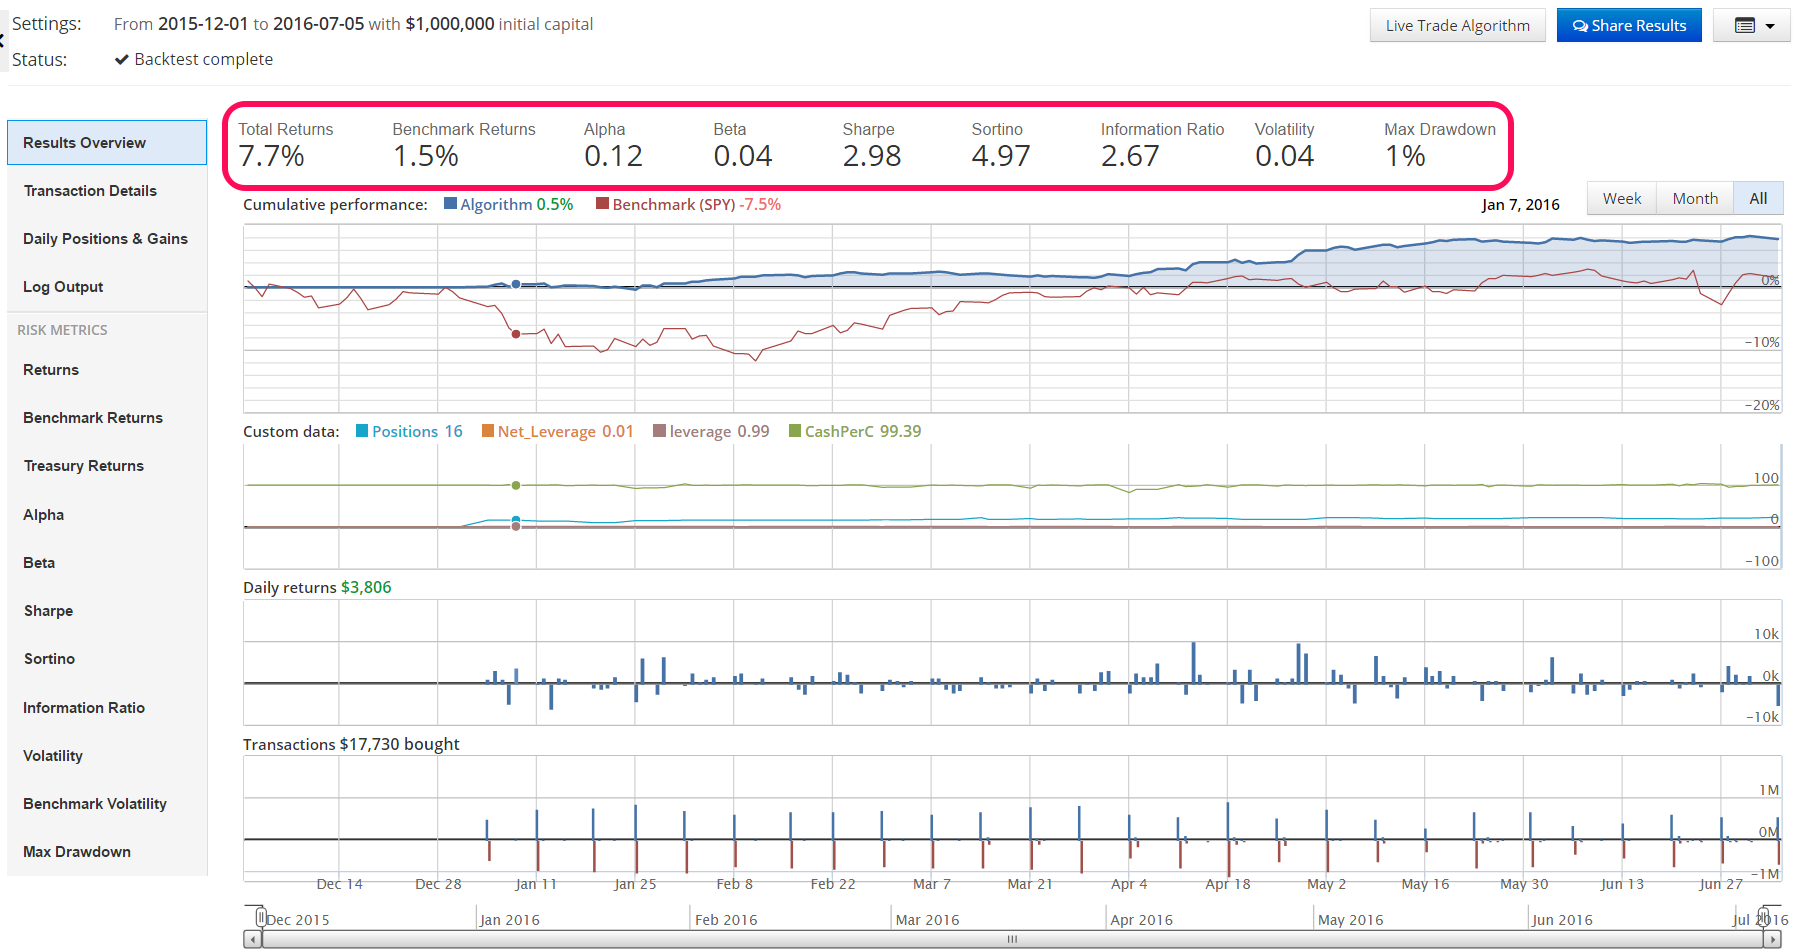
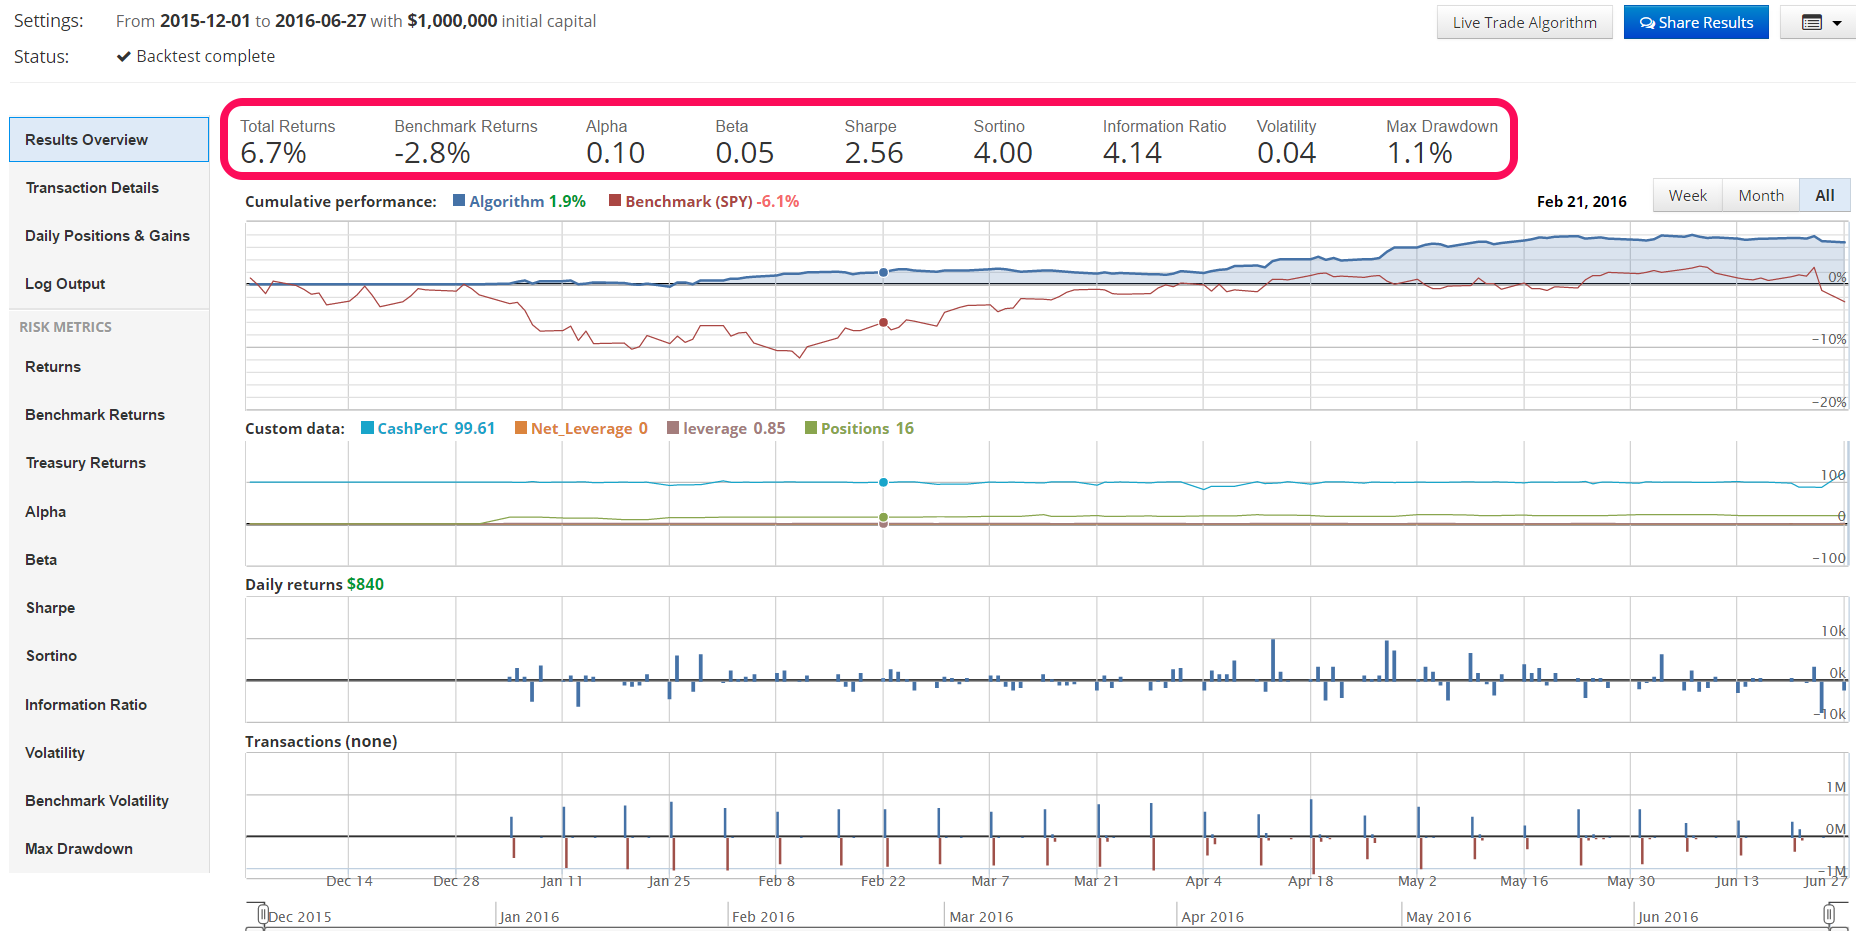
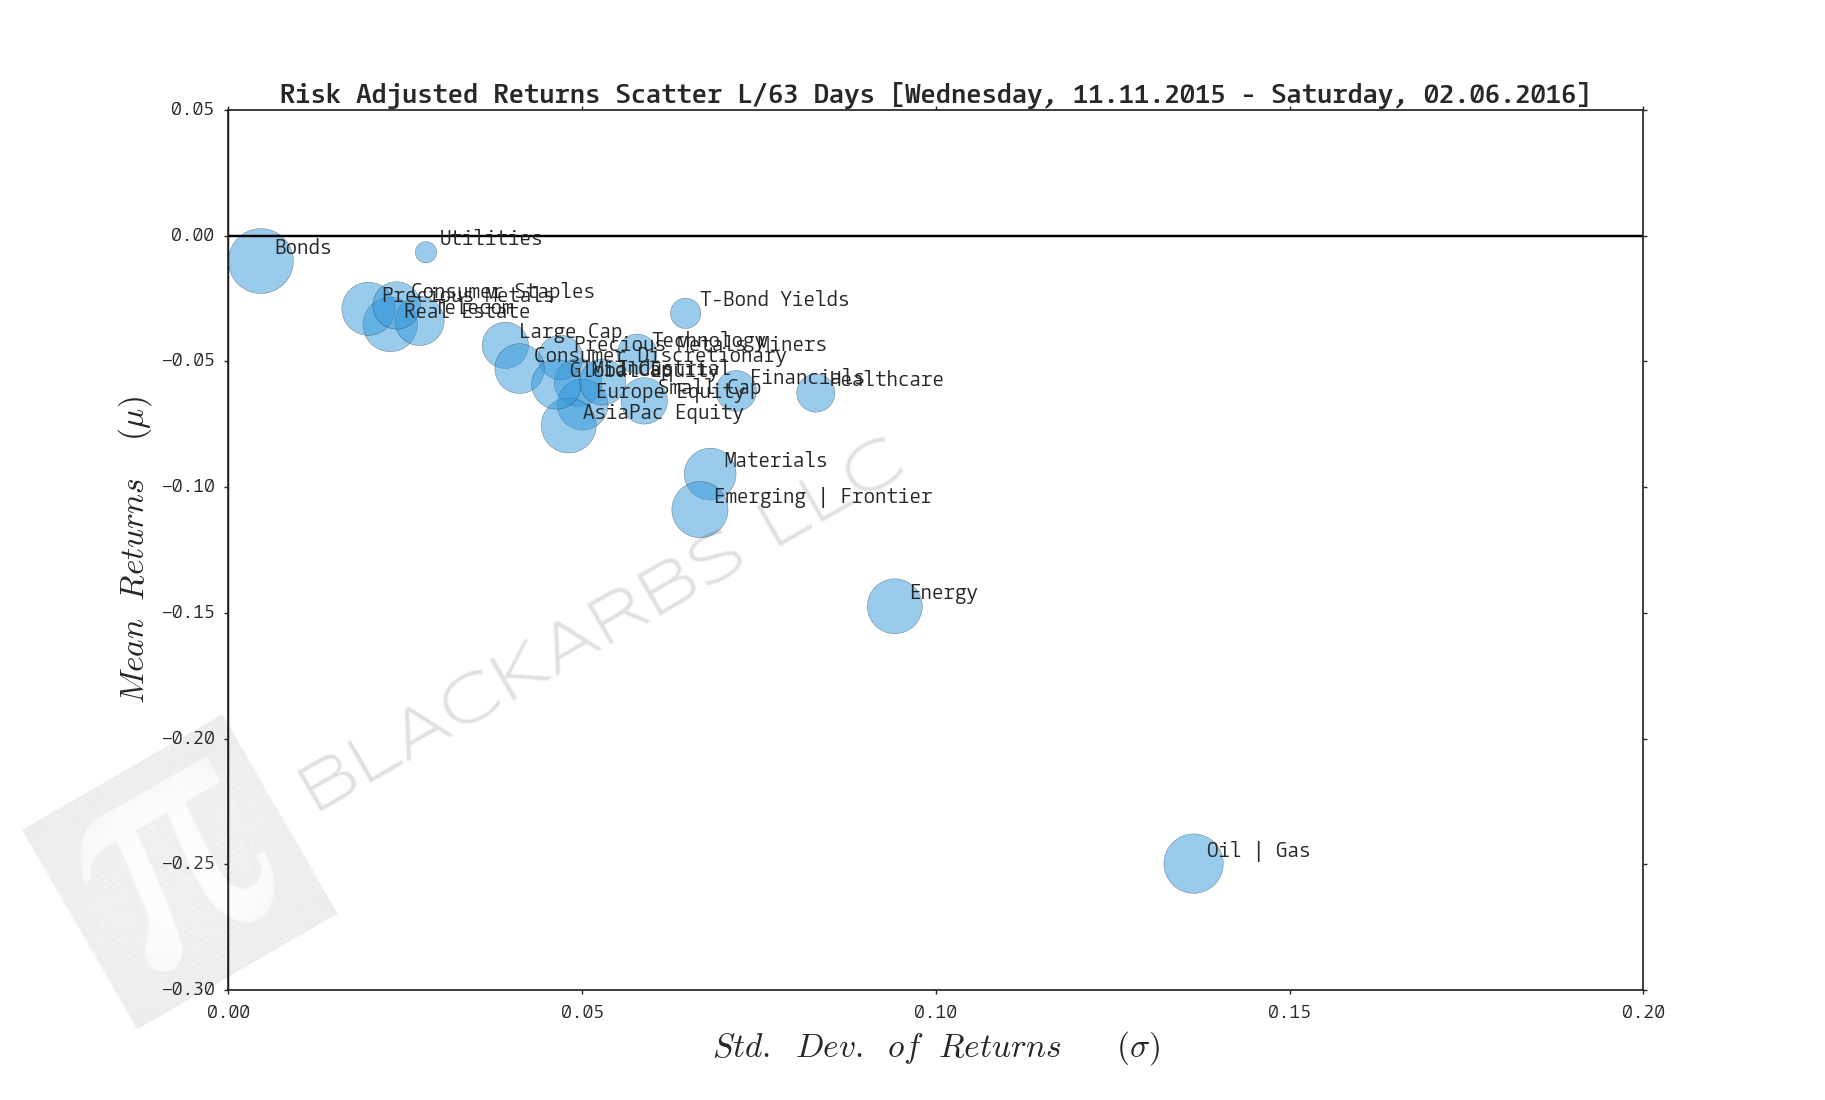
Introduction This is an old concept concerning the opening range. The idea is that the opening range often sets the day’s high or low within the first hour of cash equities trading (9:30 am - 10:30 am EST). Recently a trader on Youtube made the claim that you can know with 88% probability the high or low of the day after the first hour of trading. He managed to successfully repopularize the idea of using the opening range in a a more specific way than other methods. In this article I set out t
READ MORE →


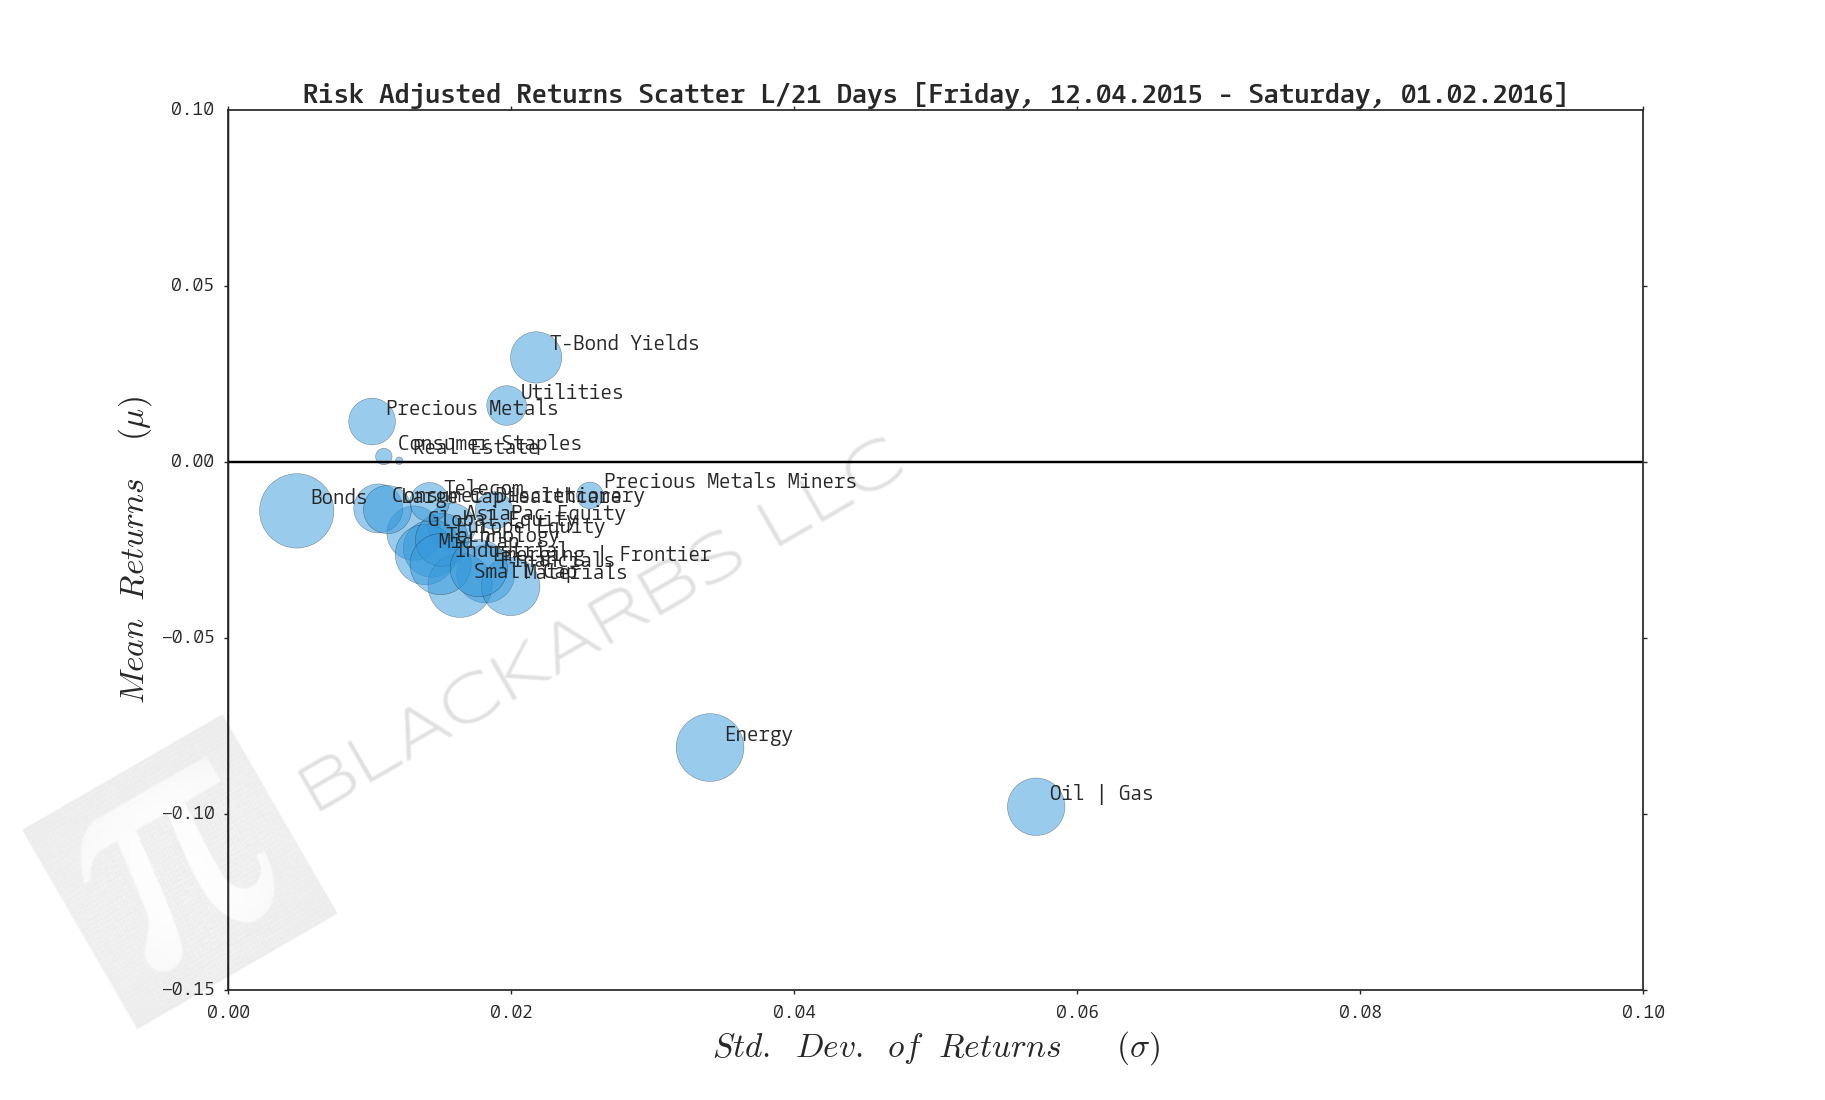

![COMPOSITE SECTOR ETF VALUATION REPORT [7.6.2015]](https://images.squarespace-cdn.com/content/v1/53ac905ee4b003339a856a1d/1436250523268-PX9UJBTHY39NALCWY831/image-asset.png/img.png)
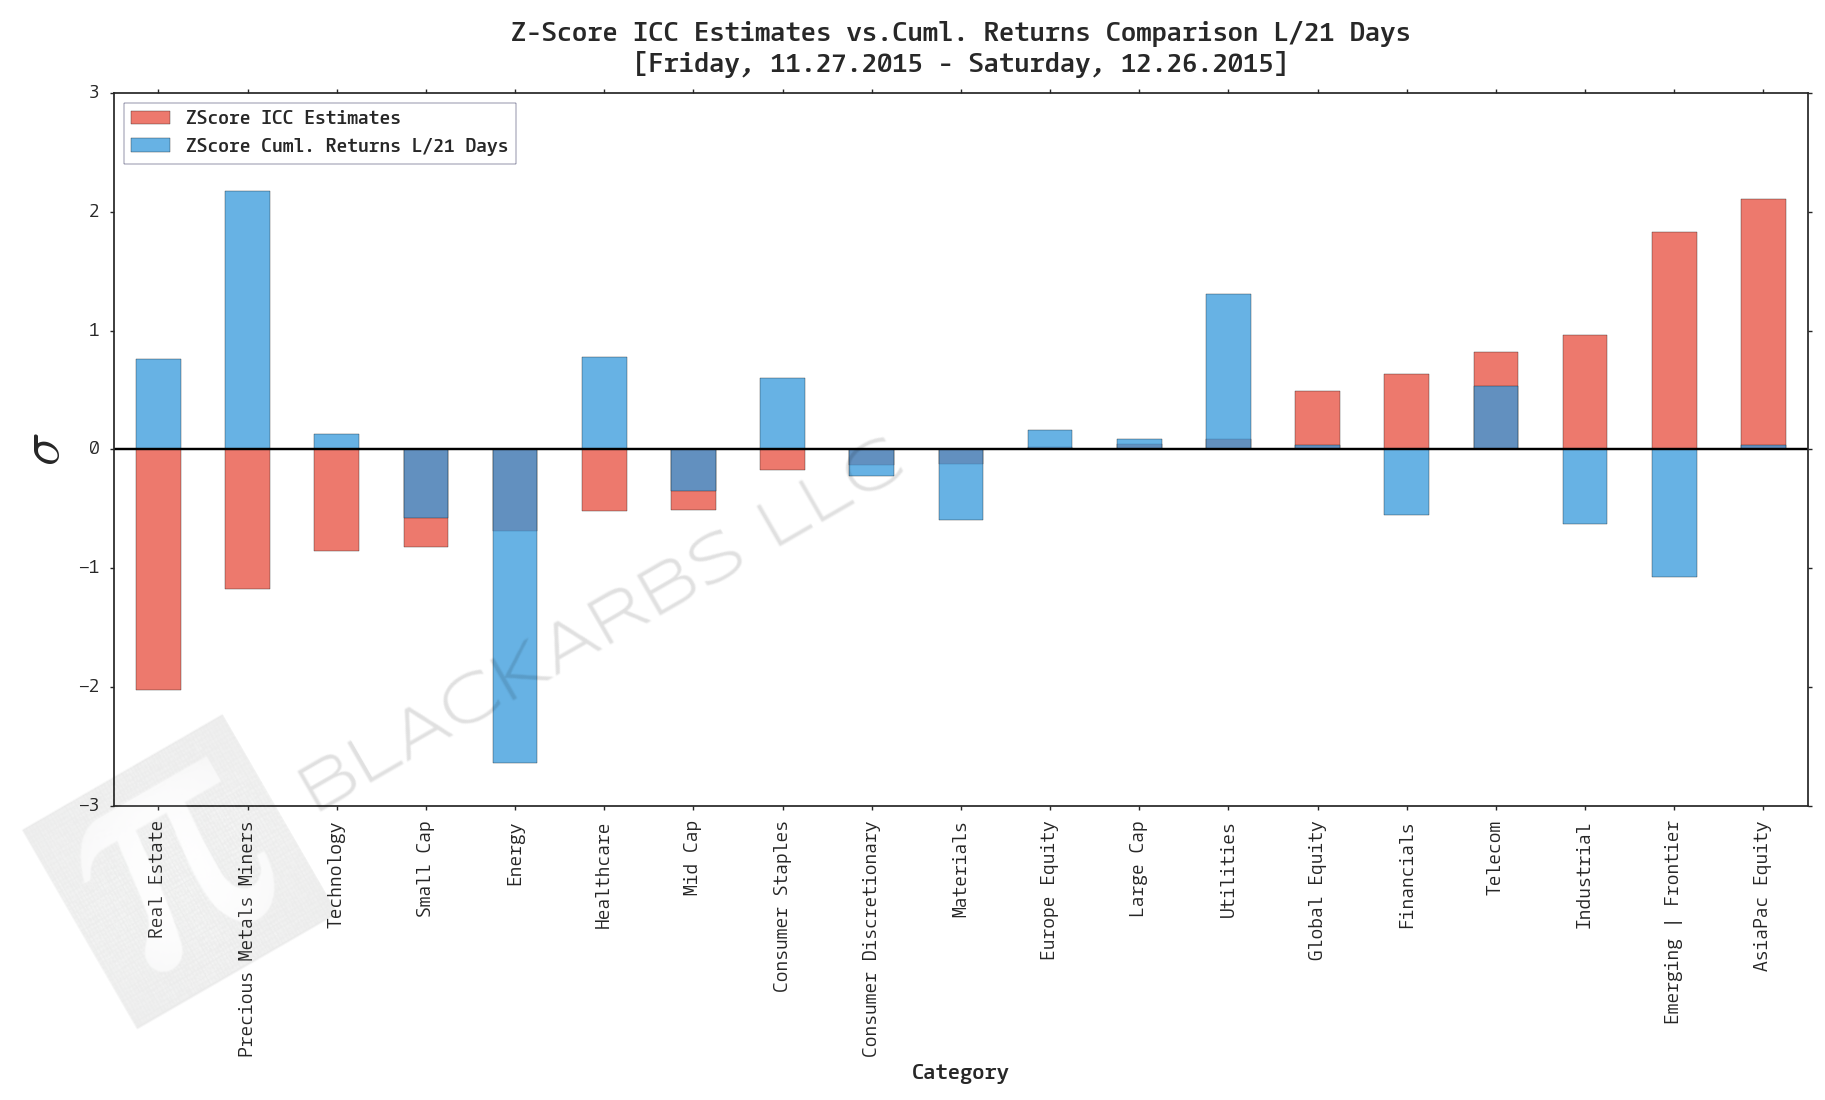
![Composite Sector ETF Valuation Report [6.15.2015]](https://images.squarespace-cdn.com/content/v1/53ac905ee4b003339a856a1d/1434379959959-DE9ZBLAQOS1O0KECSOWK/image-asset.png/img.png)
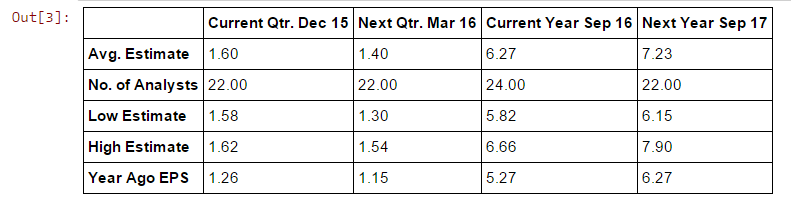
![COMPOSITE SECTOR ETF VALUATION UPDATED [5.24.2015]](https://images.squarespace-cdn.com/content/v1/53ac905ee4b003339a856a1d/1432487411121-MTTLFLABAOM2TUW8U3XZ/image-asset.png/img.png)
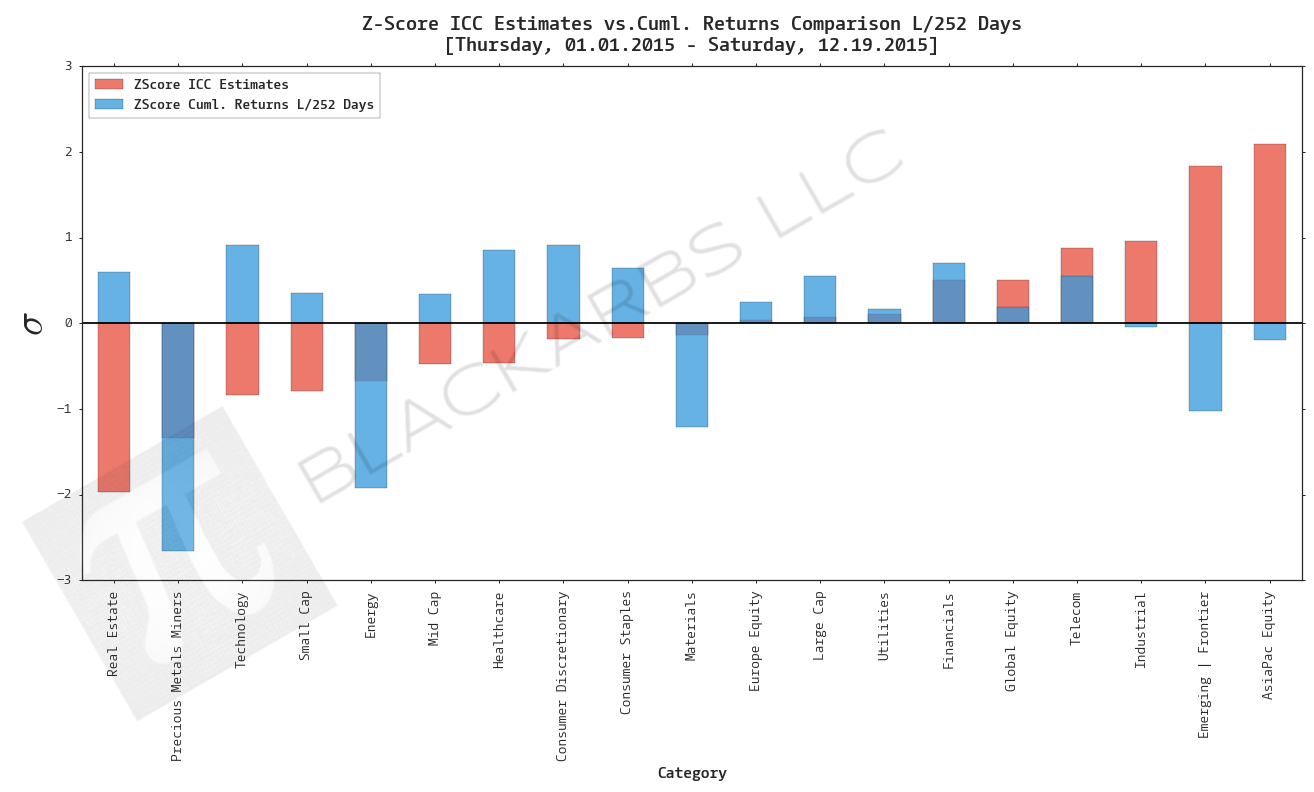
![Composite Sector ETF Valuation updated [5.10.2015]](https://images.squarespace-cdn.com/content/v1/53ac905ee4b003339a856a1d/1431314948330-G43HVEQVV34RD704GZTZ/image-asset.png/img.png)