
FOR A DEEPER DIVE INTO ETF PERFORMANCE AND RELATIVE VALUE SUBSCRIBE TO THE ETF INTERNAL ANALYTICS PACKAGE HERE
Since I started producing the following graphic for the ETF Internal Analytics product, I found the weekly return bin information compelling. I became curious about whether there was an opportunity to be exploited in the distribution patterns.
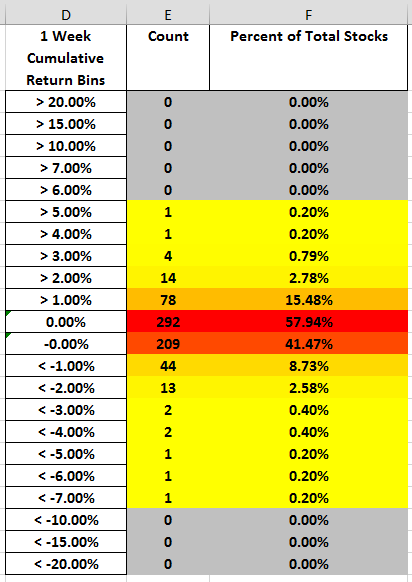
Blackarbs ETF Internal Analytics Sample for SPY
I distilled all the questions I had into two:
- Does the percentage of ETF component stocks at various return levels provide actionable information?
- Can a long-short market-neutral strategy be constructed by analyzing the relative return dispersion of each ETF's stock components?
To answer these questions I used a combination of tools/data sources including State Street's SPDR Holdings data, the Yahoo Finance API, and Python. To start I import the necessary packages.
Below I define `all_etf_symbols` as an ordered dictionary with key, value pairs equivalent to the ETF symbol, and a list of the ETF's component stocks. For brevity's sake I omit some of the data cleanup processes I did to construct the dictionary.
Next I define a convenience function to get the ETF prices. I also create a list of date tuples with each member of the tuple being a date from the same week anchored to Monday and Friday. This index gets reused multiple times.
Next we calculate the return bins and organize them by dates. I split this process by separating the positive return bins and negative return bins. Additionally the data is indexed so that the return bin calculations we perform are available the following Monday to avoid injecting look-ahead bias into the analysis. To facilitate this portion of the analysis I define several convenience functions.
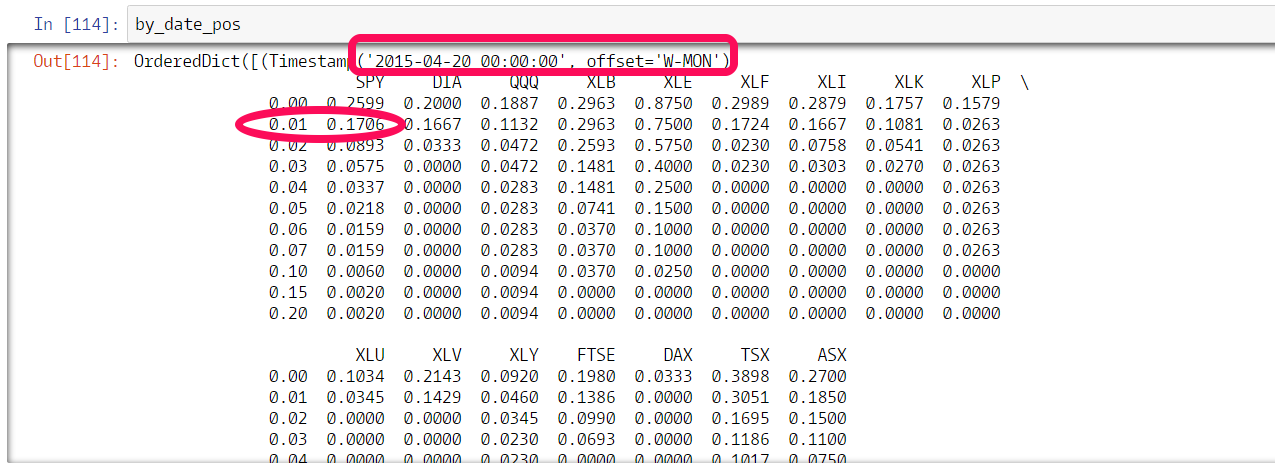
Here's a sample output after running the above script. Using the below example focusing in on the SPY column, the data would be interpreted as, on Monday 4/20/2016, ~17% of SPY's component stocks had gained 1% or more over the previous week.
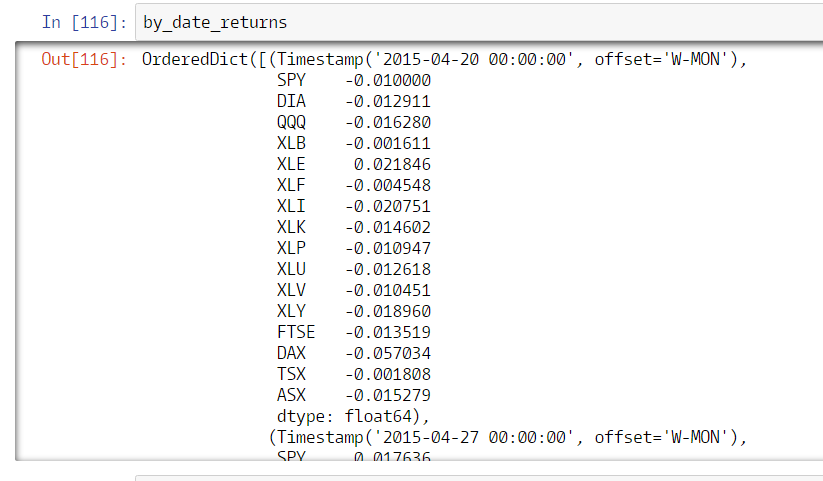
Now we calculate and group each ETF's weekly returns by date. Like before we index the data such that previous week's return data is available the following Monday. I define two convenience functions to help. The first function simply returns the log returns over the selected period. The second function converts between Yahoo Finance symbols and the symbols used for this study.
Here's a sample output of the `by_date_returns`.
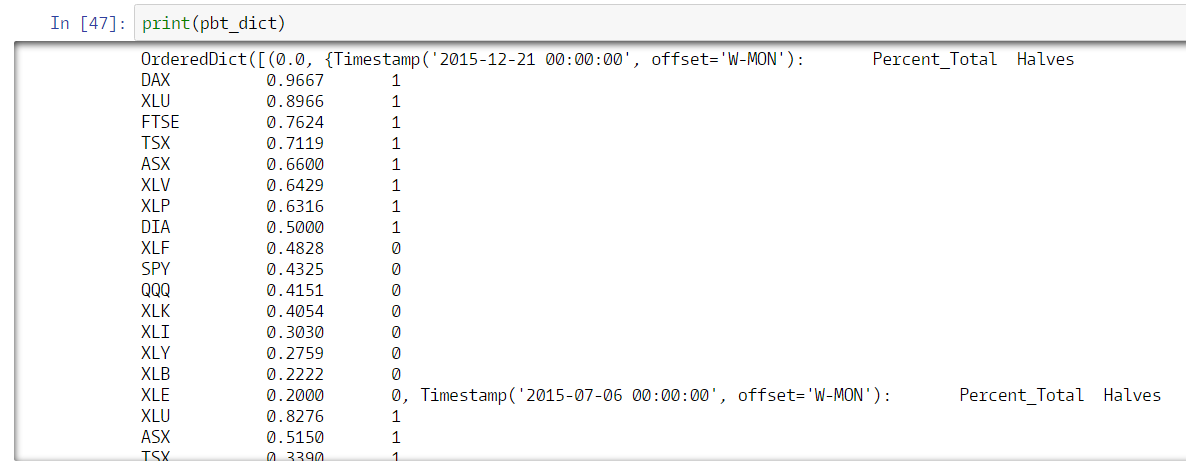
Next, I iterate over each return threshold partitioning the ETF's percent of total stocks greater than the threshold into two groups. Groups assigned '1' have a percentage in the top half of results and those assigned '0' have a percentage in the bottom half.
Sample output of `pbt_dict` output.
Now I calculate a theoretical holding period return of one week. To test whether mean reversion is a tradeable opportunity, this return assumes you long the bottom half of stocks i.e., the stocks with lowest percentage of components exceeding a return threshold, while shorting the top half of stocks i.e., the stocks with the highest percentage of components exceeding a return threshold. Afterwards I print out the average Long - Short return and the cumulative return for each return threshold.
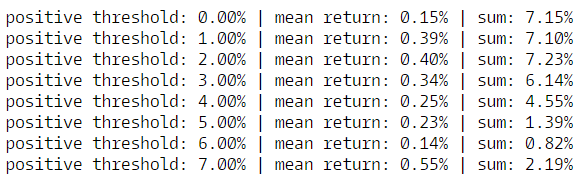
We can see some interesting results already. Now we do the same analysis for the negative return thresholds. This time we take a theoretical long position in the ETF's with the highest percentage of their component stocks falling below a specified threshold while shorting the ETF's with the lowest percentage of their component stocks falling below the threshold.
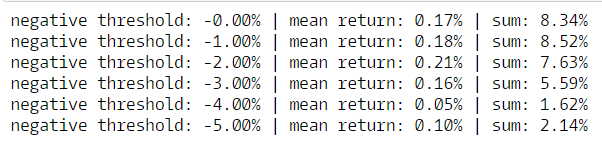
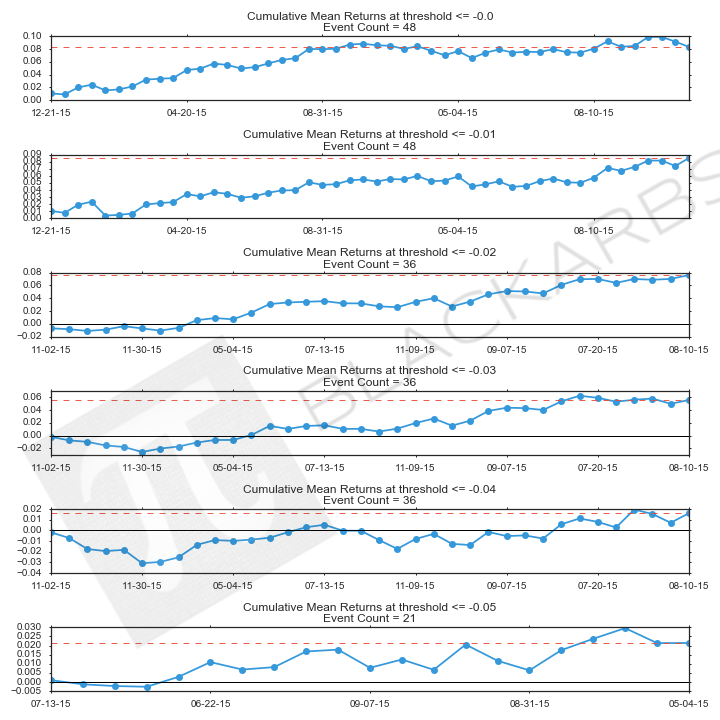
Again we see some interesting results. On an event basis the average return for the negative mean reversion strategy is lower than the positive strategy, however, the cumulative sums of the returns are slightly higher. Let's review the cumulative return plots before drawing any conclusions.
POsitive mean reversion strategy returns

Negative mean reversion strategy returns
conclusions
By examining the percentage of ETF component stocks meeting or exceeded a return threshold and comparing the output across ETFs this analysis shows that there are short term mean reversion opportunities. Using positive return thresholds, the strategy calls for going long the ETFs with the lowest percentage of component stocks exceeding a return level and shorting the ETFs with the highest percentage of component stocks exceeding the level. Using the negative return thresholds, the strategy calls for going long the ETFs which the highest percentage of component stocks falling below the return level and going short the ETFs with the lowest percentage of component stocks falling below the return level. There are several details requiring further research but the most important is whether the average return per event(trade) is enough to overcome transaction costs and the bid/ask spread.