PythonQuant
Blackarbs Retirement Strategy Algorithm Debut (Part 1)
Join the growing Blackarbs Research Group Discord community here Get access to the strategy that has returned 48% in live trading since this article was written here (Updated: 2024-Mar-02) Mission Recap Blackarbs current mission is to create automated strategies with the goal of beating the market with superior risk adjusted returns. Originally, I wanted to illuminate some of the more hidden aspects of markets and investing that I found interesting and of value. Over time, that goal crystall
READ MORE →


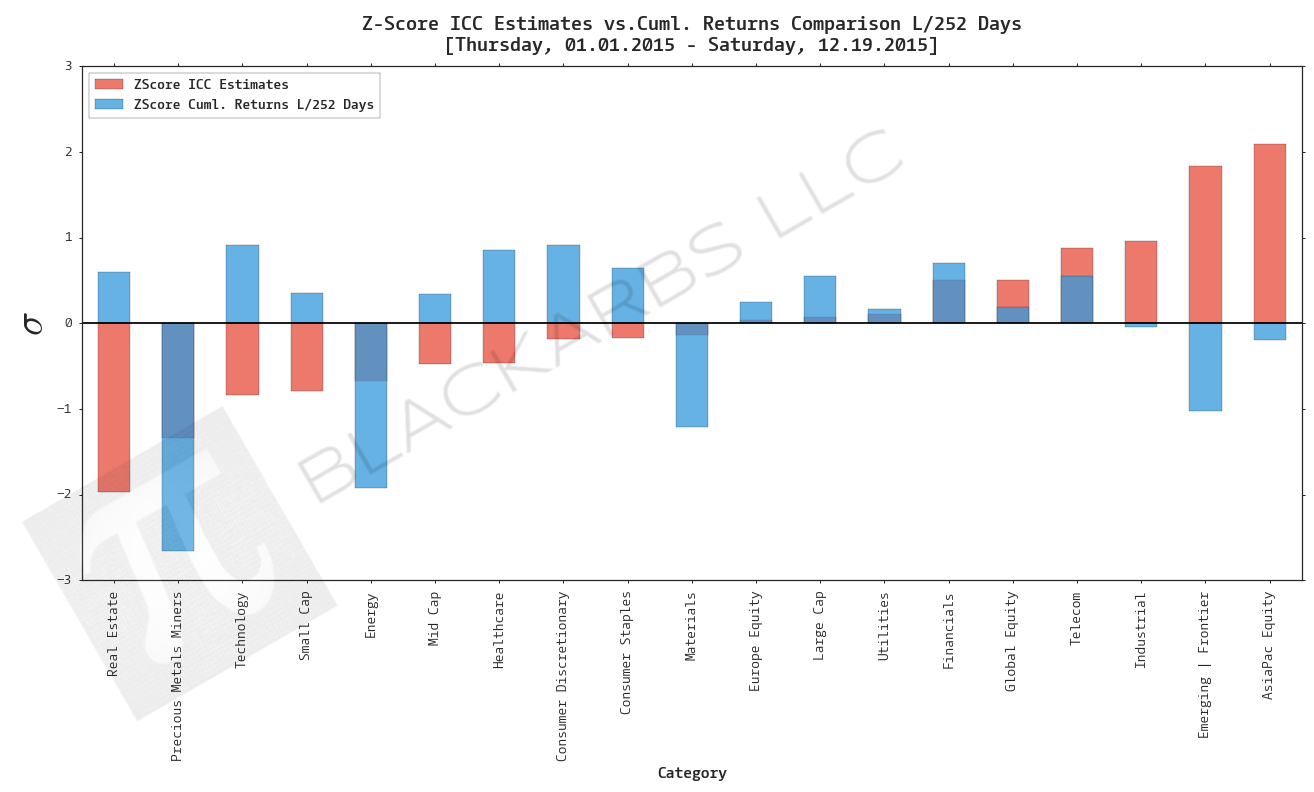

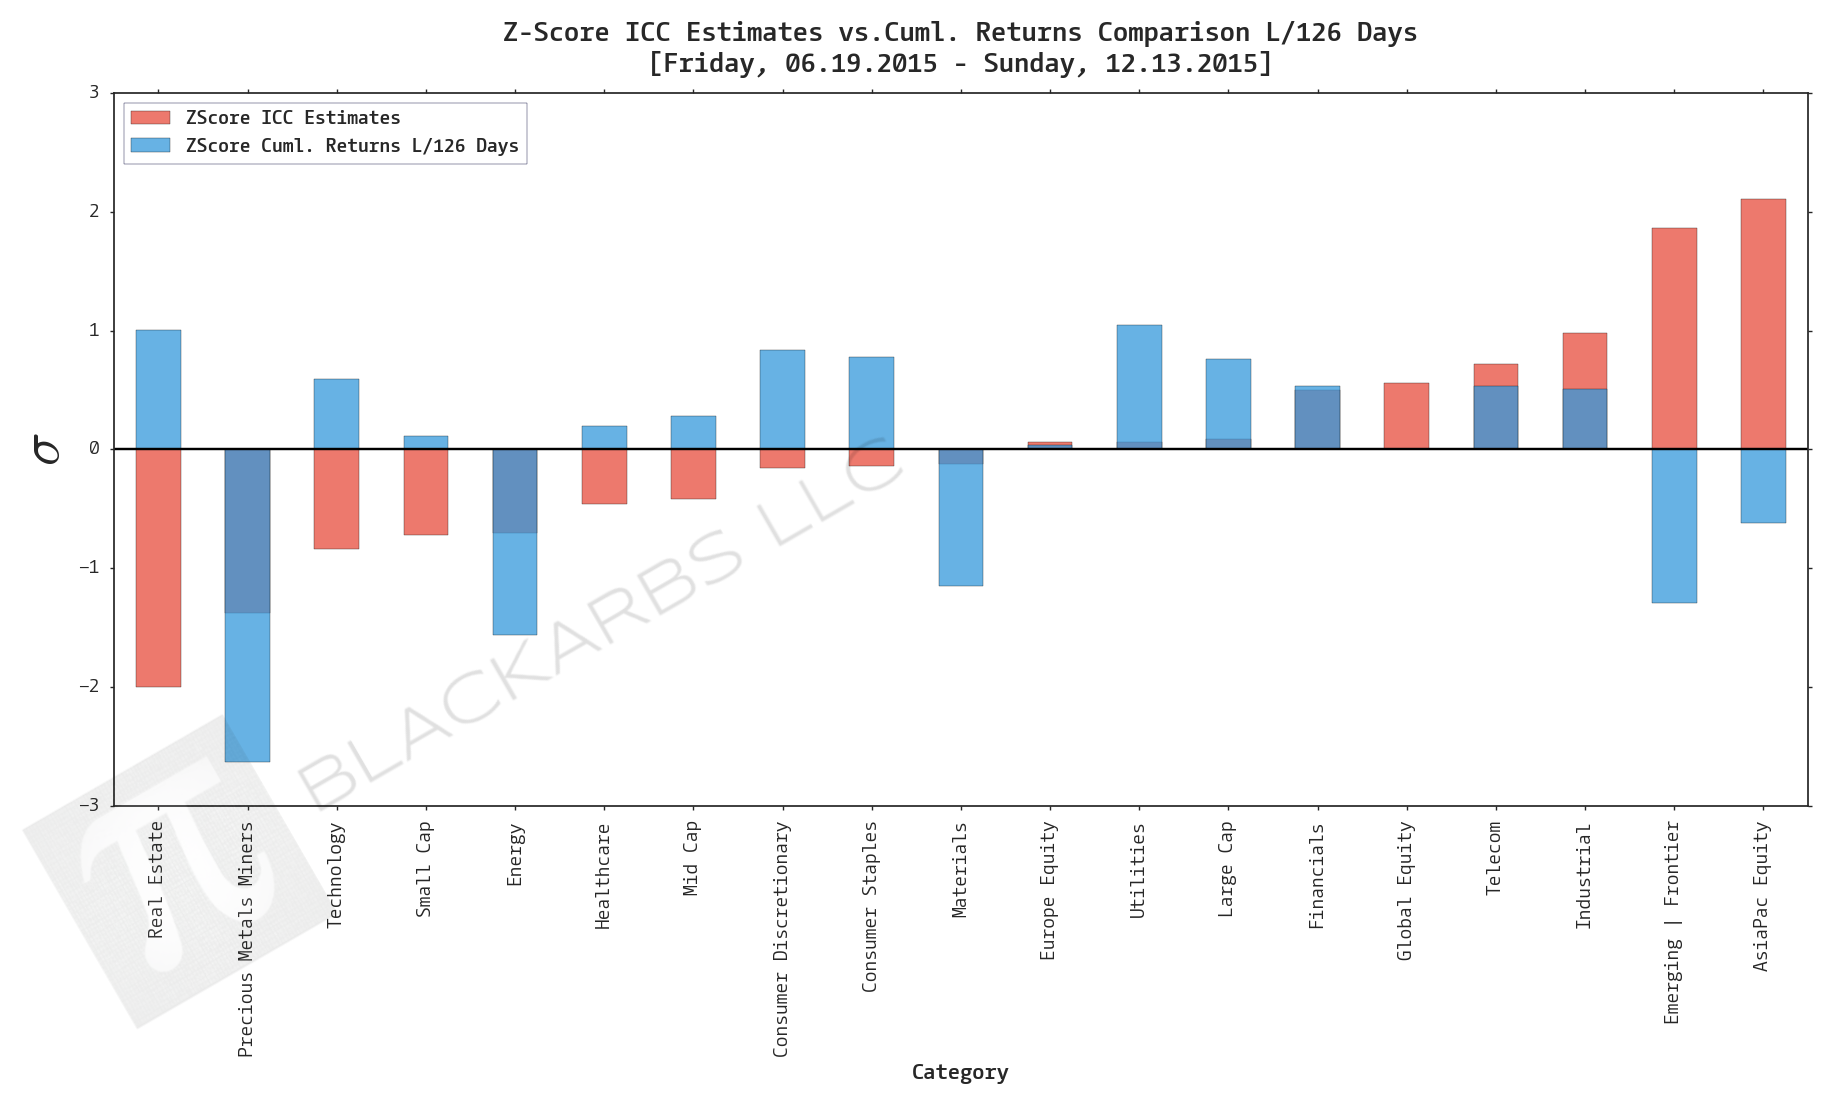
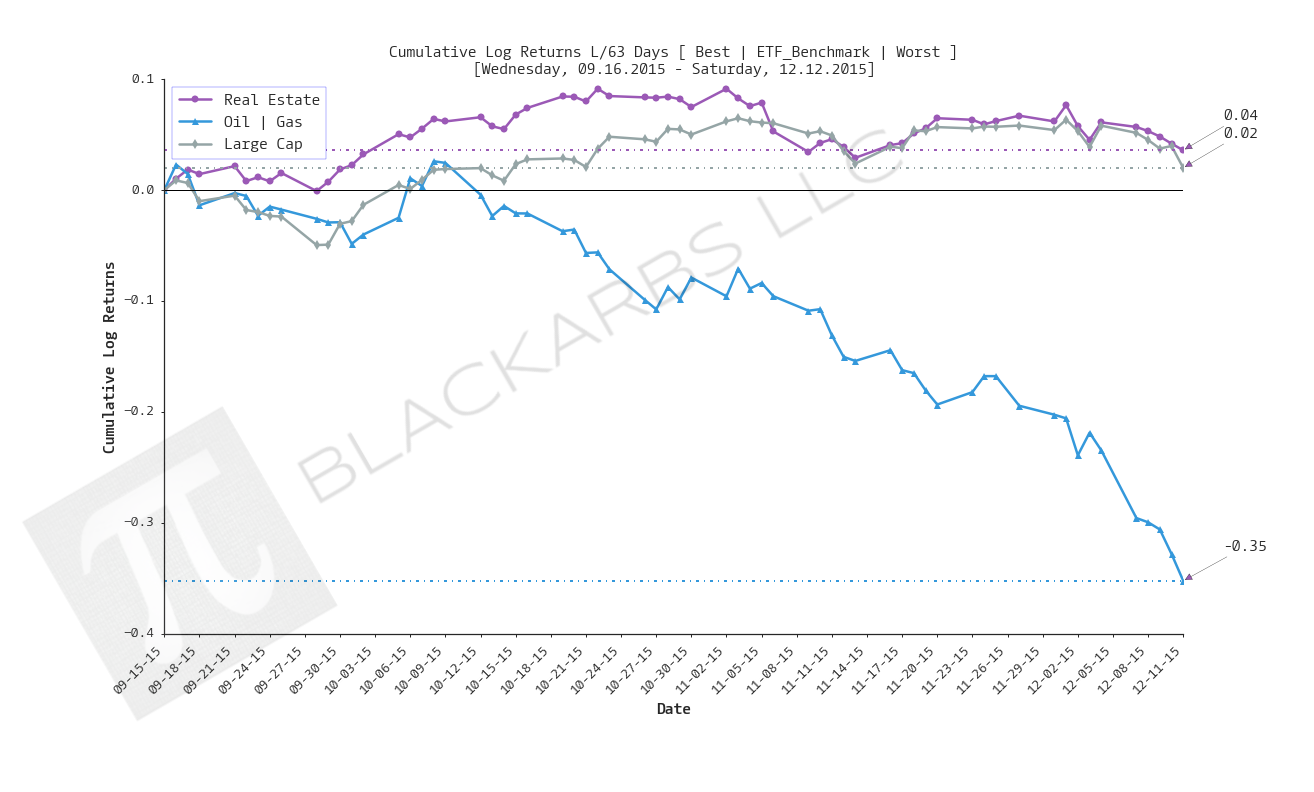
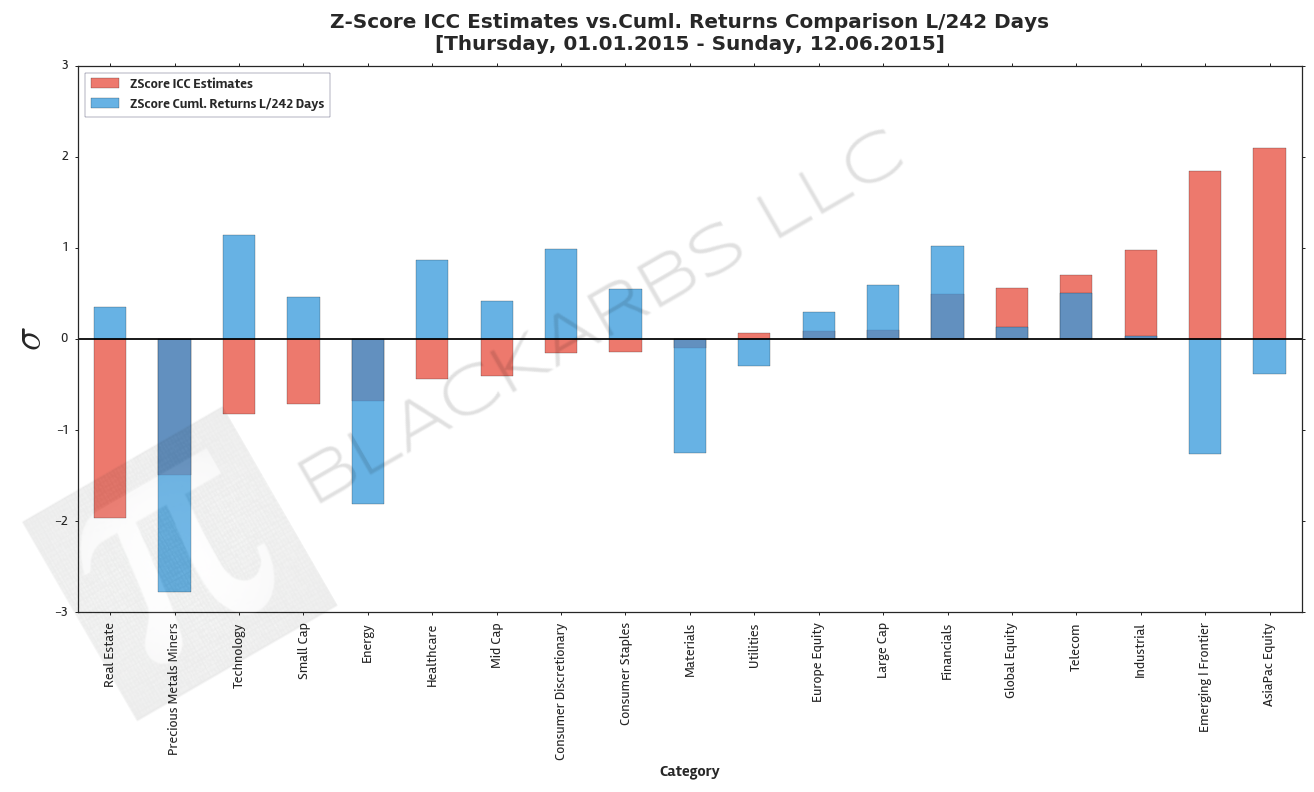
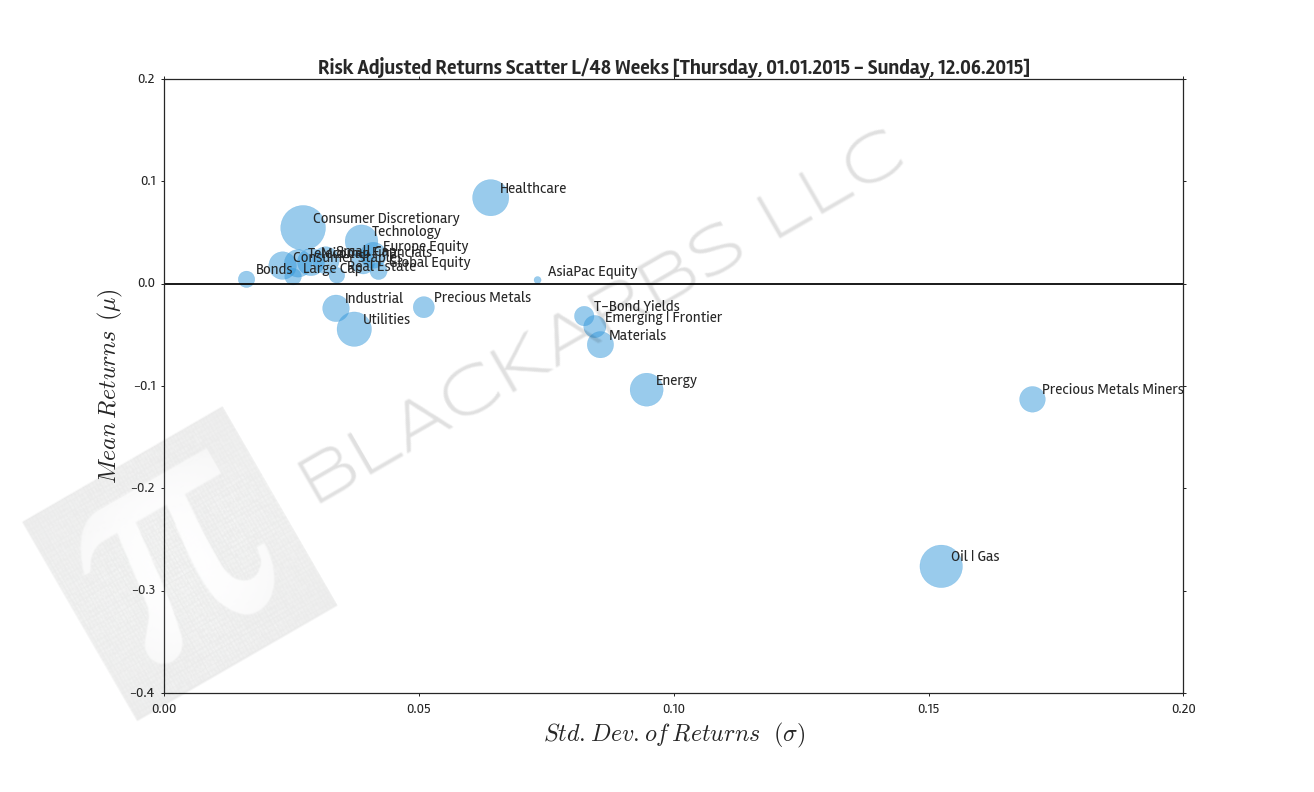
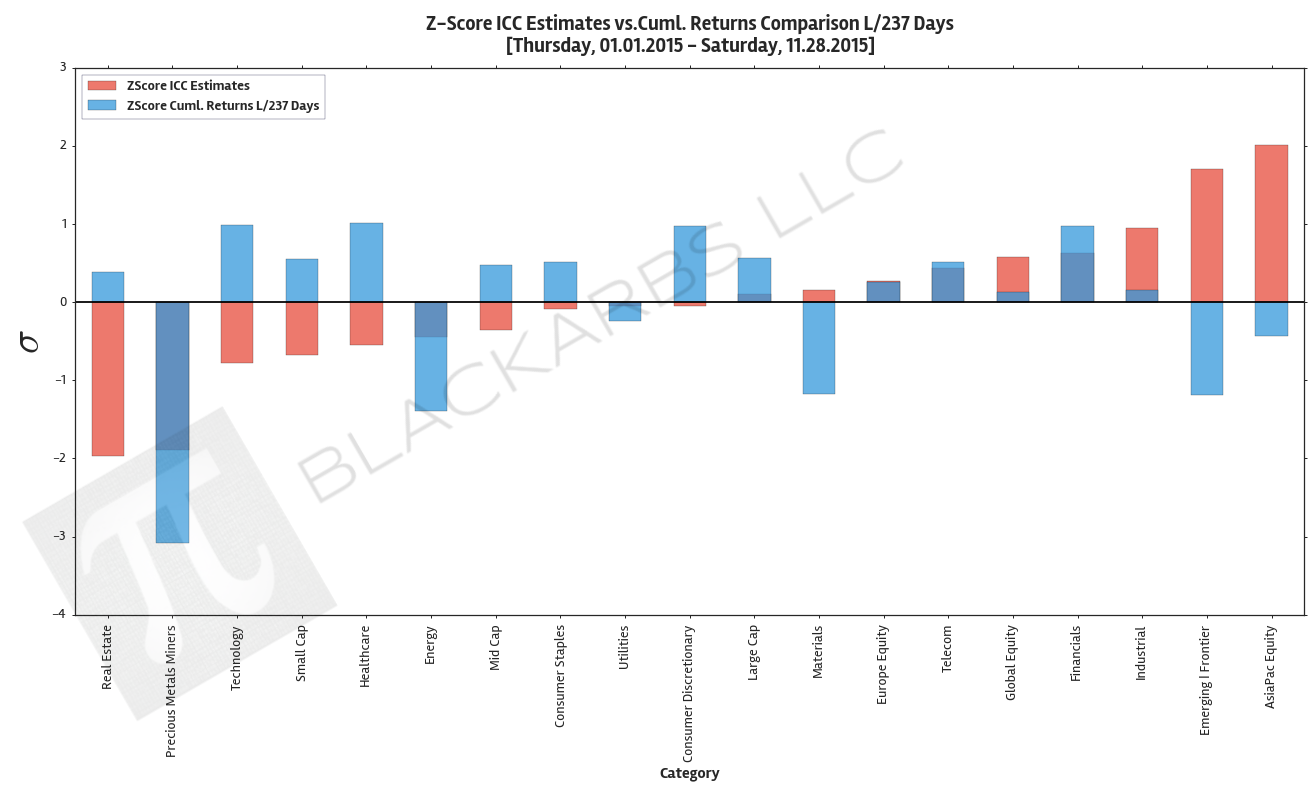
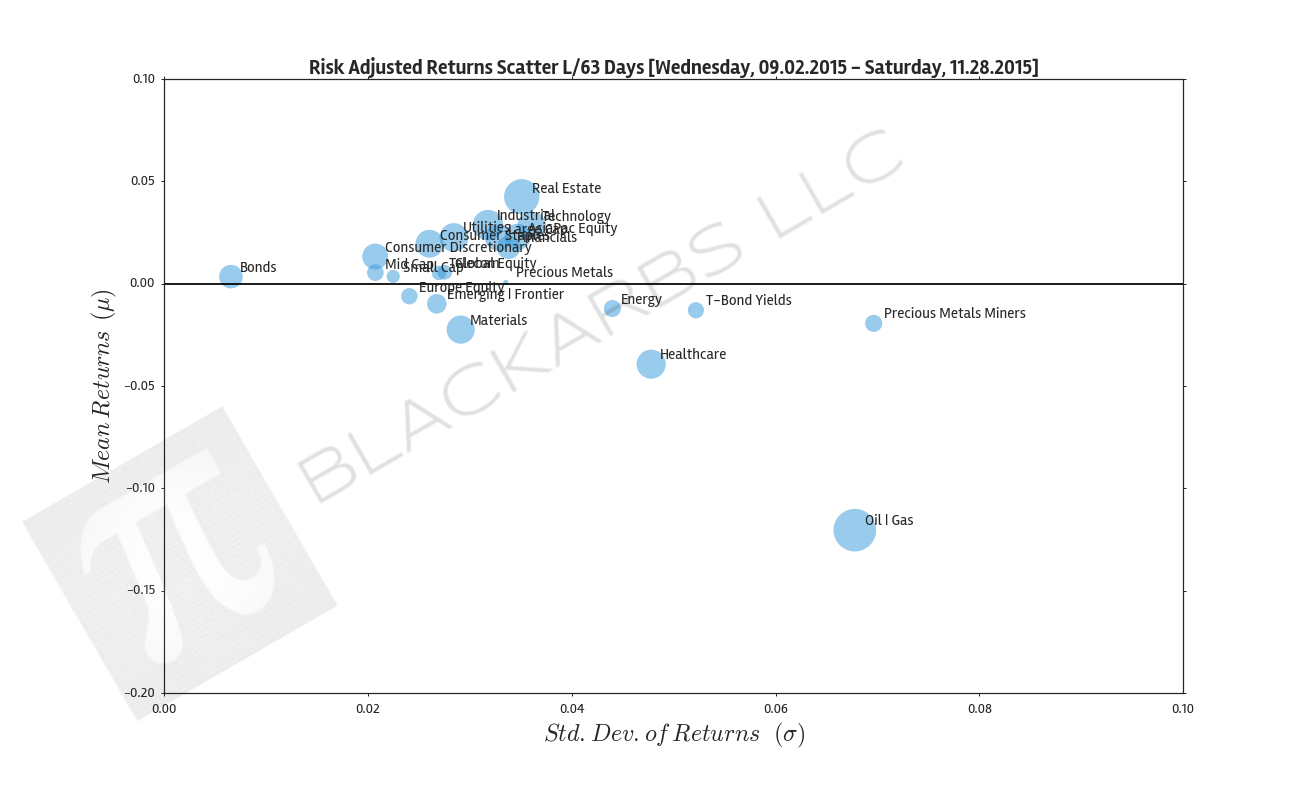
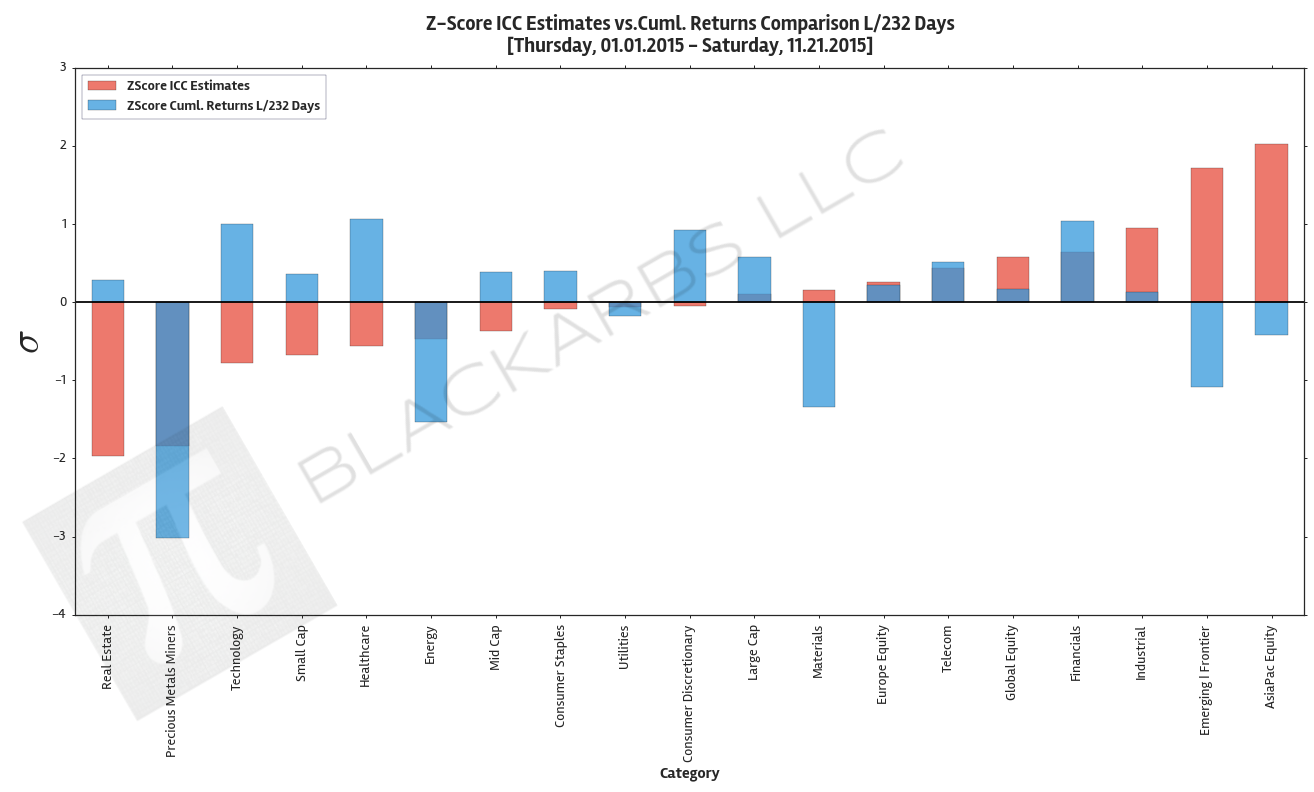
![Composite Sector ETF Valuation Report [6.15.2015]](https://images.squarespace-cdn.com/content/v1/53ac905ee4b003339a856a1d/1434379959959-DE9ZBLAQOS1O0KECSOWK/image-asset.png/img.png)