#block-yui_3_17_2_2_1456020426677_173171 .social-icons-style-border .sqs-svg-icon--wrapper { box-shadow: 0 0 0 2px inset; border: none; }
FOR A DEEPER DIVE INTO ETF PERFORMANCE AND RELATIVE VALUE SUBSCRIBE TO THE ETF INTERNAL ANALYTICS PACKAGE HERE
LAYOUT (Organized by Time Period):
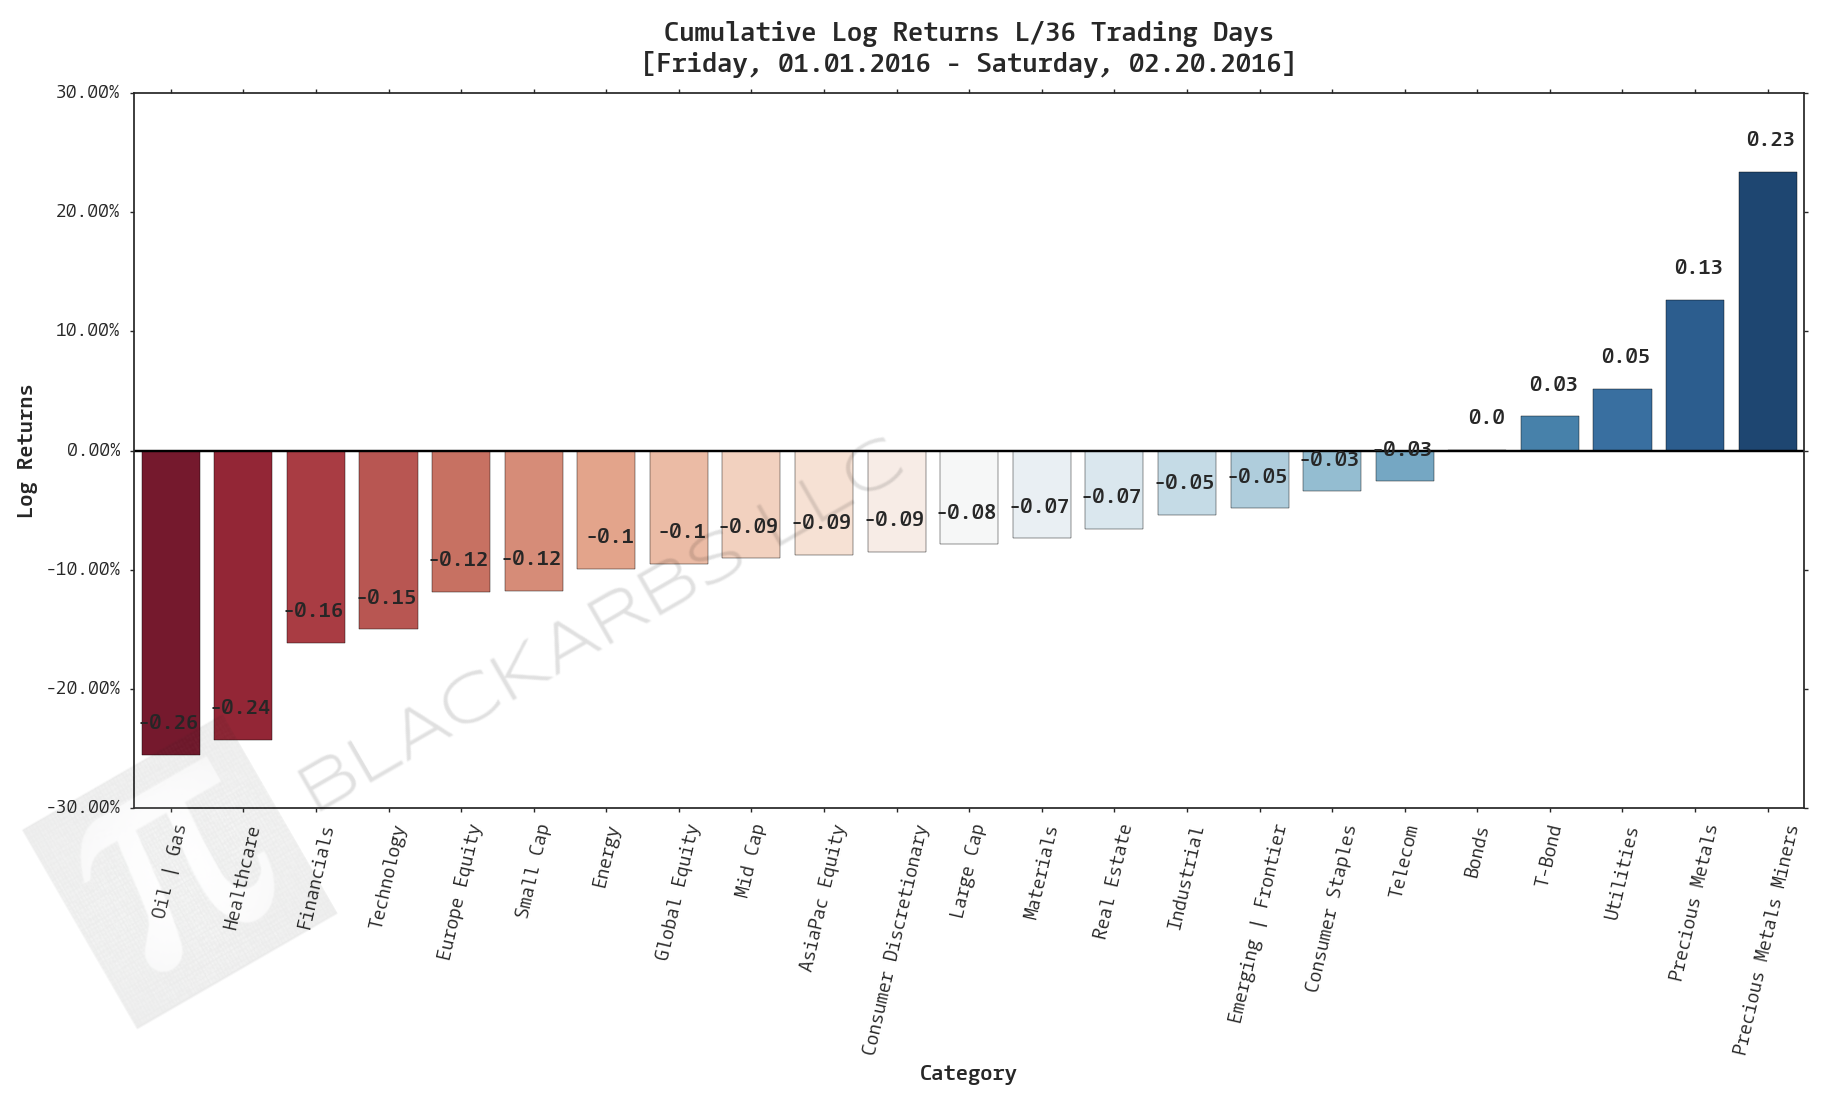
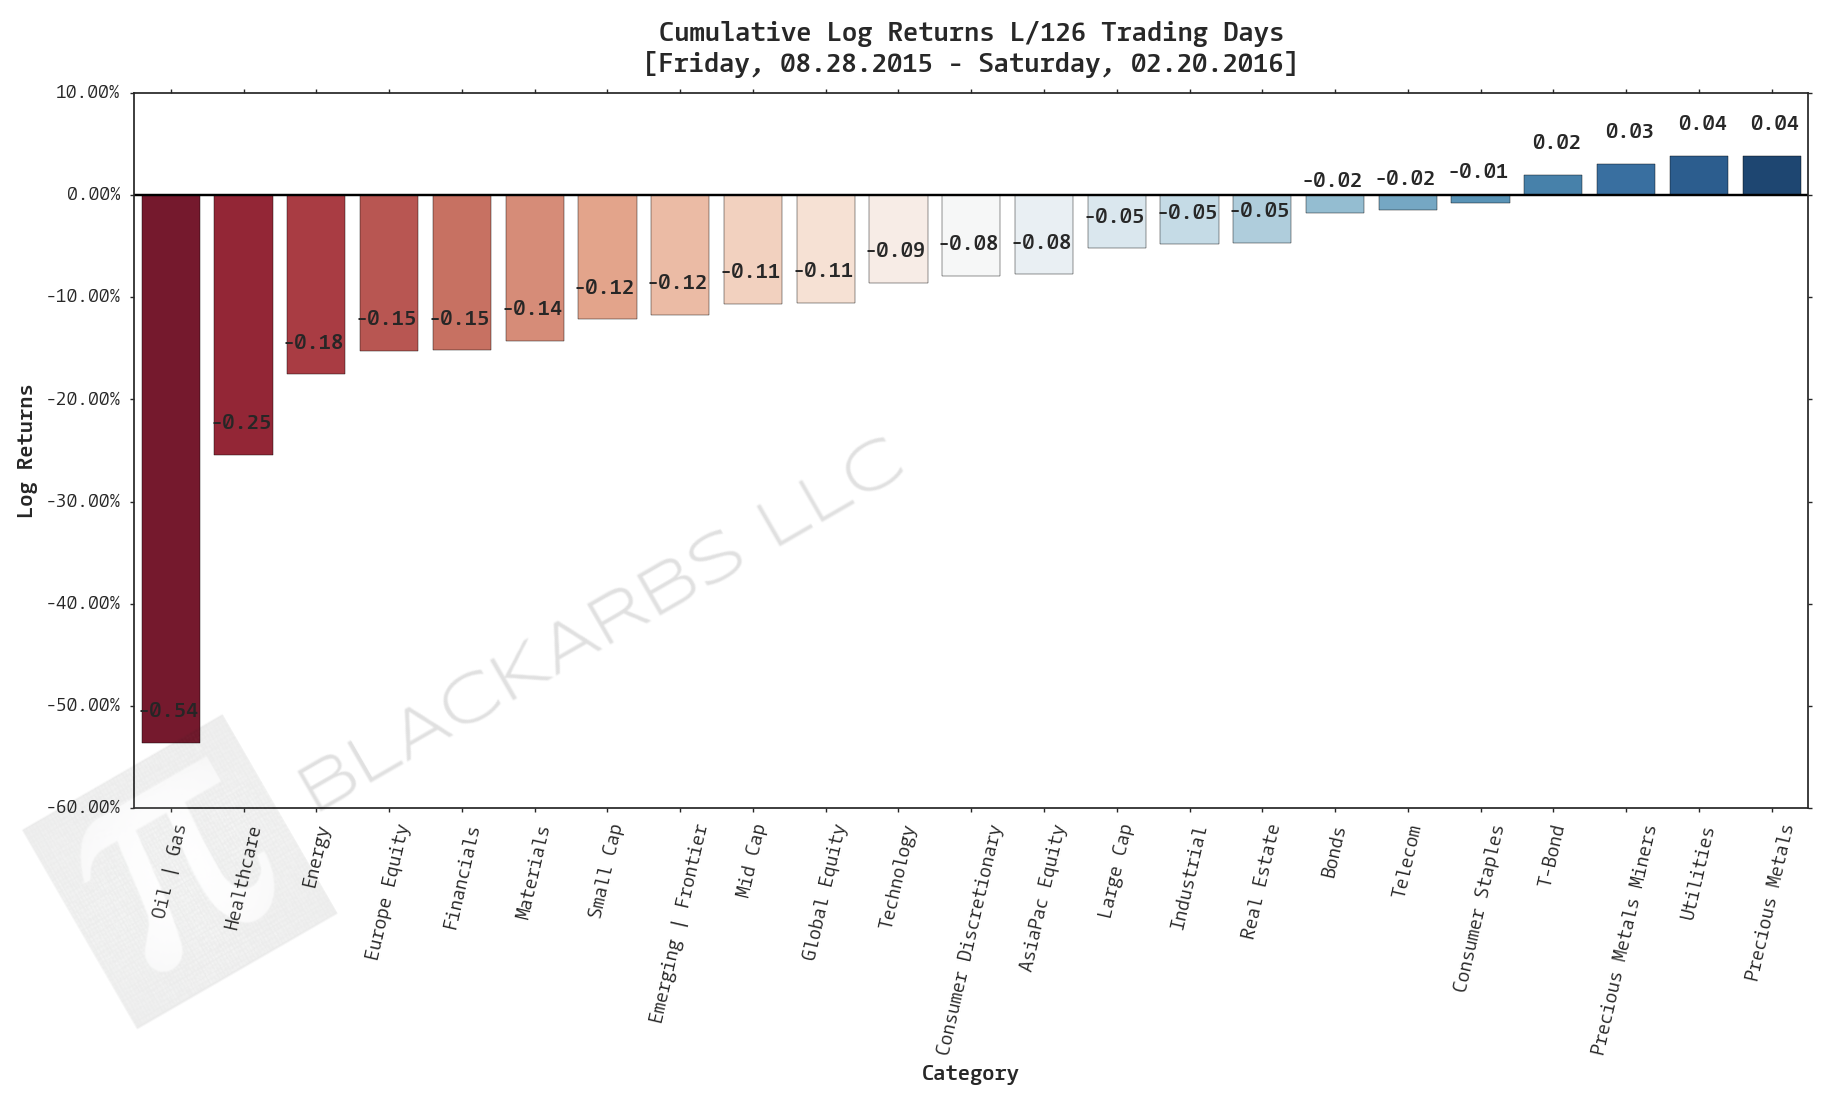
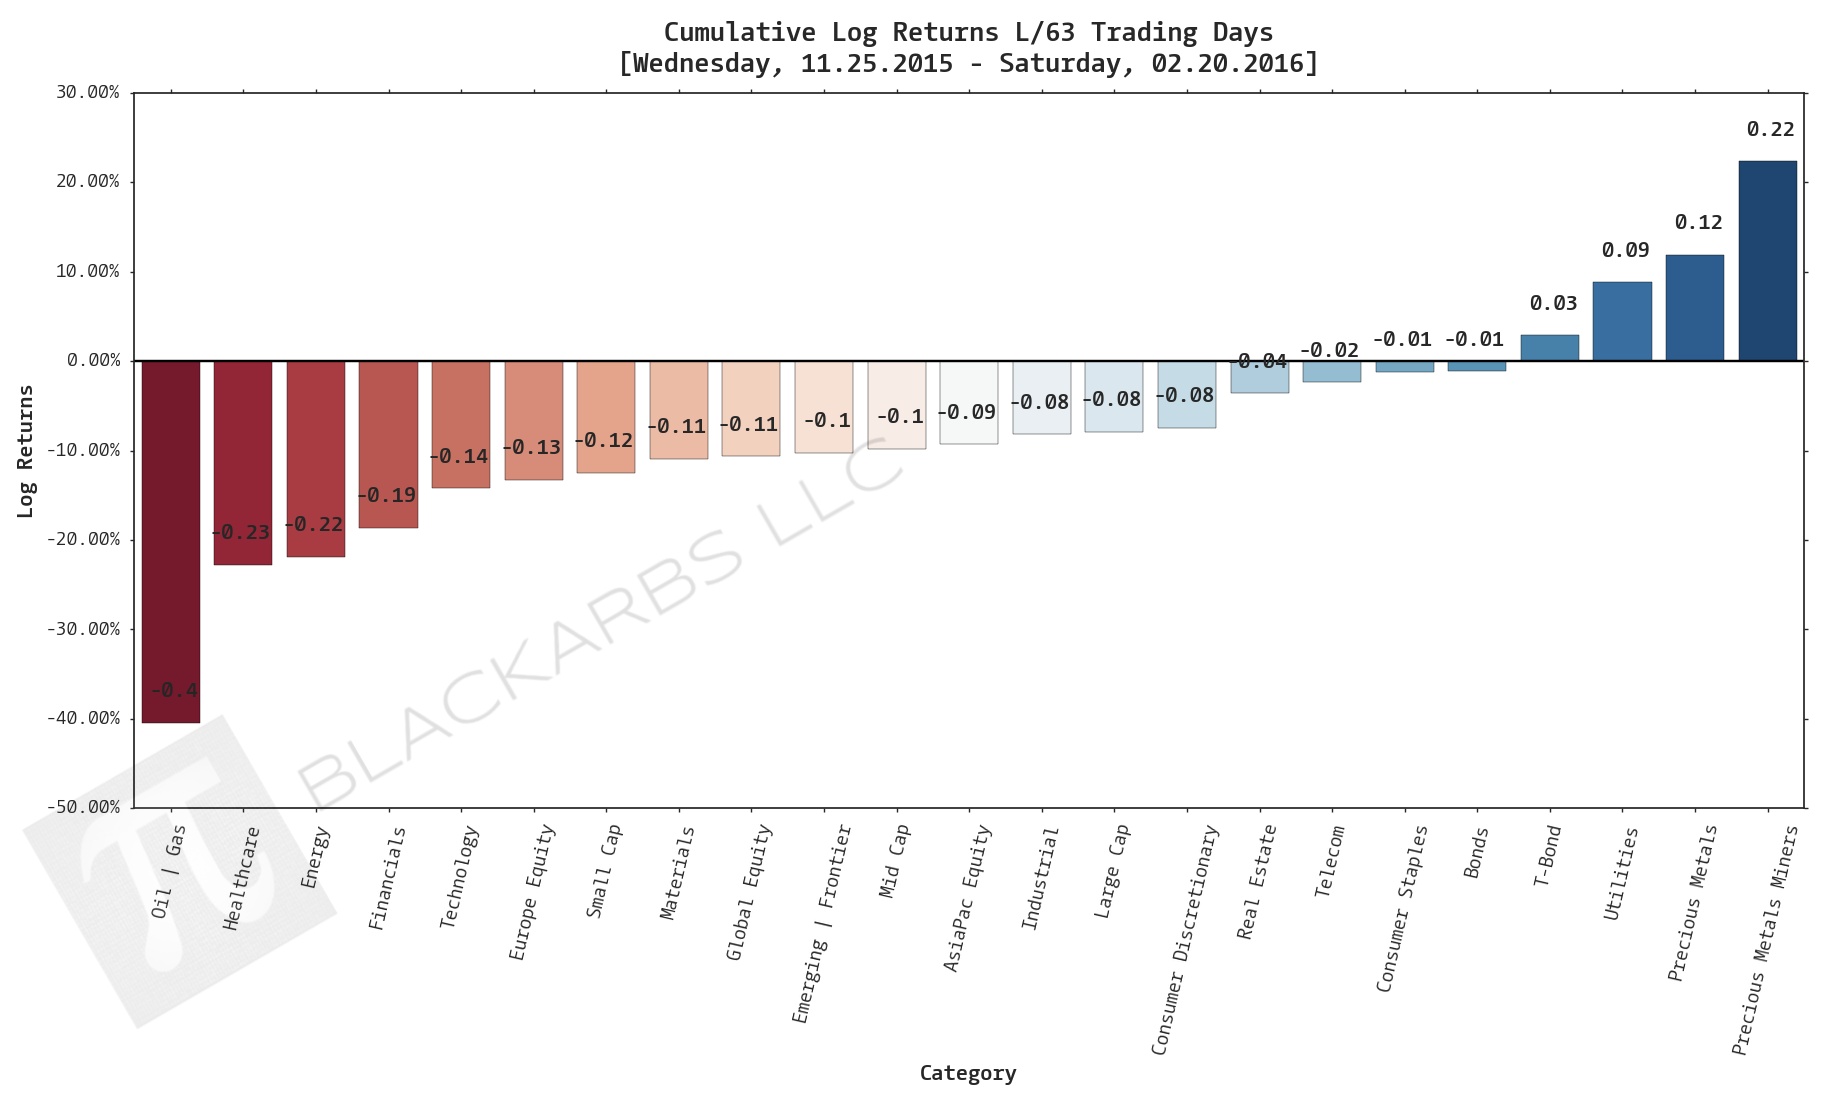
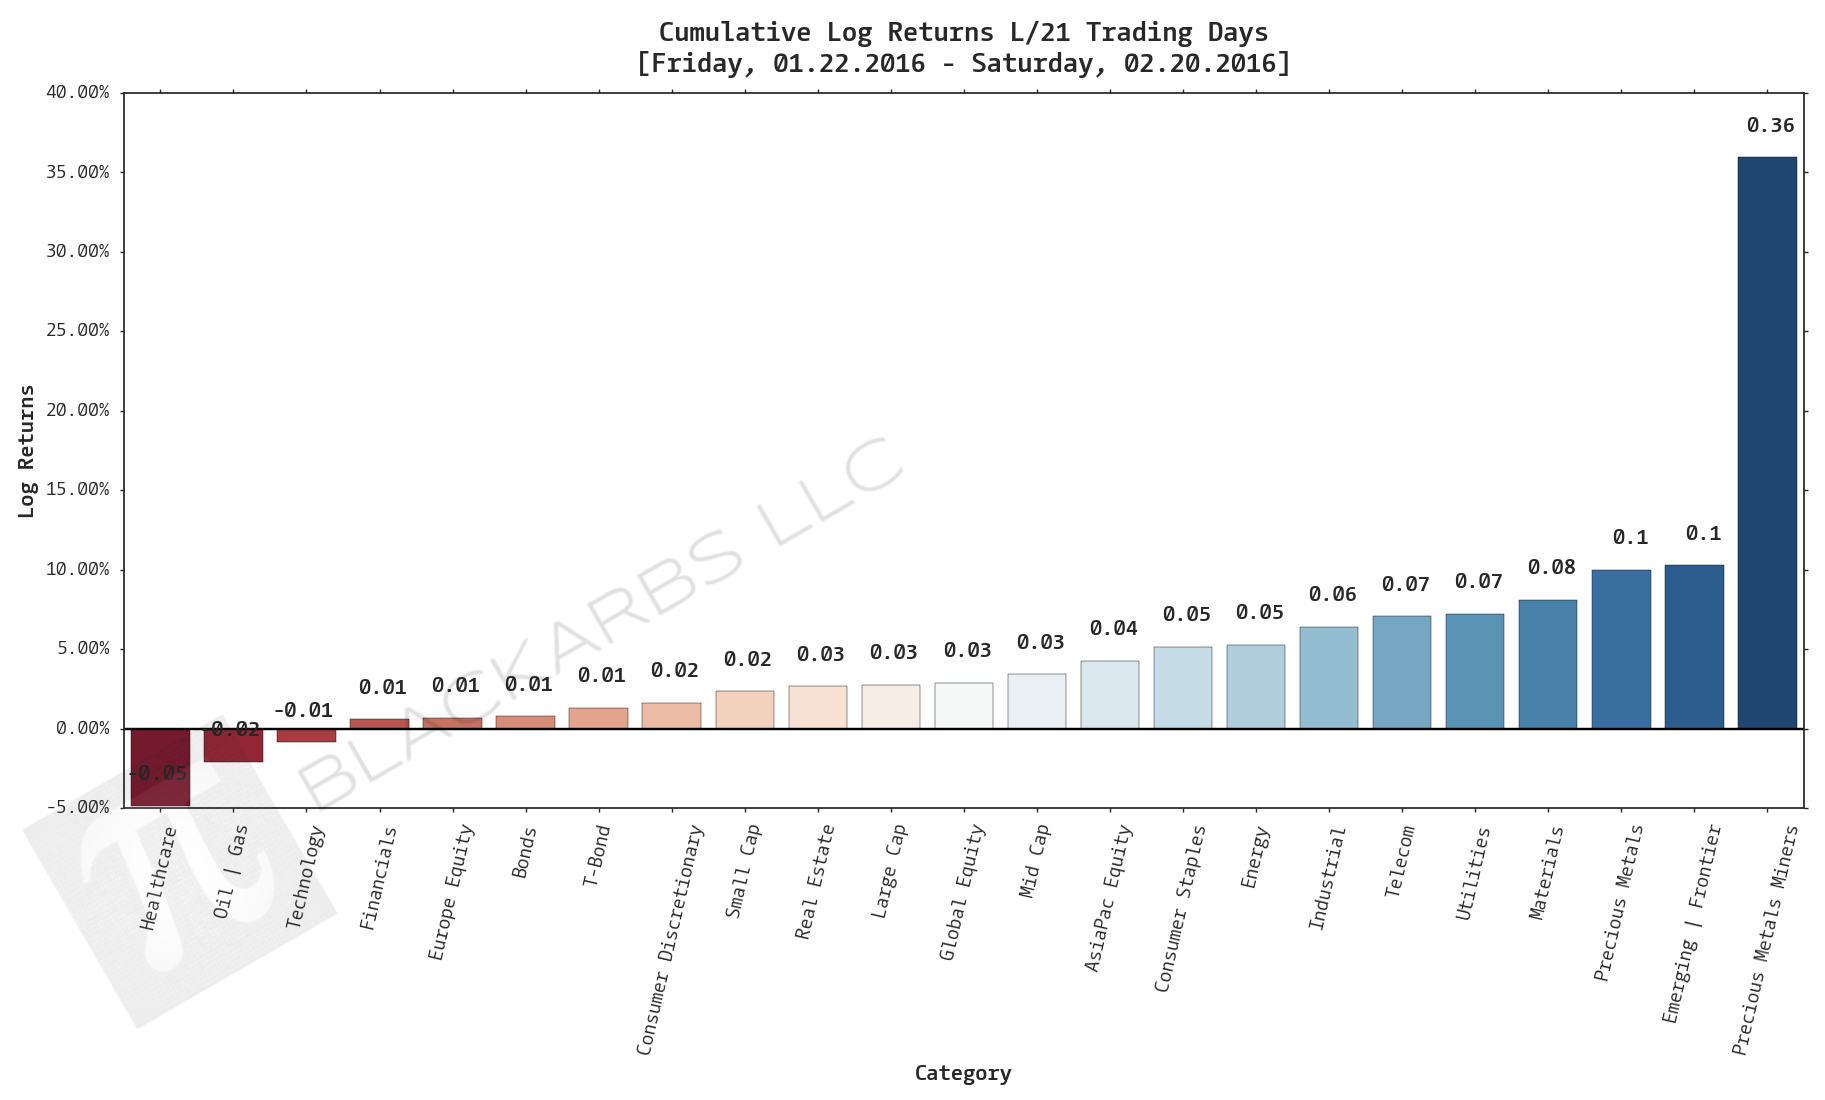
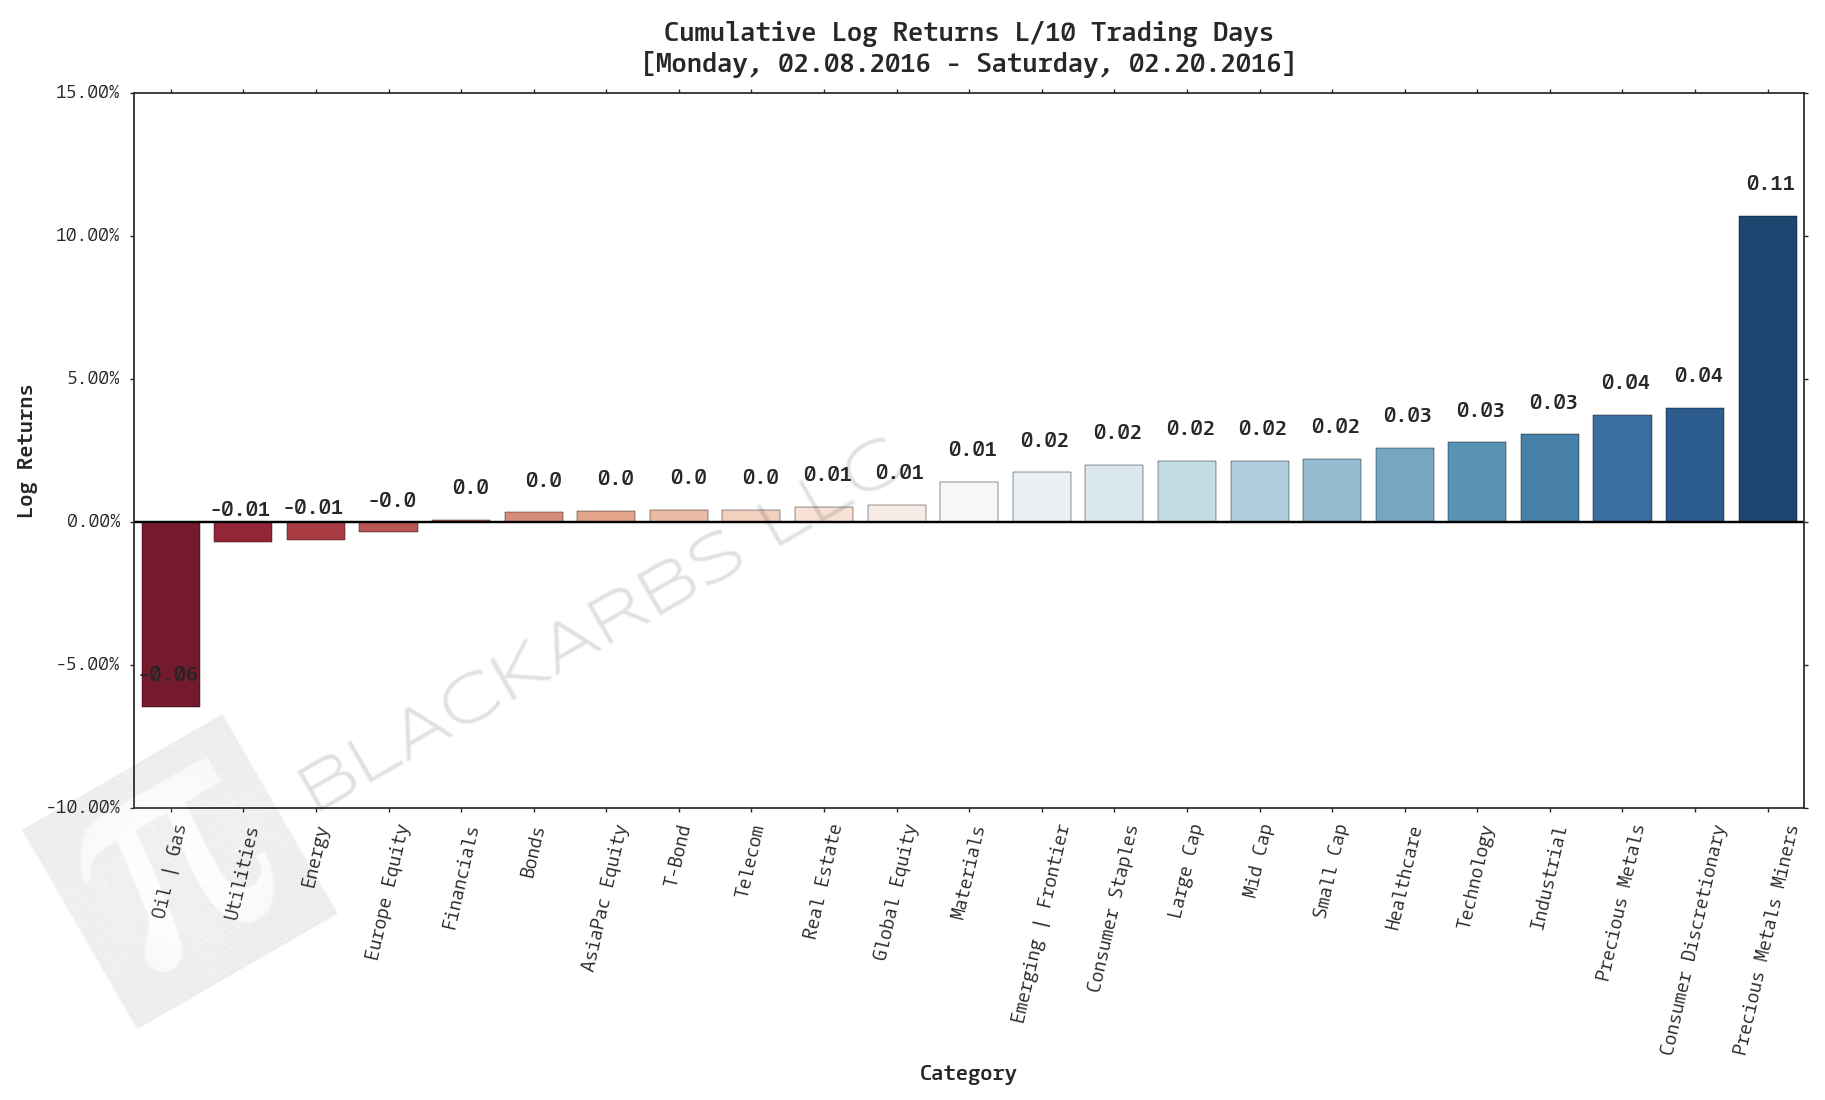
Composite ETF Cumulative Returns Momentum Bar plot
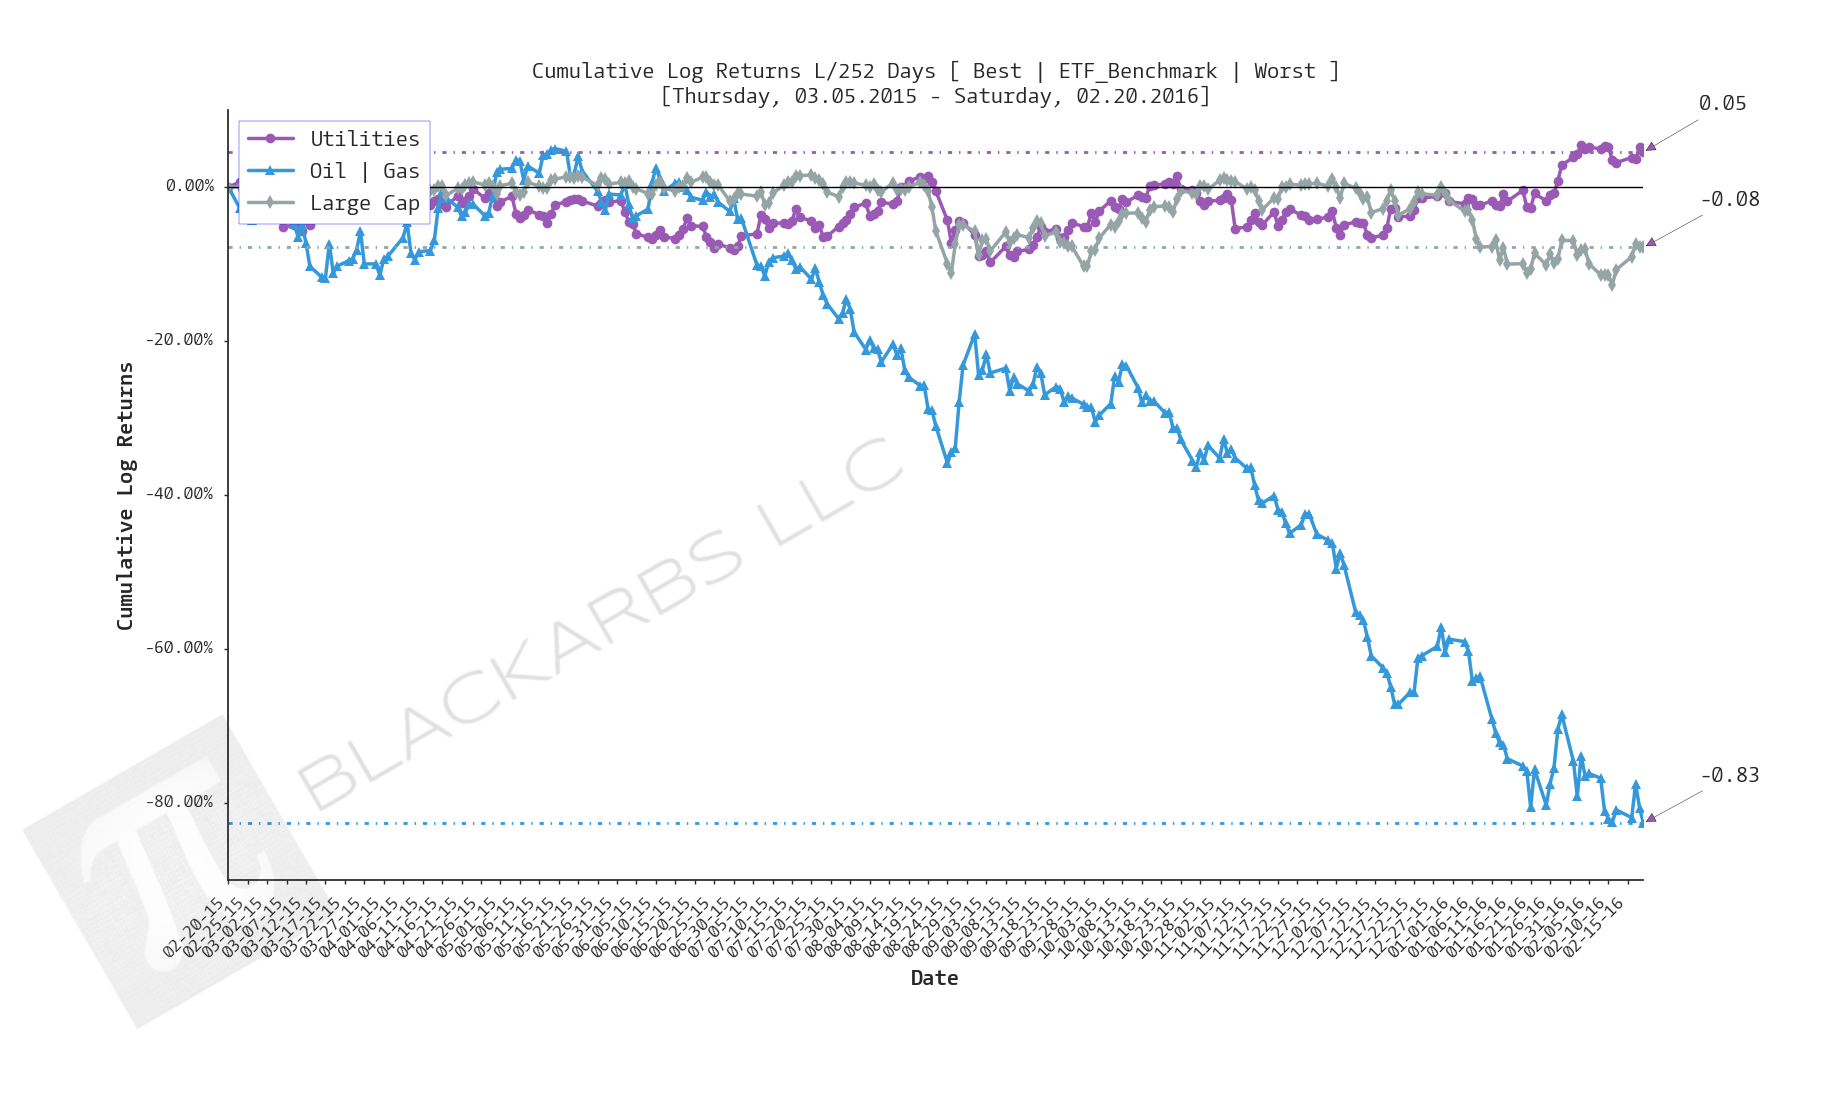
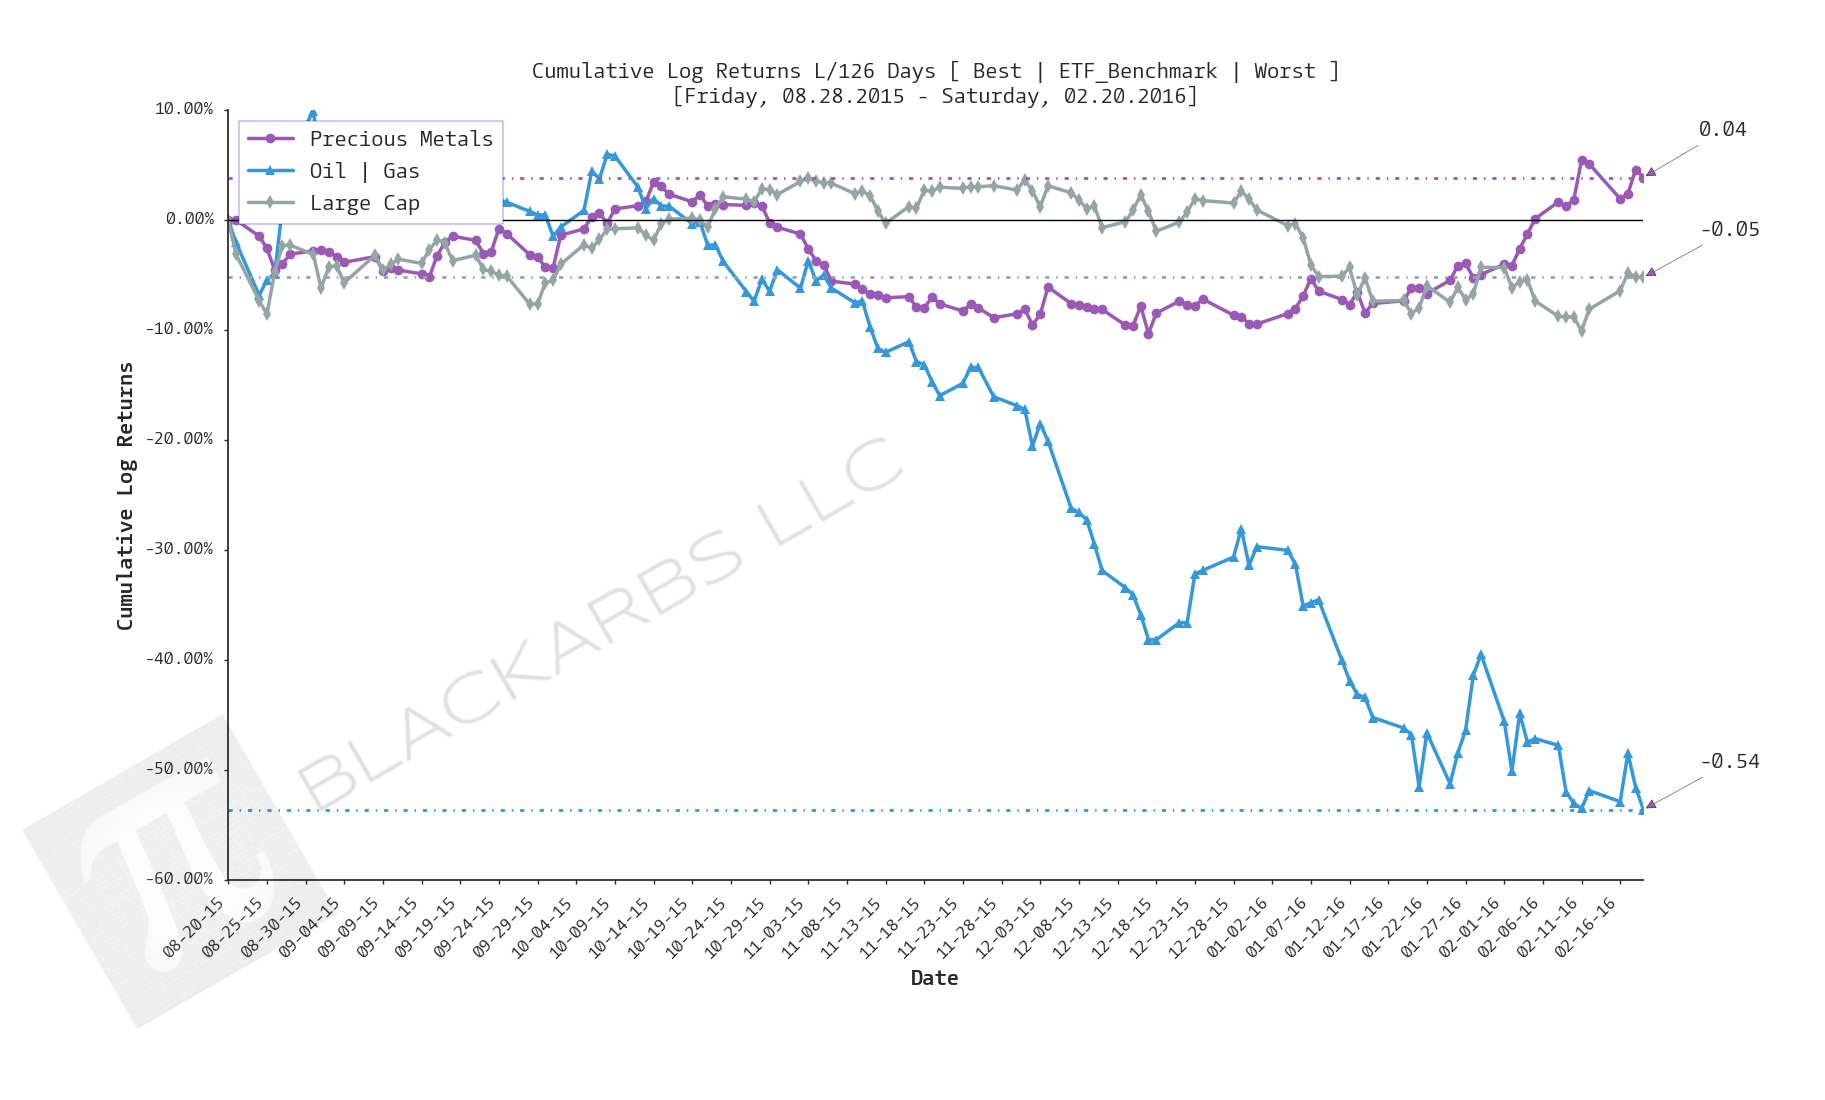
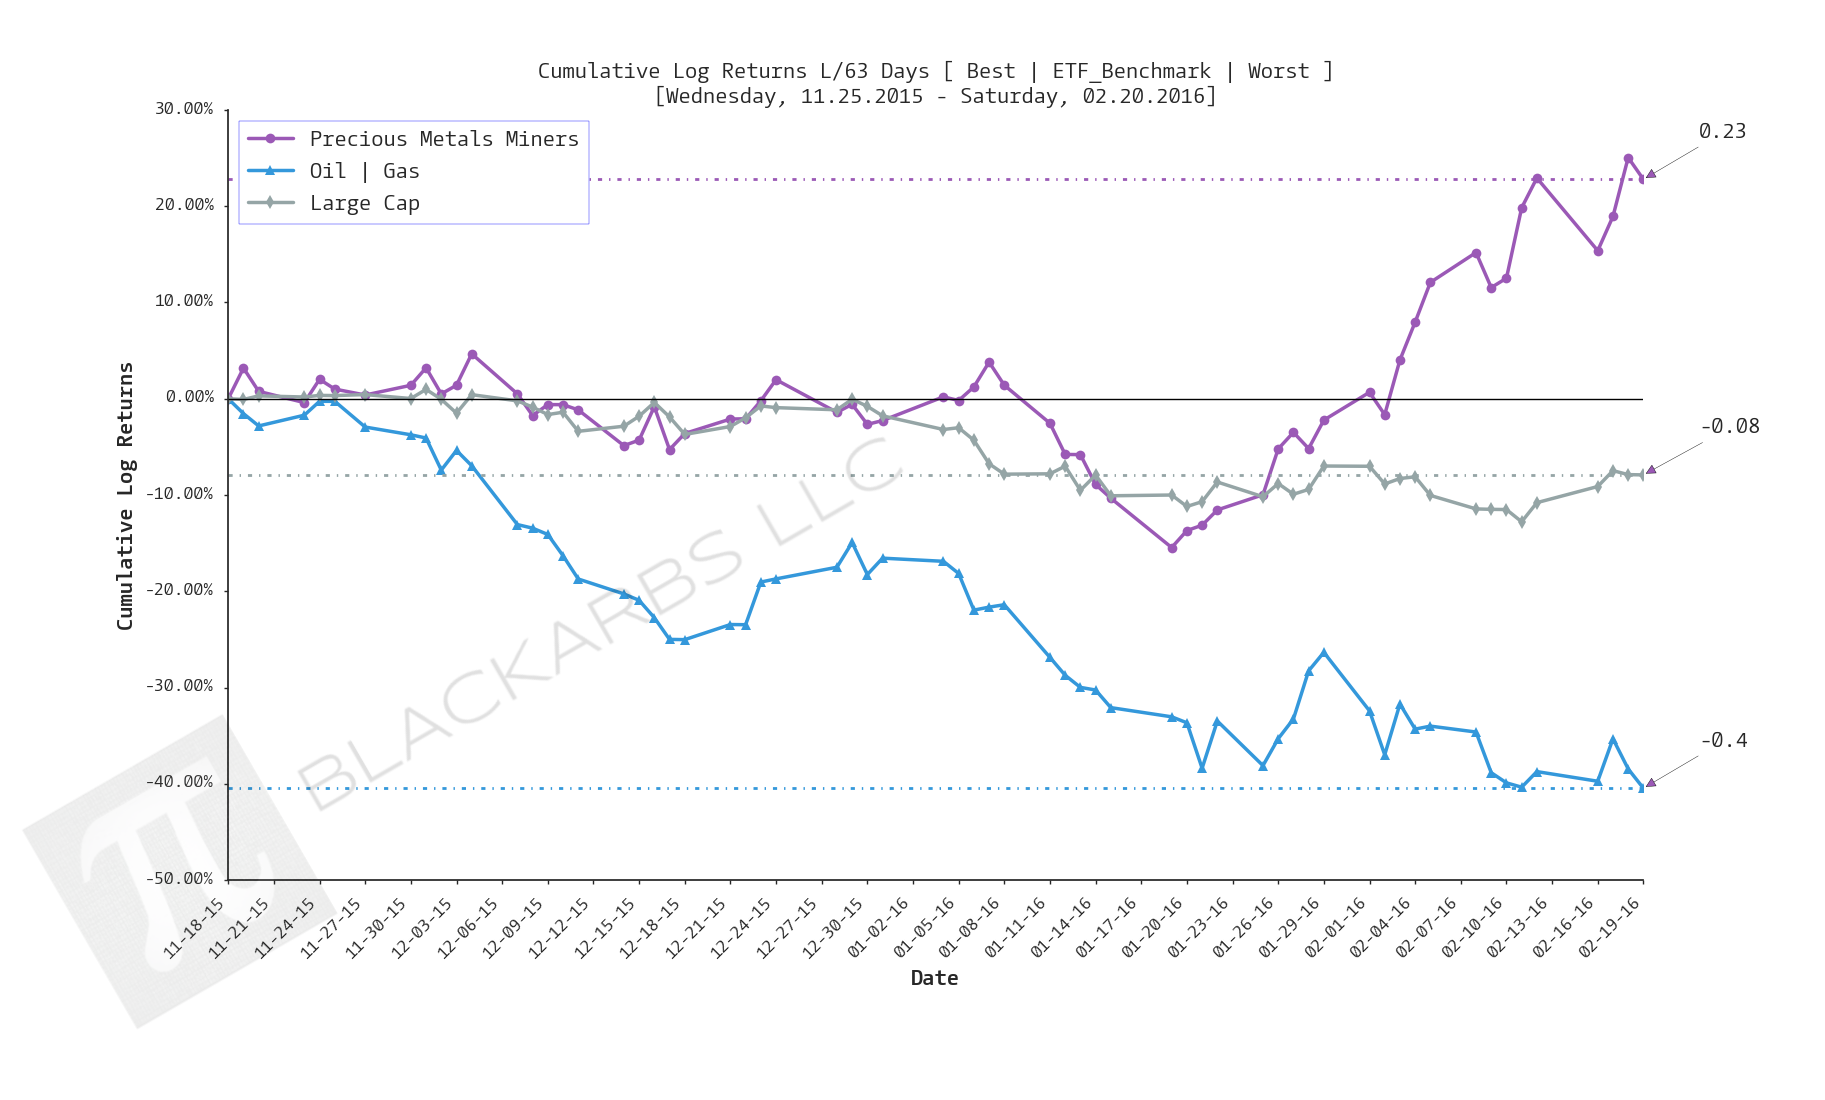
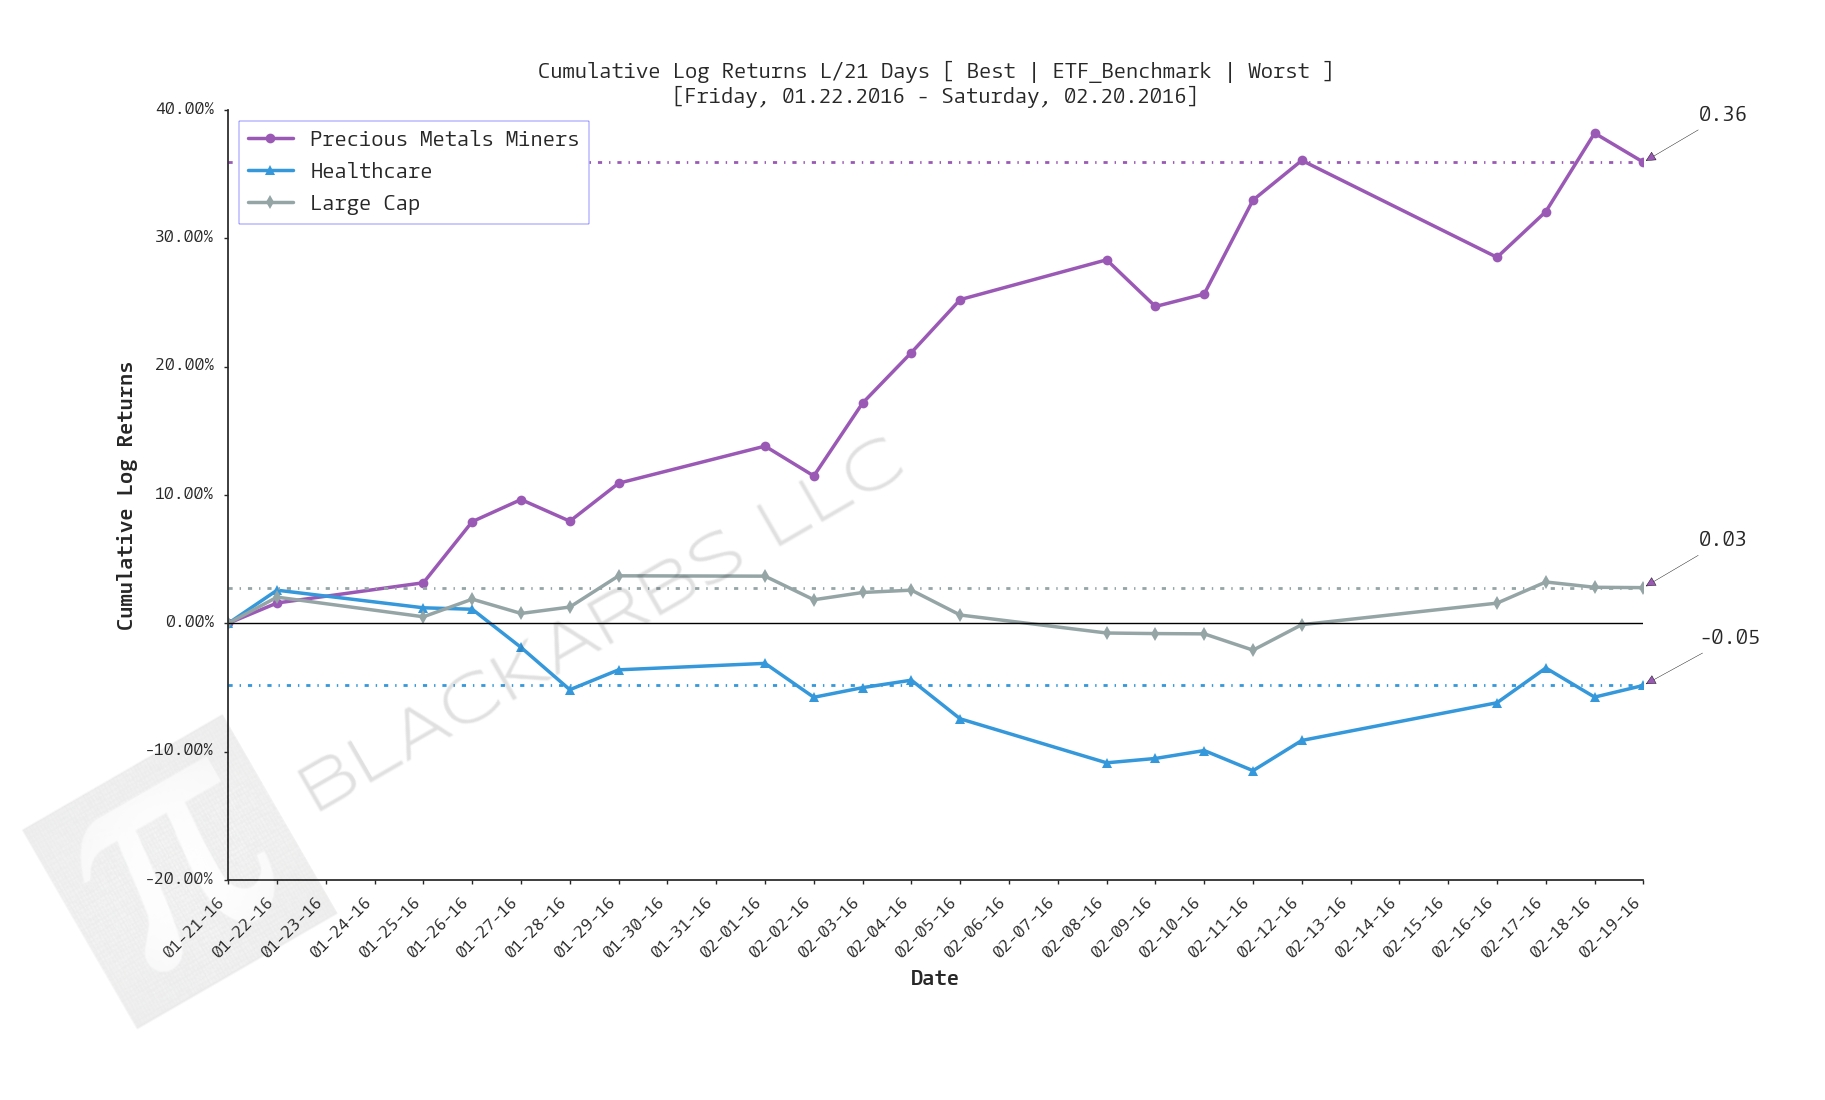
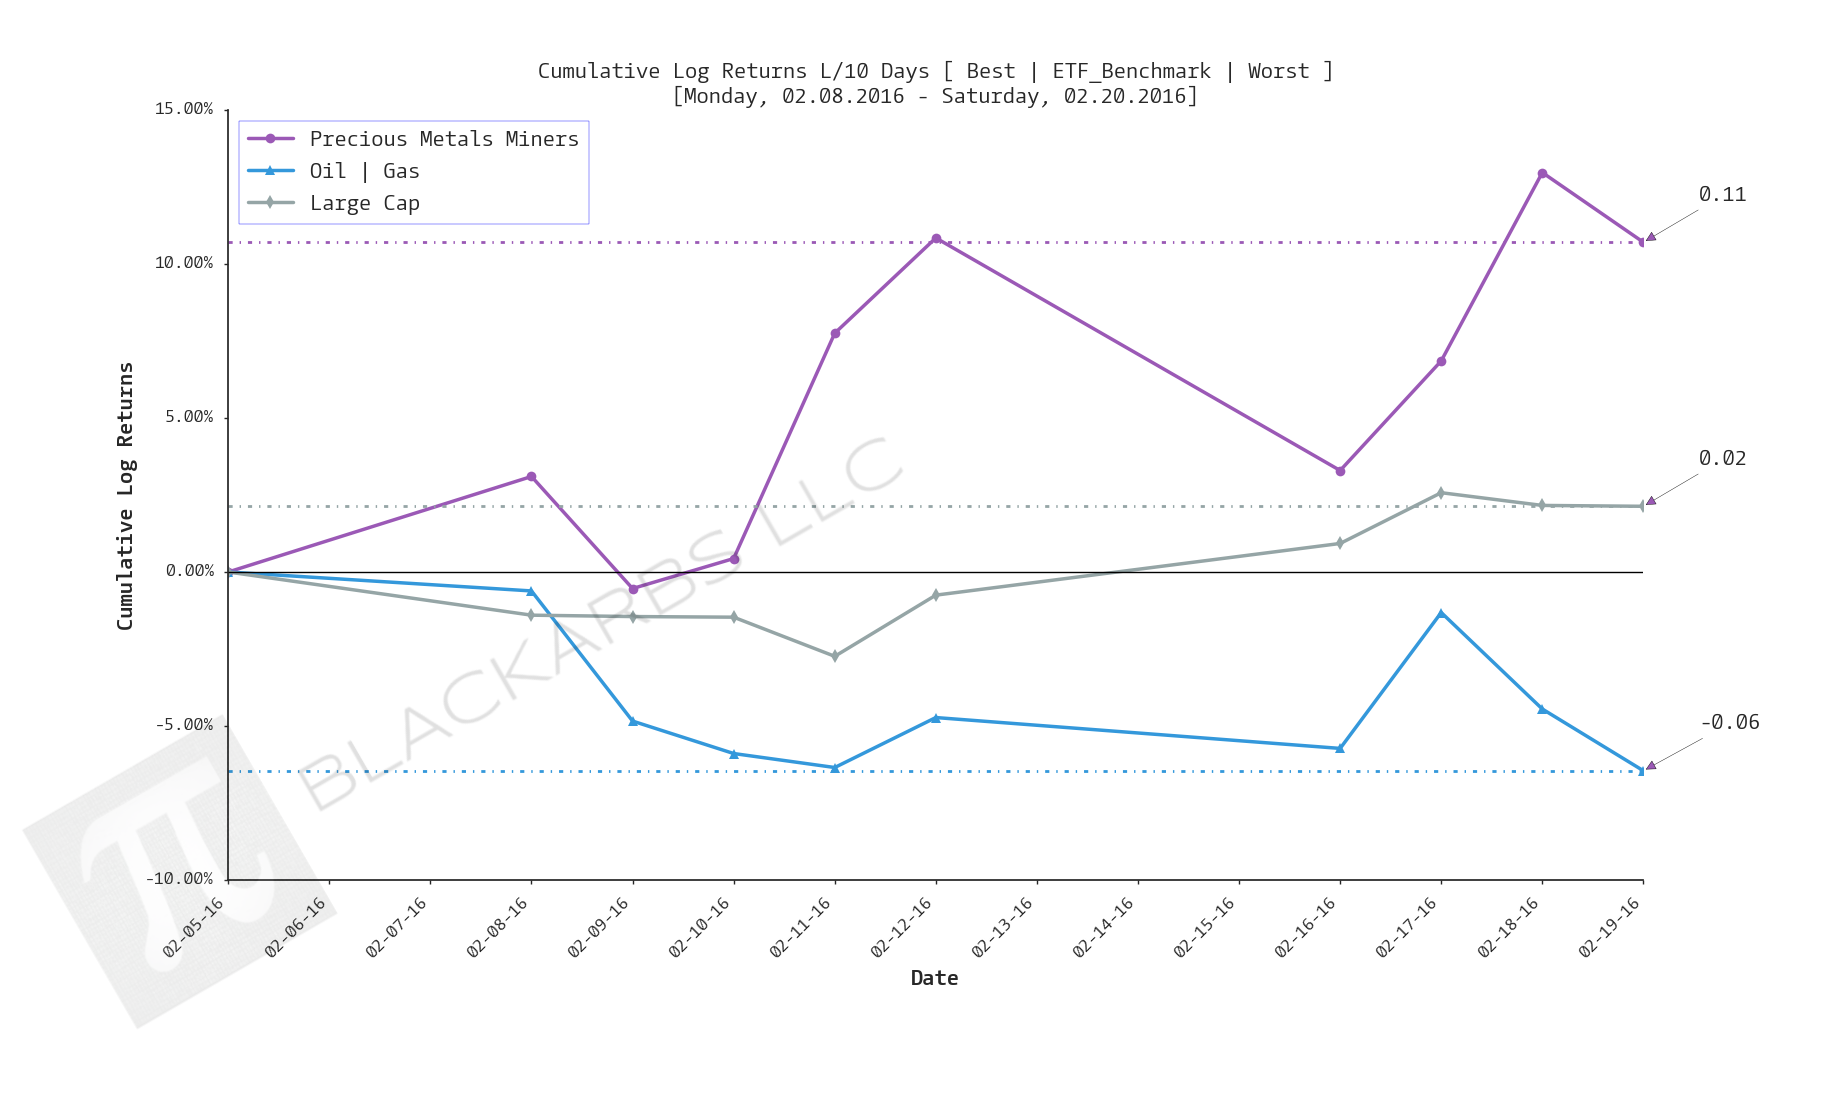
Composite ETF Cumulative Returns Line plot
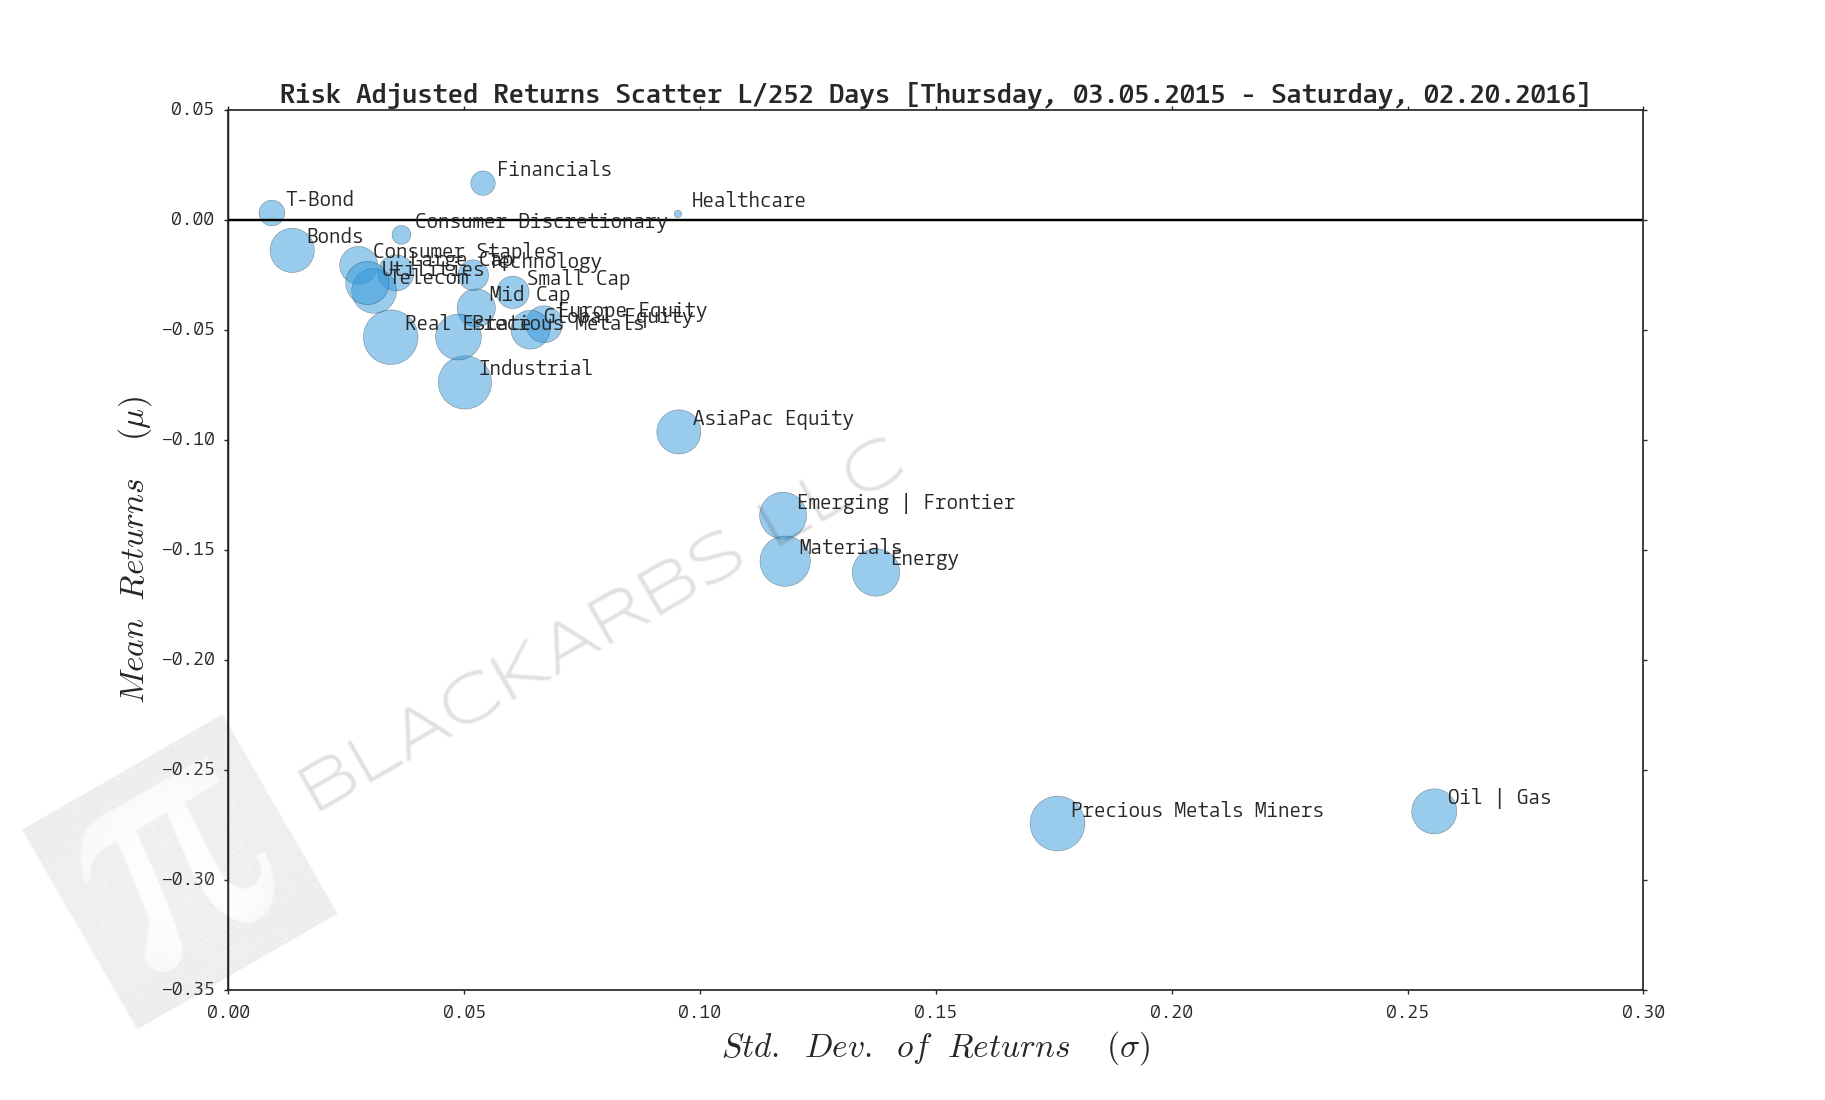
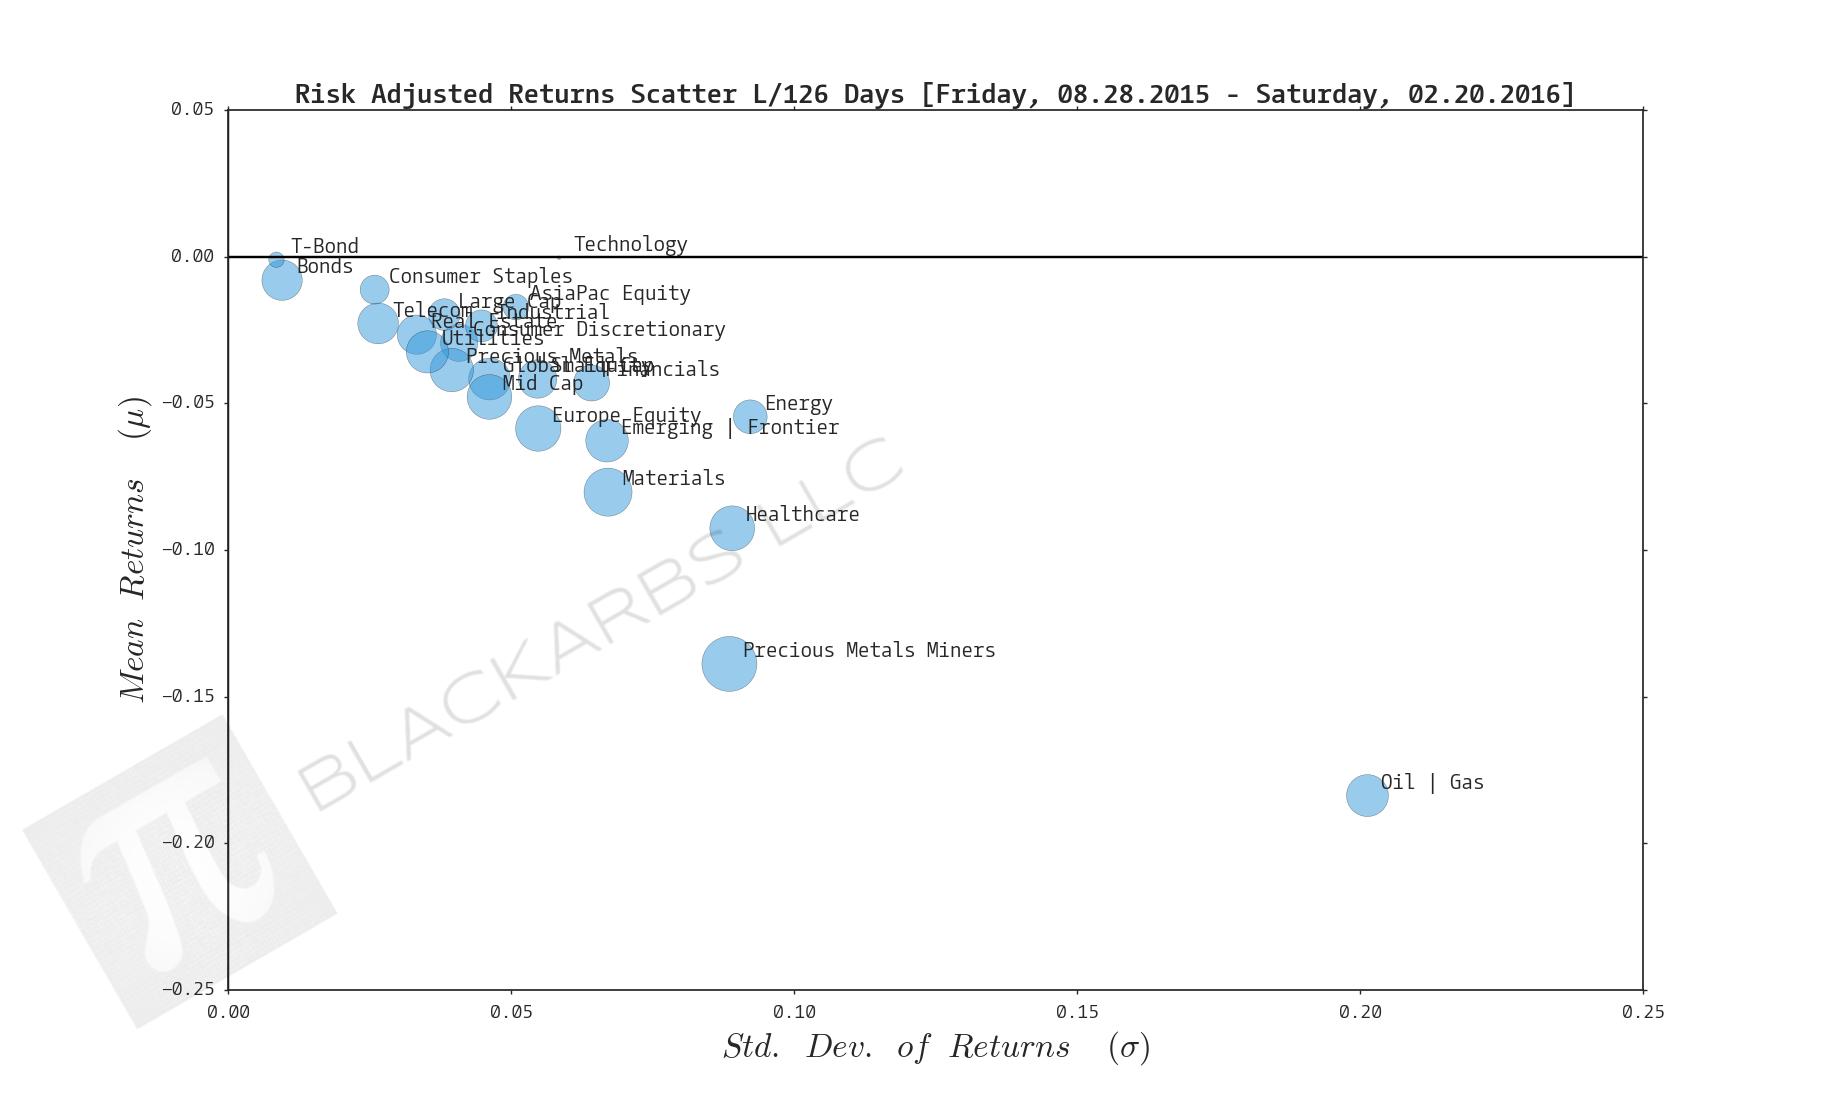
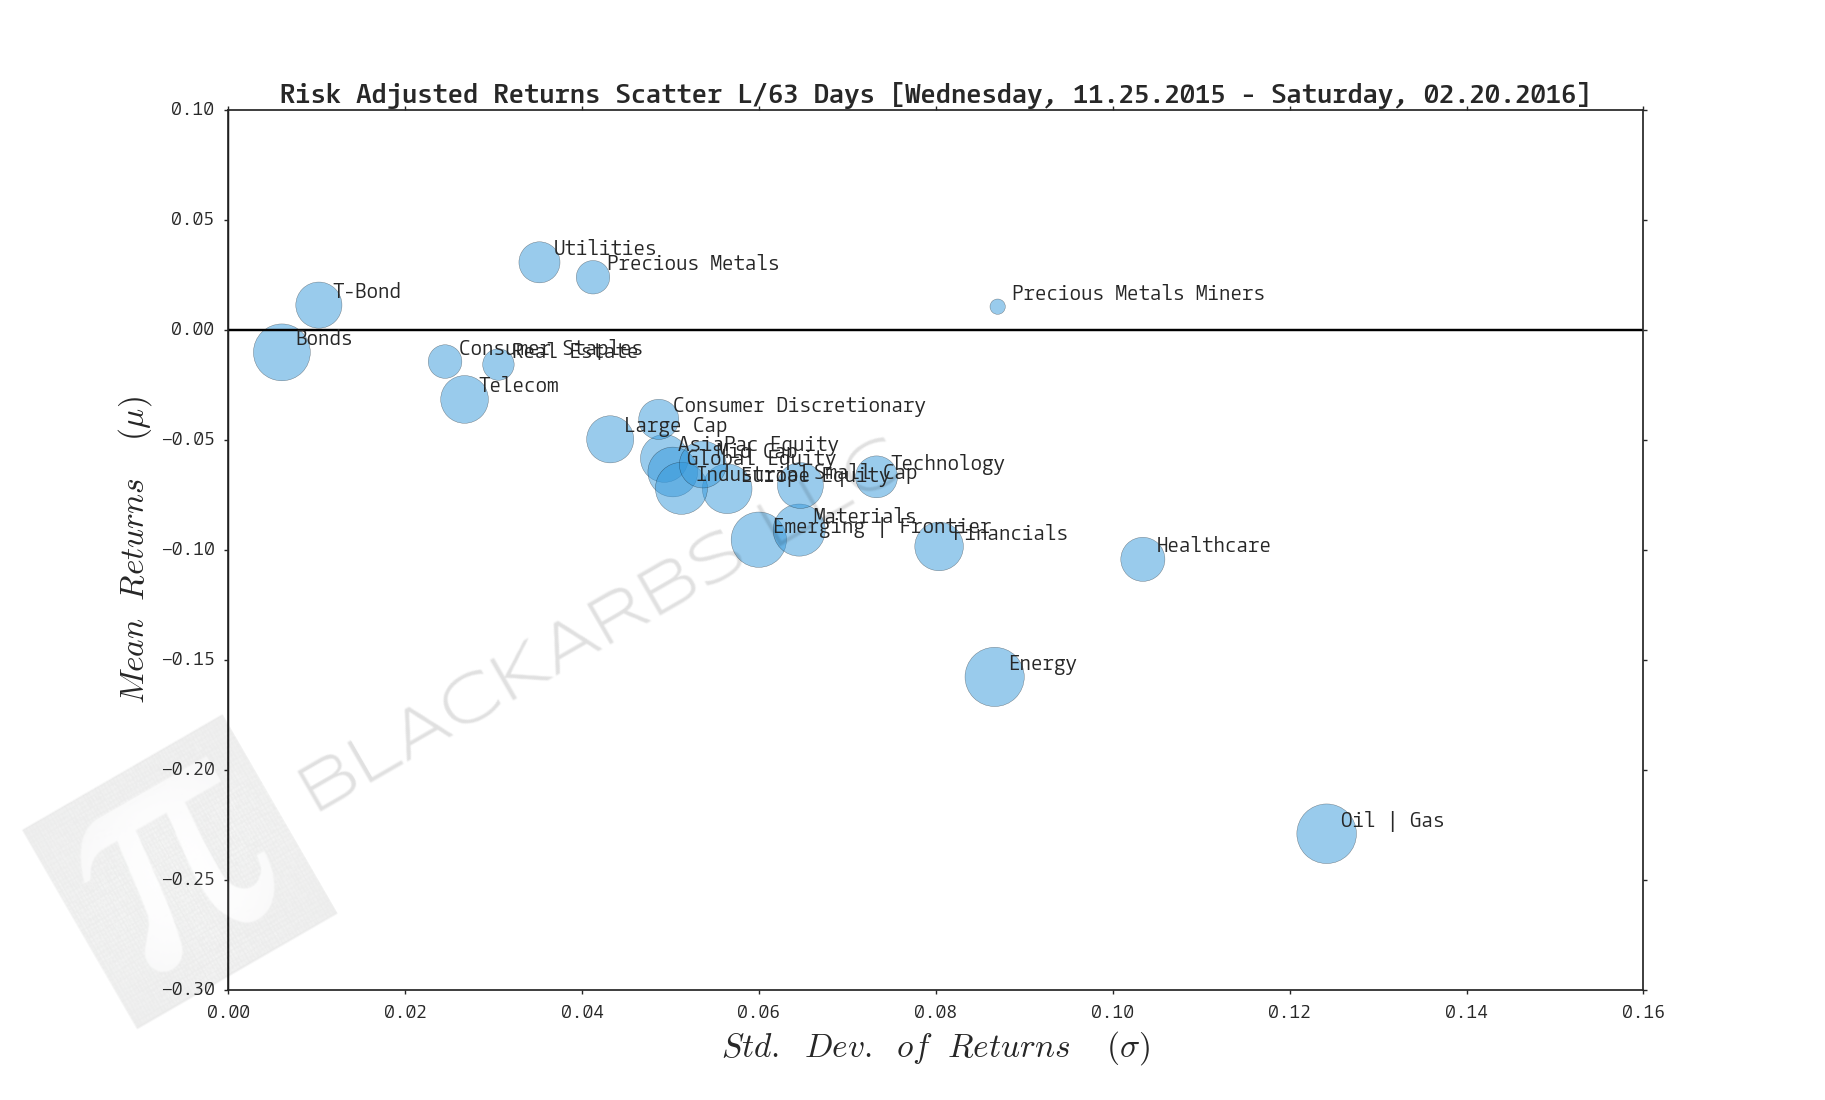
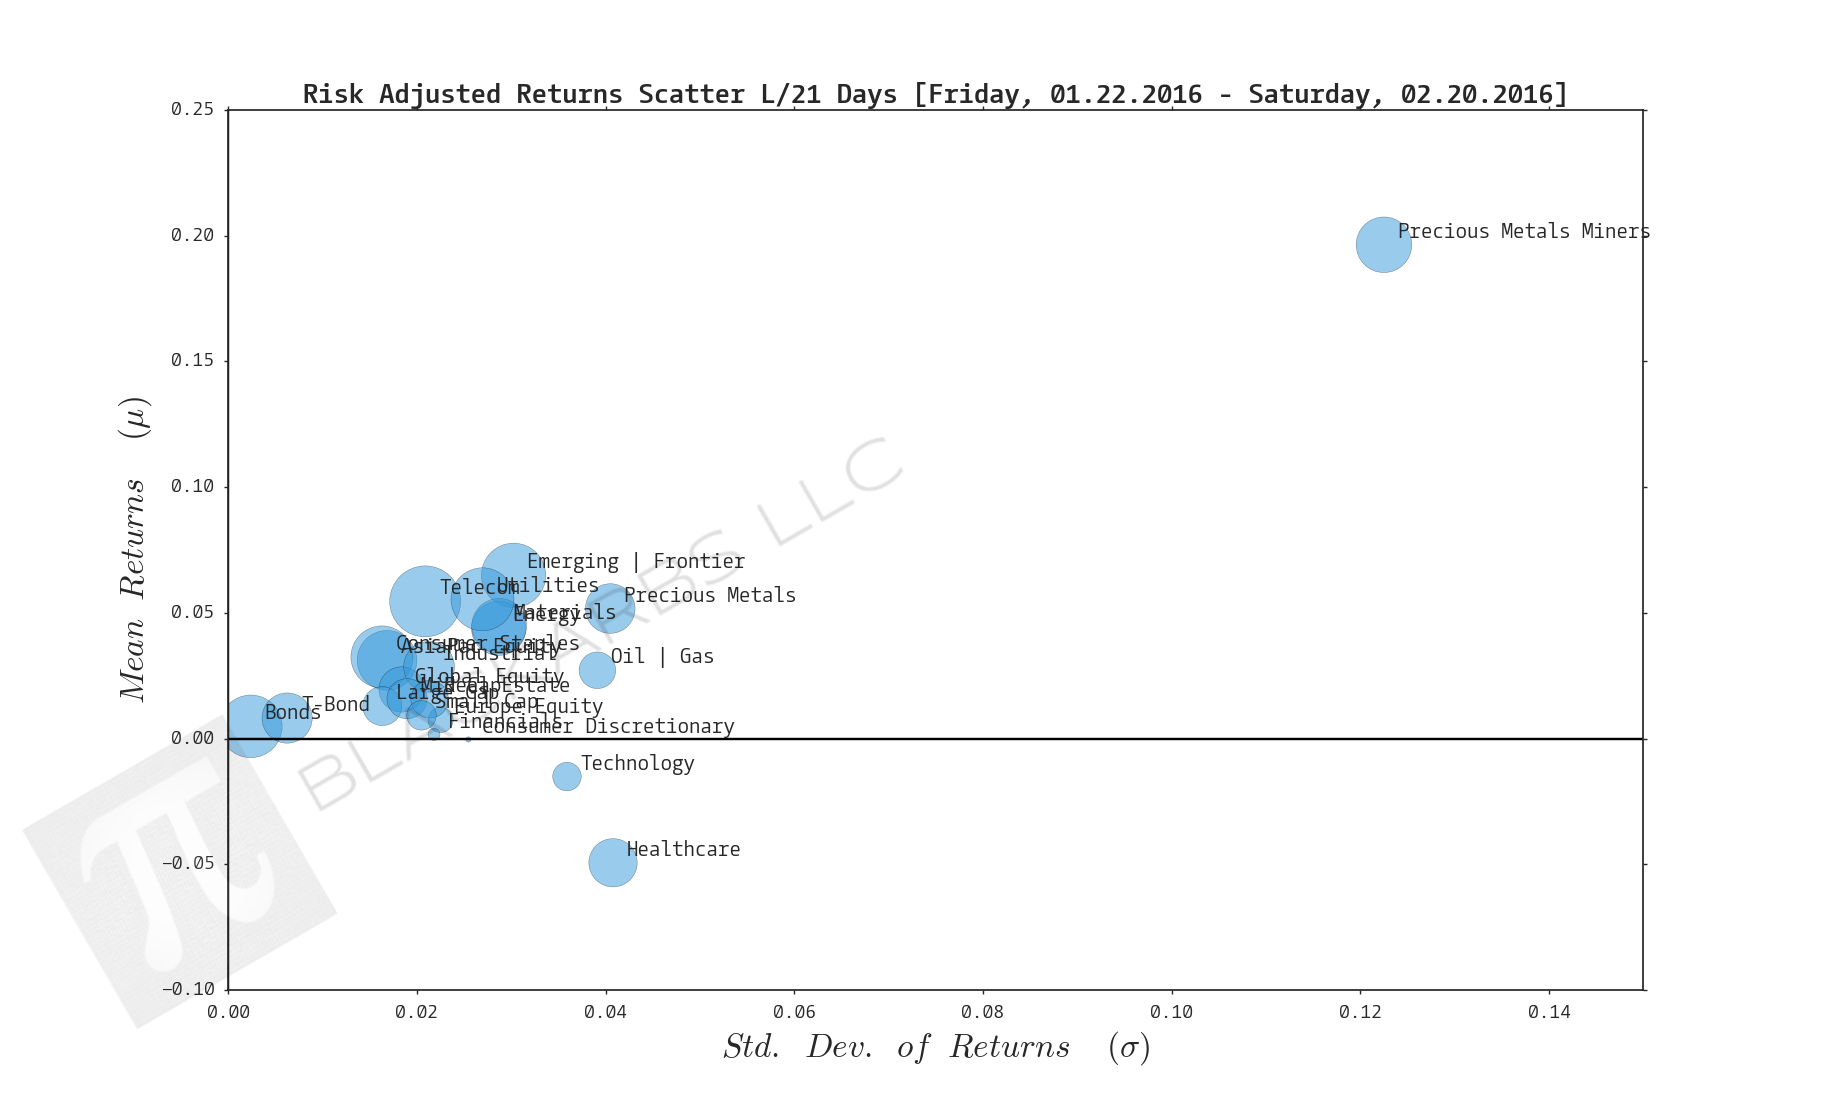
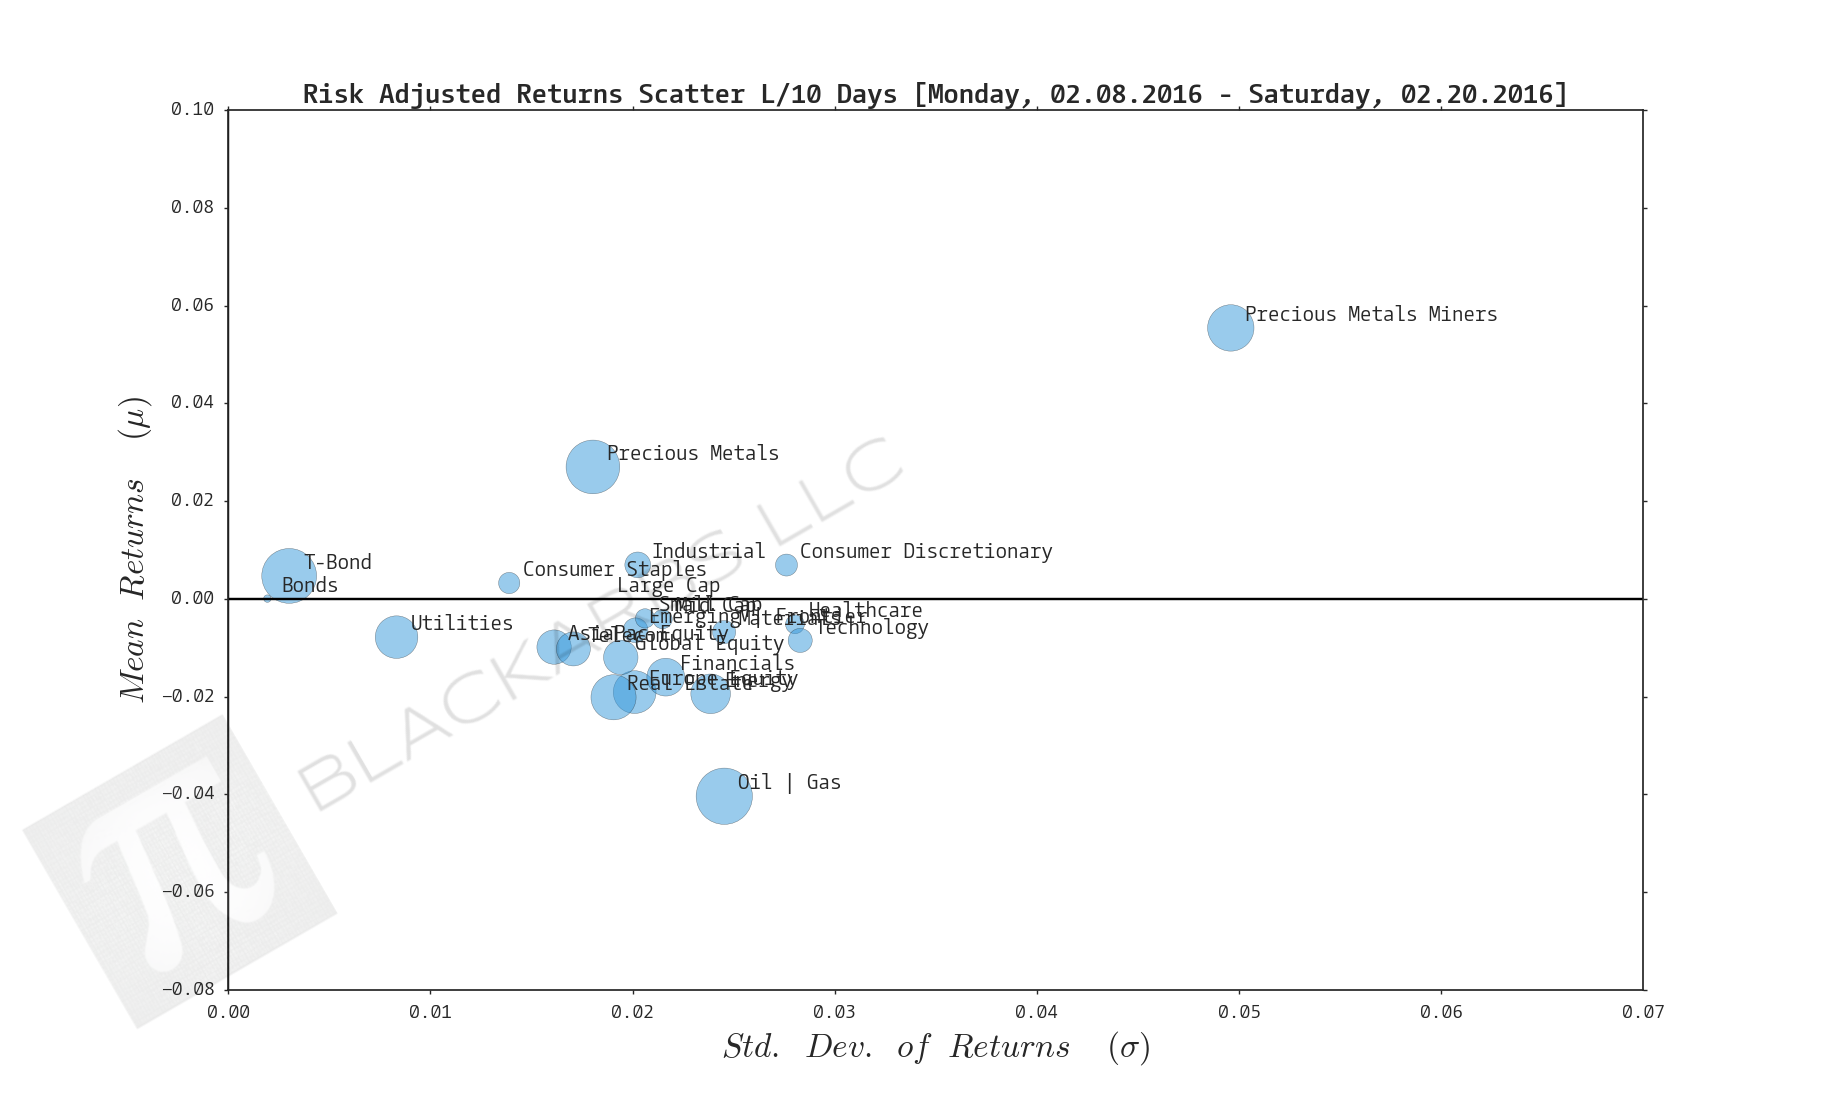
Composite ETF Risk-Adjusted Returns Scatter plot (Std vs Mean)
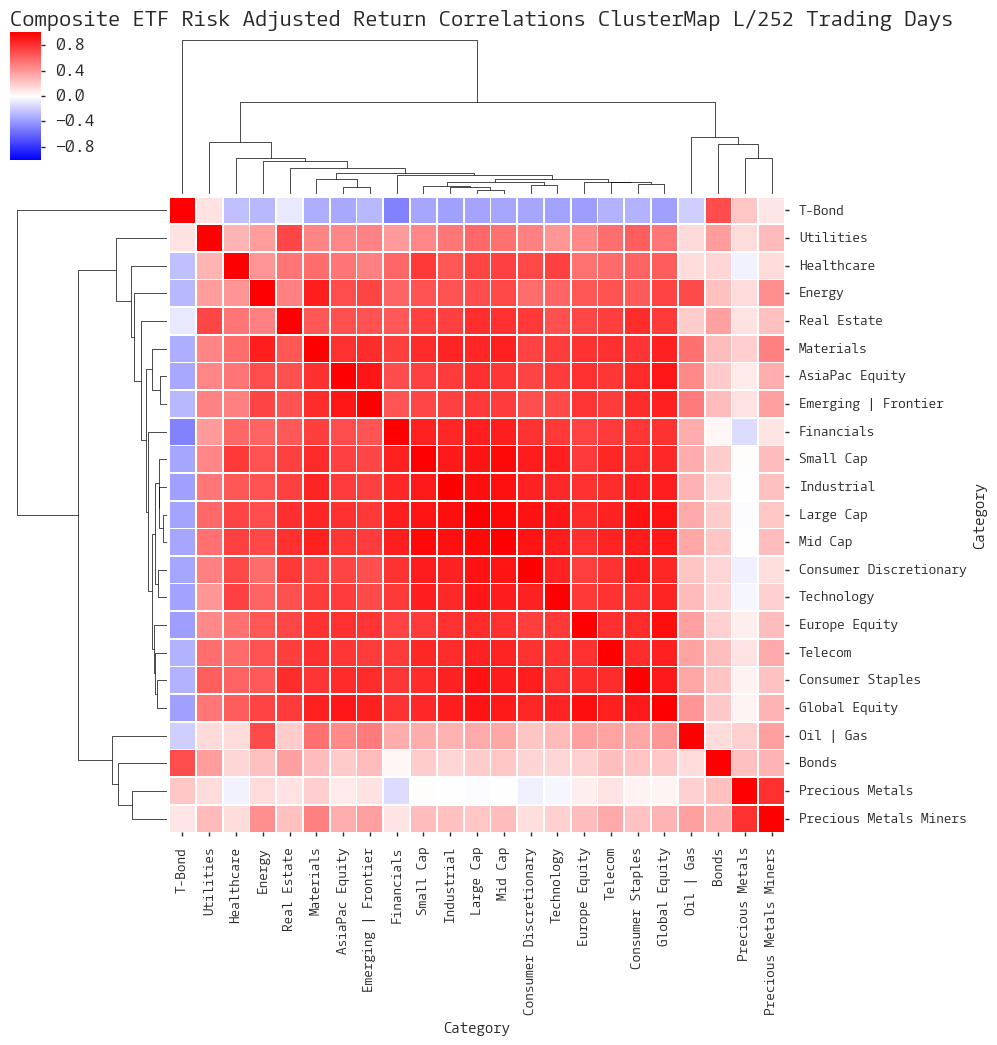
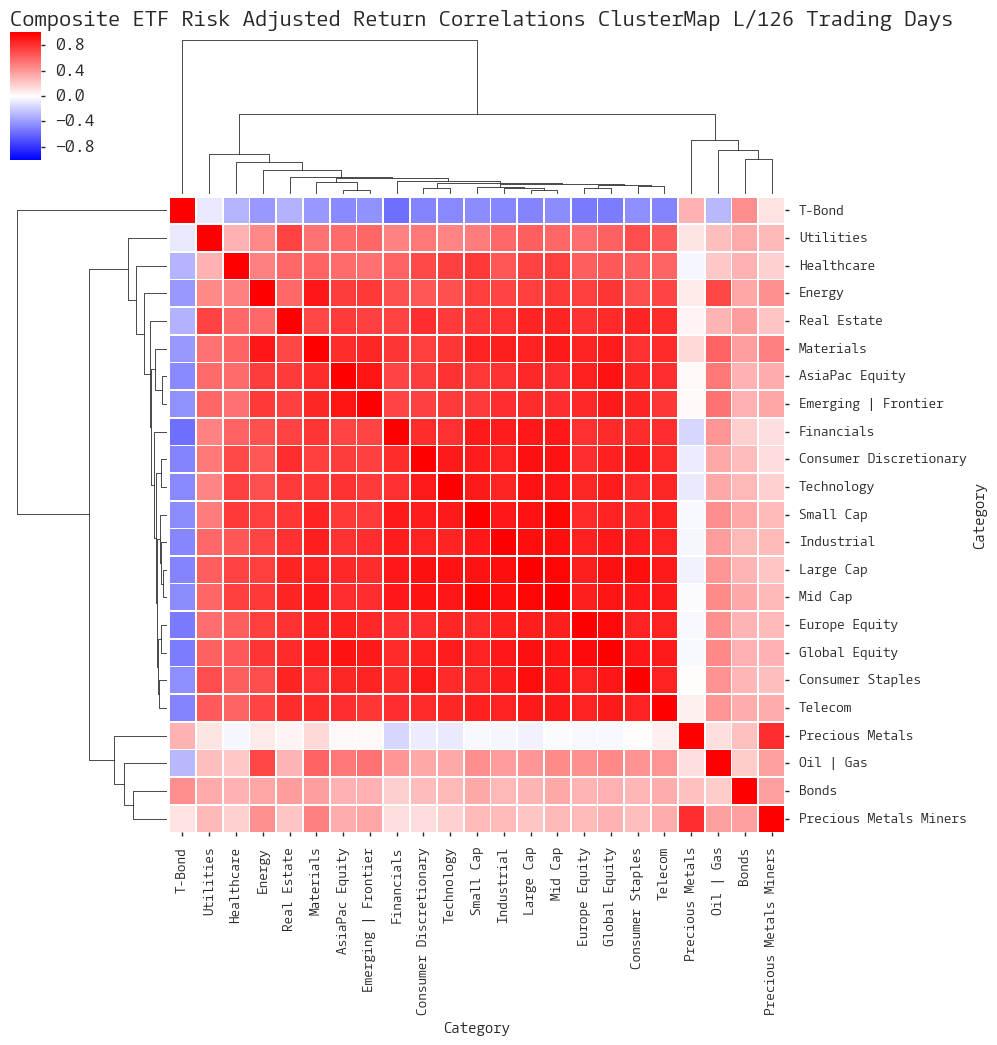
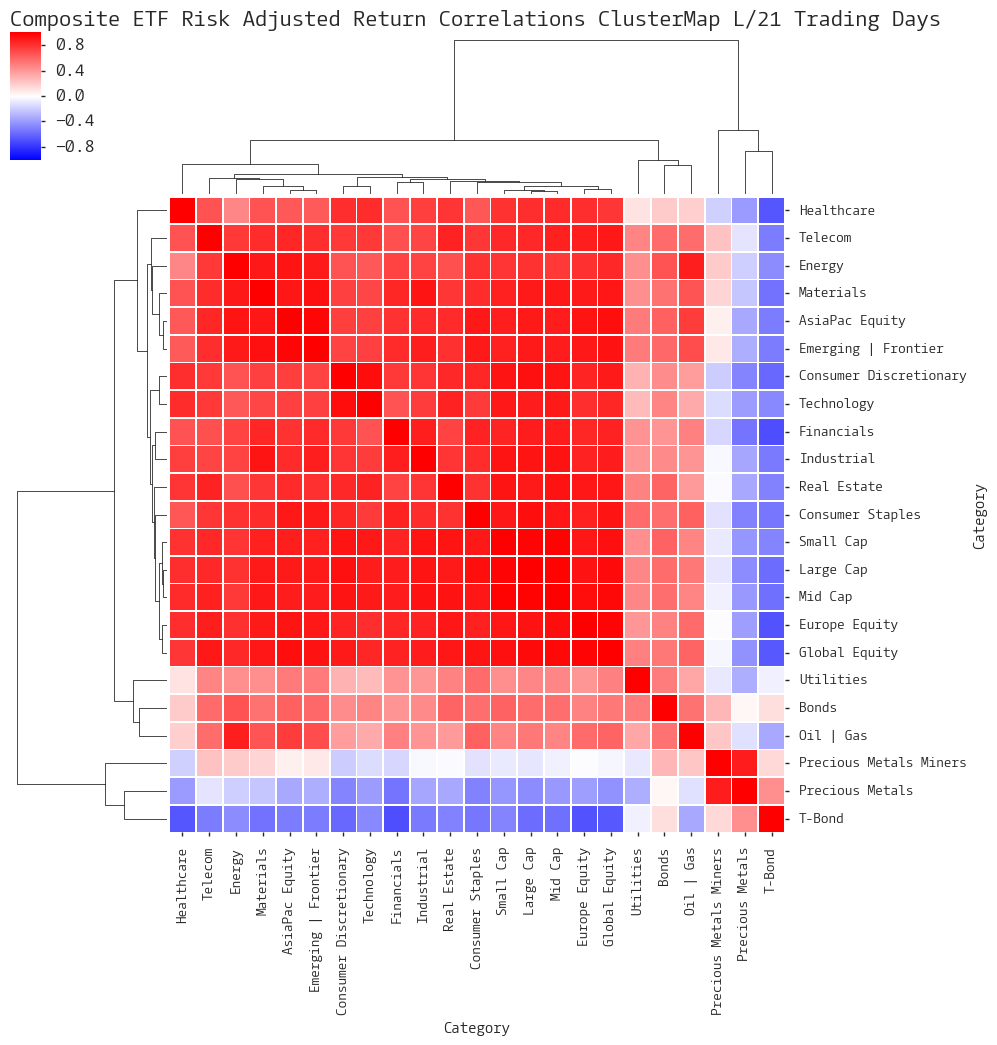
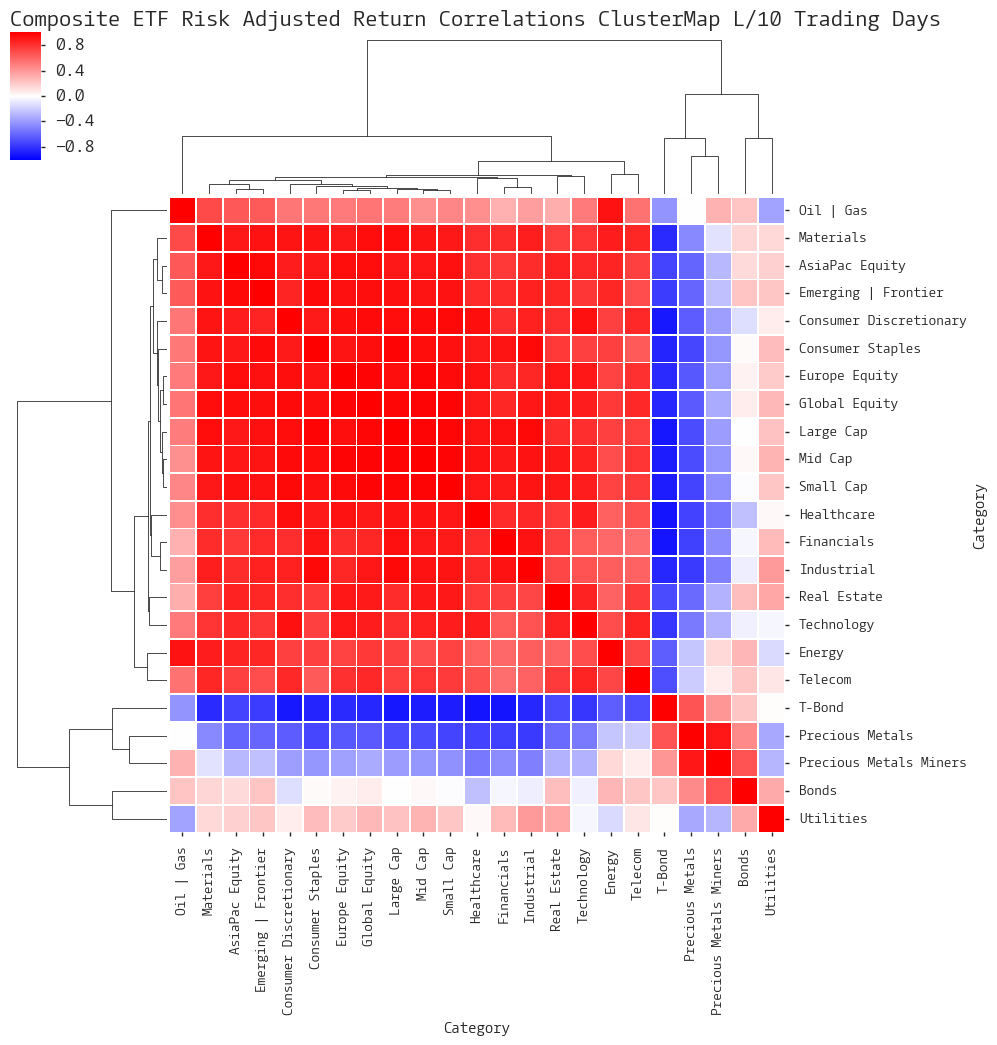
Composite ETF Risk-Adjusted Return Correlations Heatmap (Clusterplot)
Implied Cost of Capital Estimates
Composite ETF Cumulative Return Tables
Notable Trends and Observations
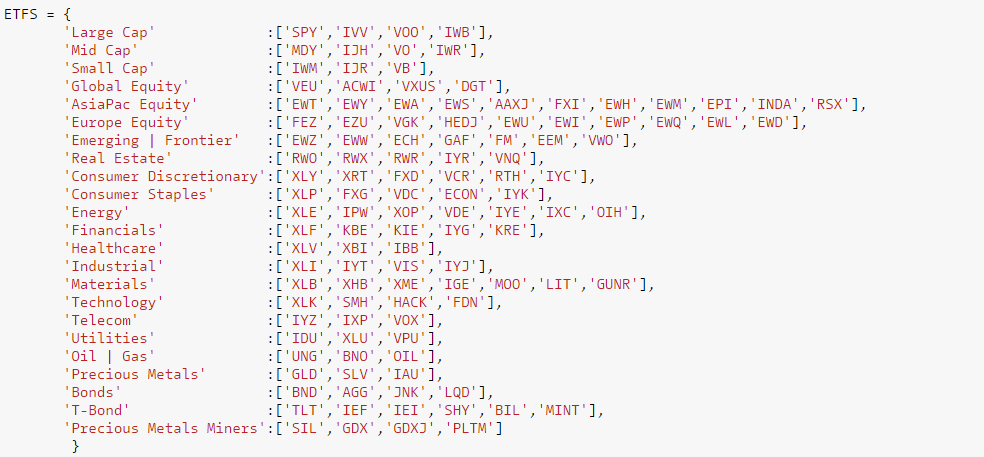
COMPOSITE ETF COMPONENTS:
LAST 252 TRADING DAYS

Click here for help understanding this chart
Click here for help understanding this chart
Click here for help understanding this chart
Click here for help understanding this chart
LAST 126 TRADING DAYS
Click here for help understanding this chart
Click here for help understanding this chart
Click here for help understanding this chart
Click here for help understanding this chart
LAST 63 TRADING DAYS
Click here for help understanding this chart
Click here for help understanding this chart
Click here for help understanding this chart
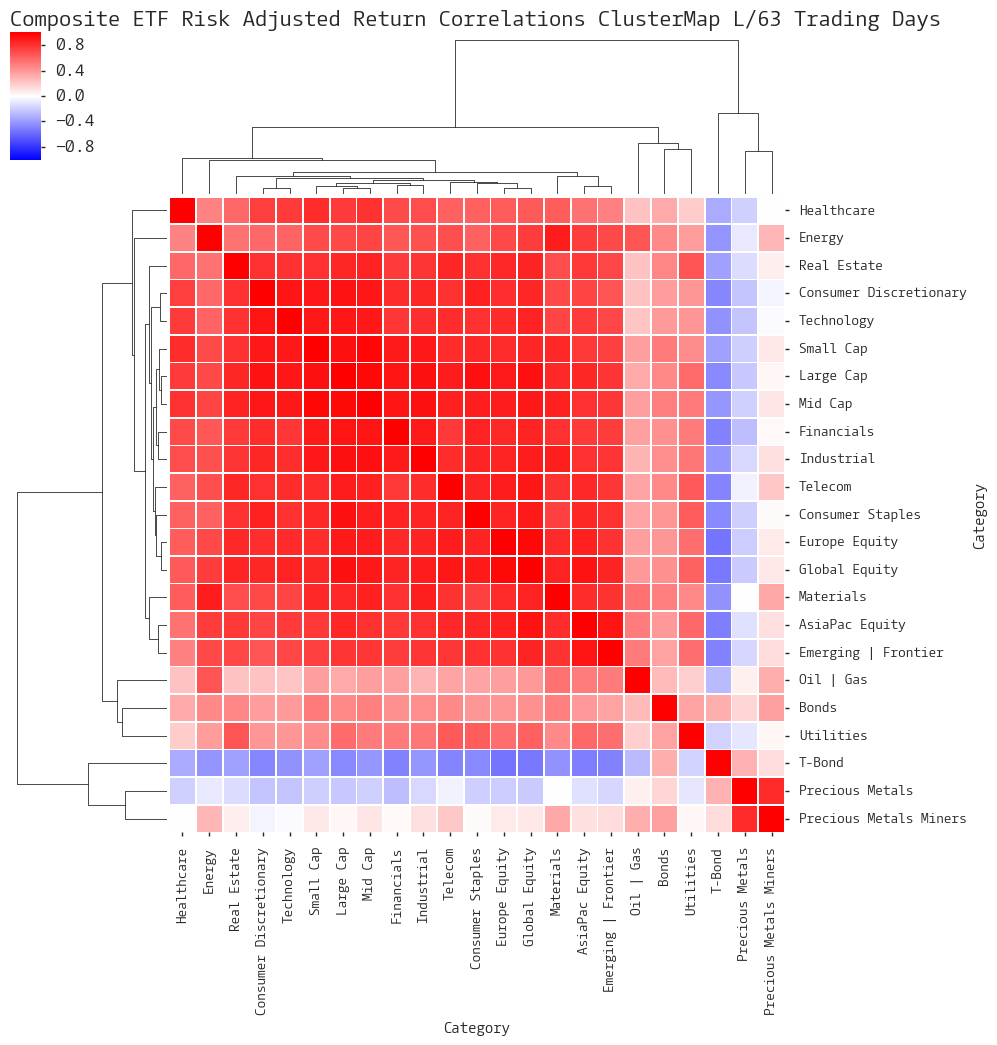
Click here for help understanding this chart
Year-to-date LAST 36 TRADING DAYS

Click here for help understanding this chart
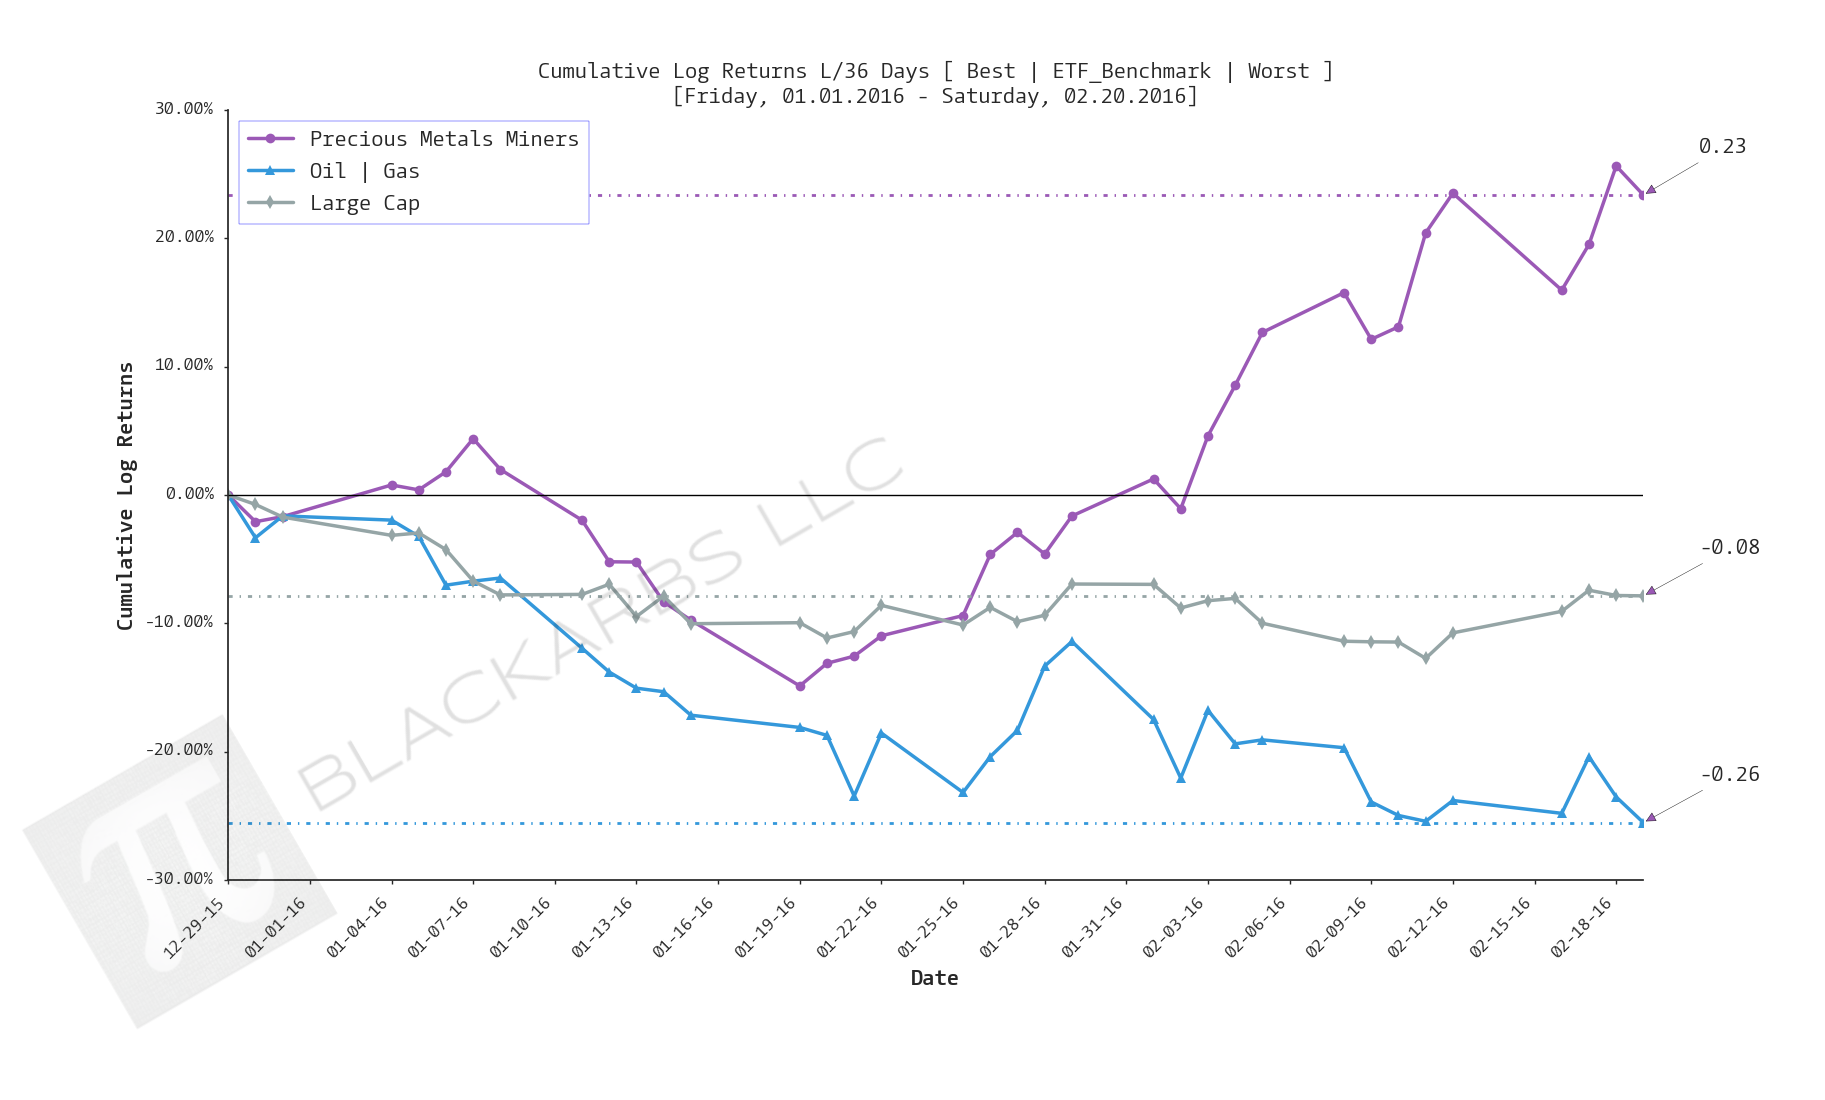
Click here for help understanding this chart
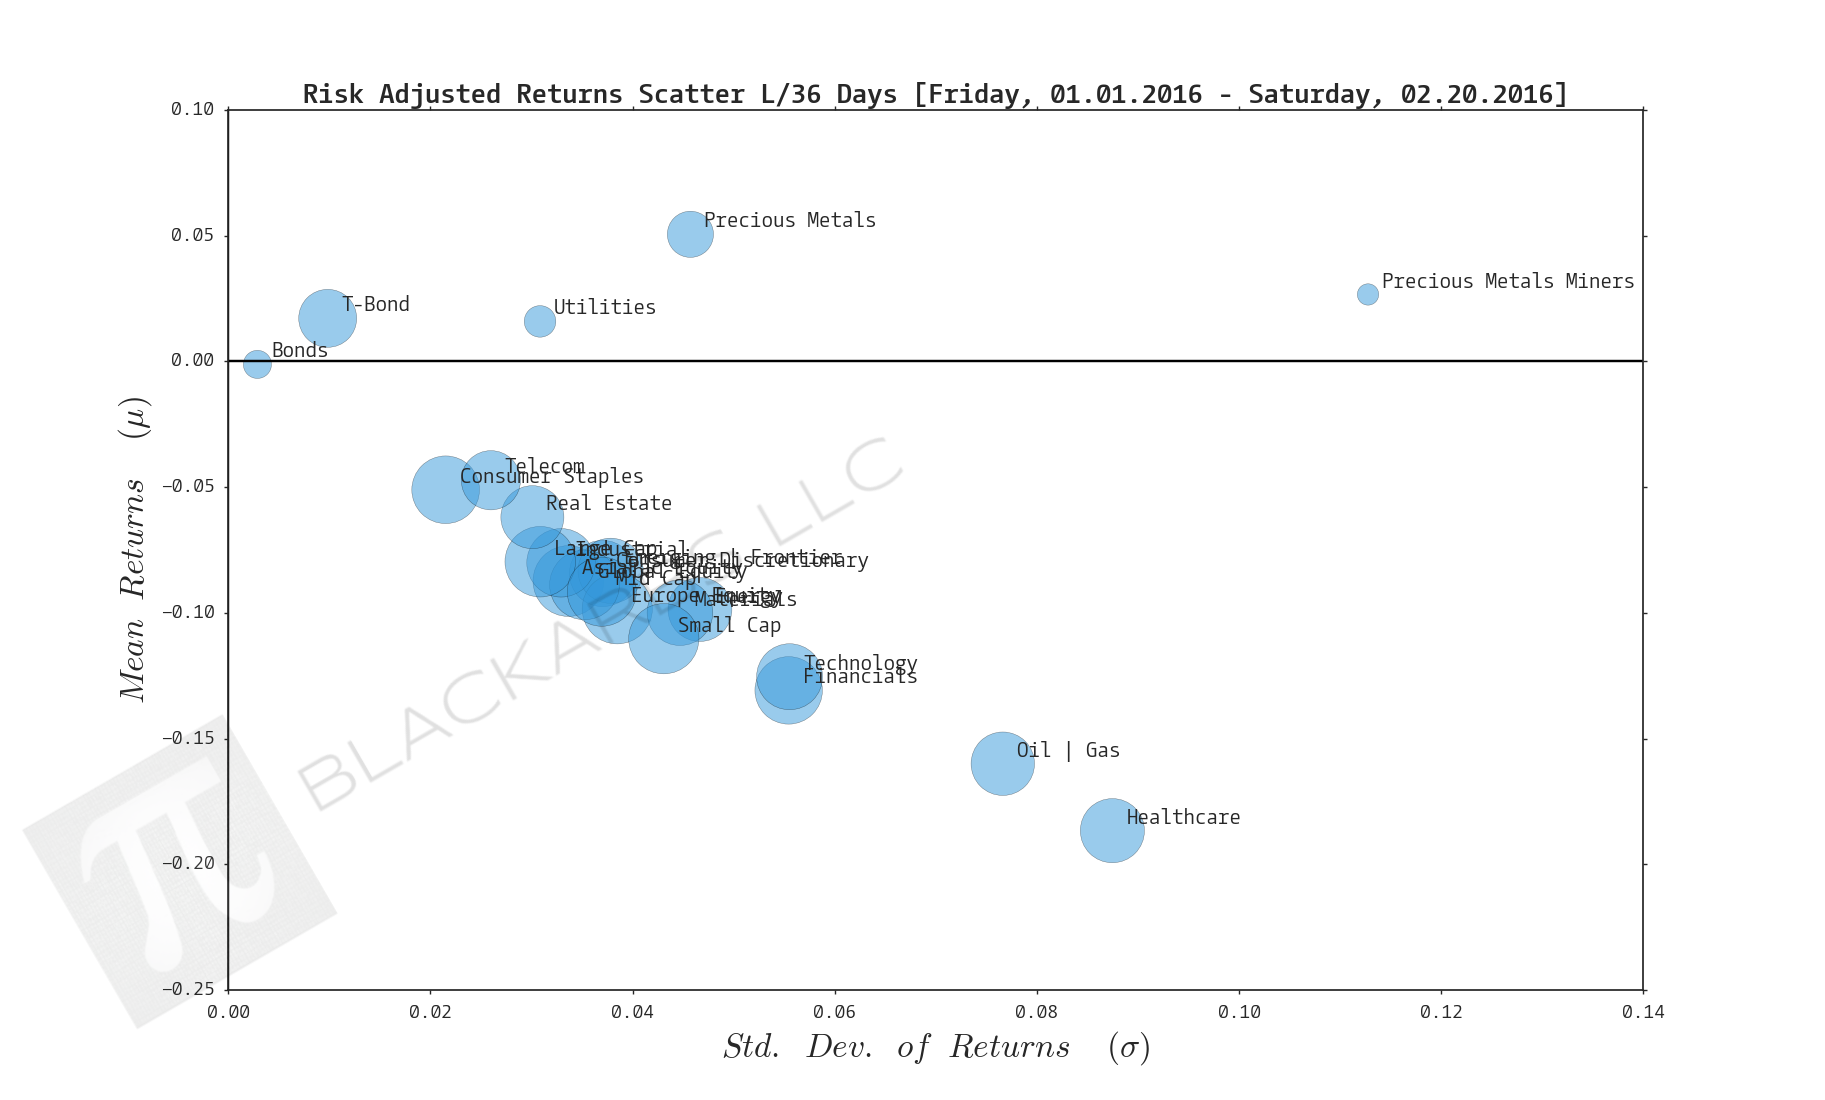
Click here for help understanding this chart
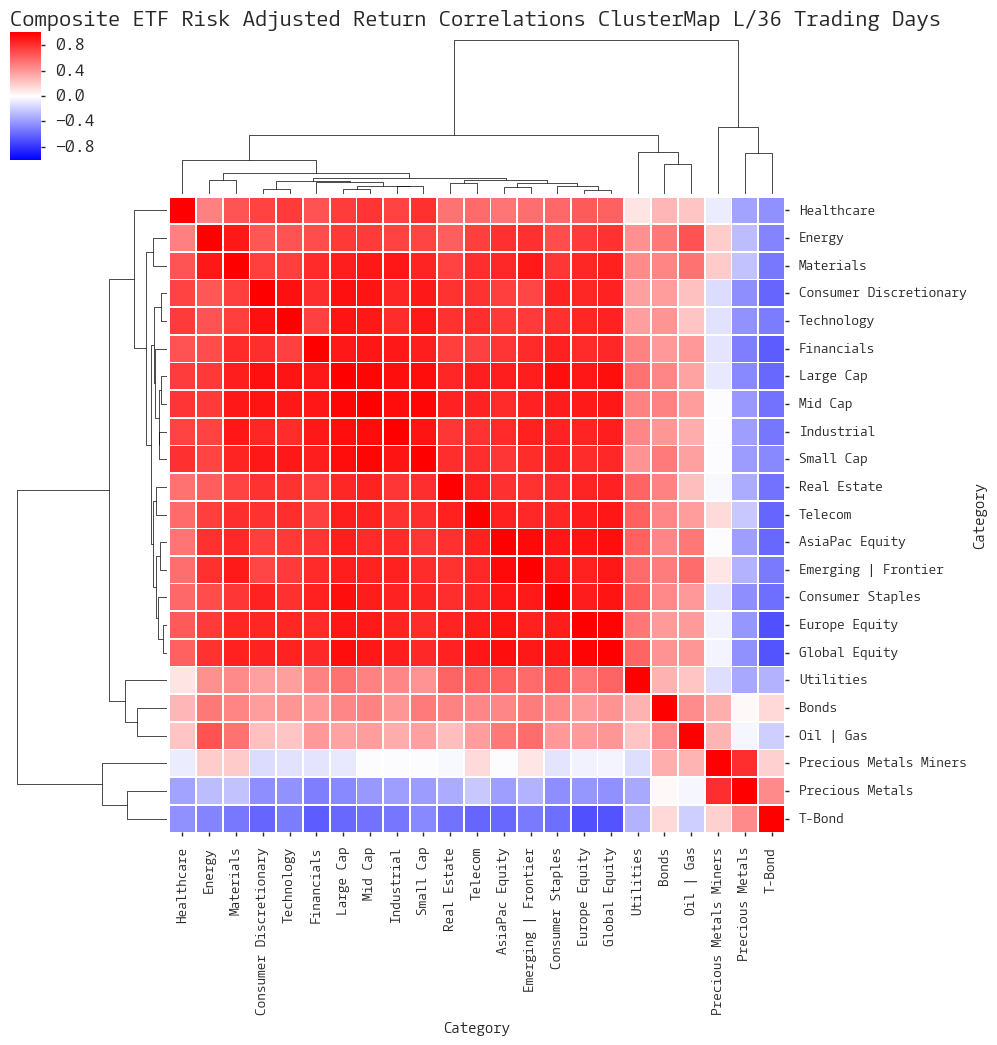
Click here for help understanding this chart
LAST 21 TRADING DAYS
Click here for help understanding this chart
Click here for help understanding this chart
Click here for help understanding this chart
Click here for help understanding this chart
LAST 10 TRADING DAYS
Click here for help understanding this chart
Click here for help understanding this chart
Click here for help understanding this chart
Click here for help understanding this chart
Implied Cost of Capital Estimates:
To learn more about the Implied Cost of Capital see here.
CATEGORY AVERAGE ICC ESTIMATES
ALL ETF ICC ESTIMATES BY CATEGORY
Cumulative Return Tables:
Notable Observations and Trends:
- Unfortunately not much has changed this week. Many of the themes I identified last week appear to be ongoing.
- Defensive positioning is still prevalent as Precious Metals Miners and Precious Metals have continued to outperform.
- The relative strength of the Emerging/Frontier and Consumer Discretionary composites over the last 21 and 10 days respectively is somewhat interesting. This gives the appearance of "Risk-On" but the other evidence implies investors should tread carefully.
- My current working theory is that T-Bonds provide a safe yield for global investors given the increasing popularity of NIRP. The corollary to that thesis is that the Precious Metals complex acts like a put on runaway Central Bank policy. It is likely that Precious Metals will continue to show relative strength until NIRP is removed from the Federal Reserve's policy discussion.