PythonGlobal Markets
COMPOSITE MACRO ETF WEEKLY ANALYTICS (5/14/2016)
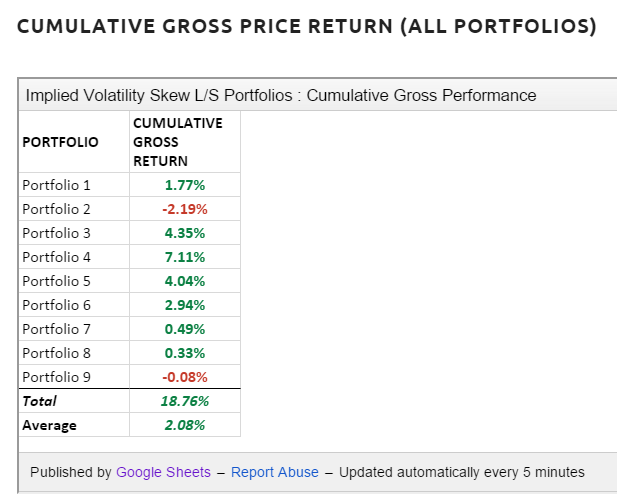
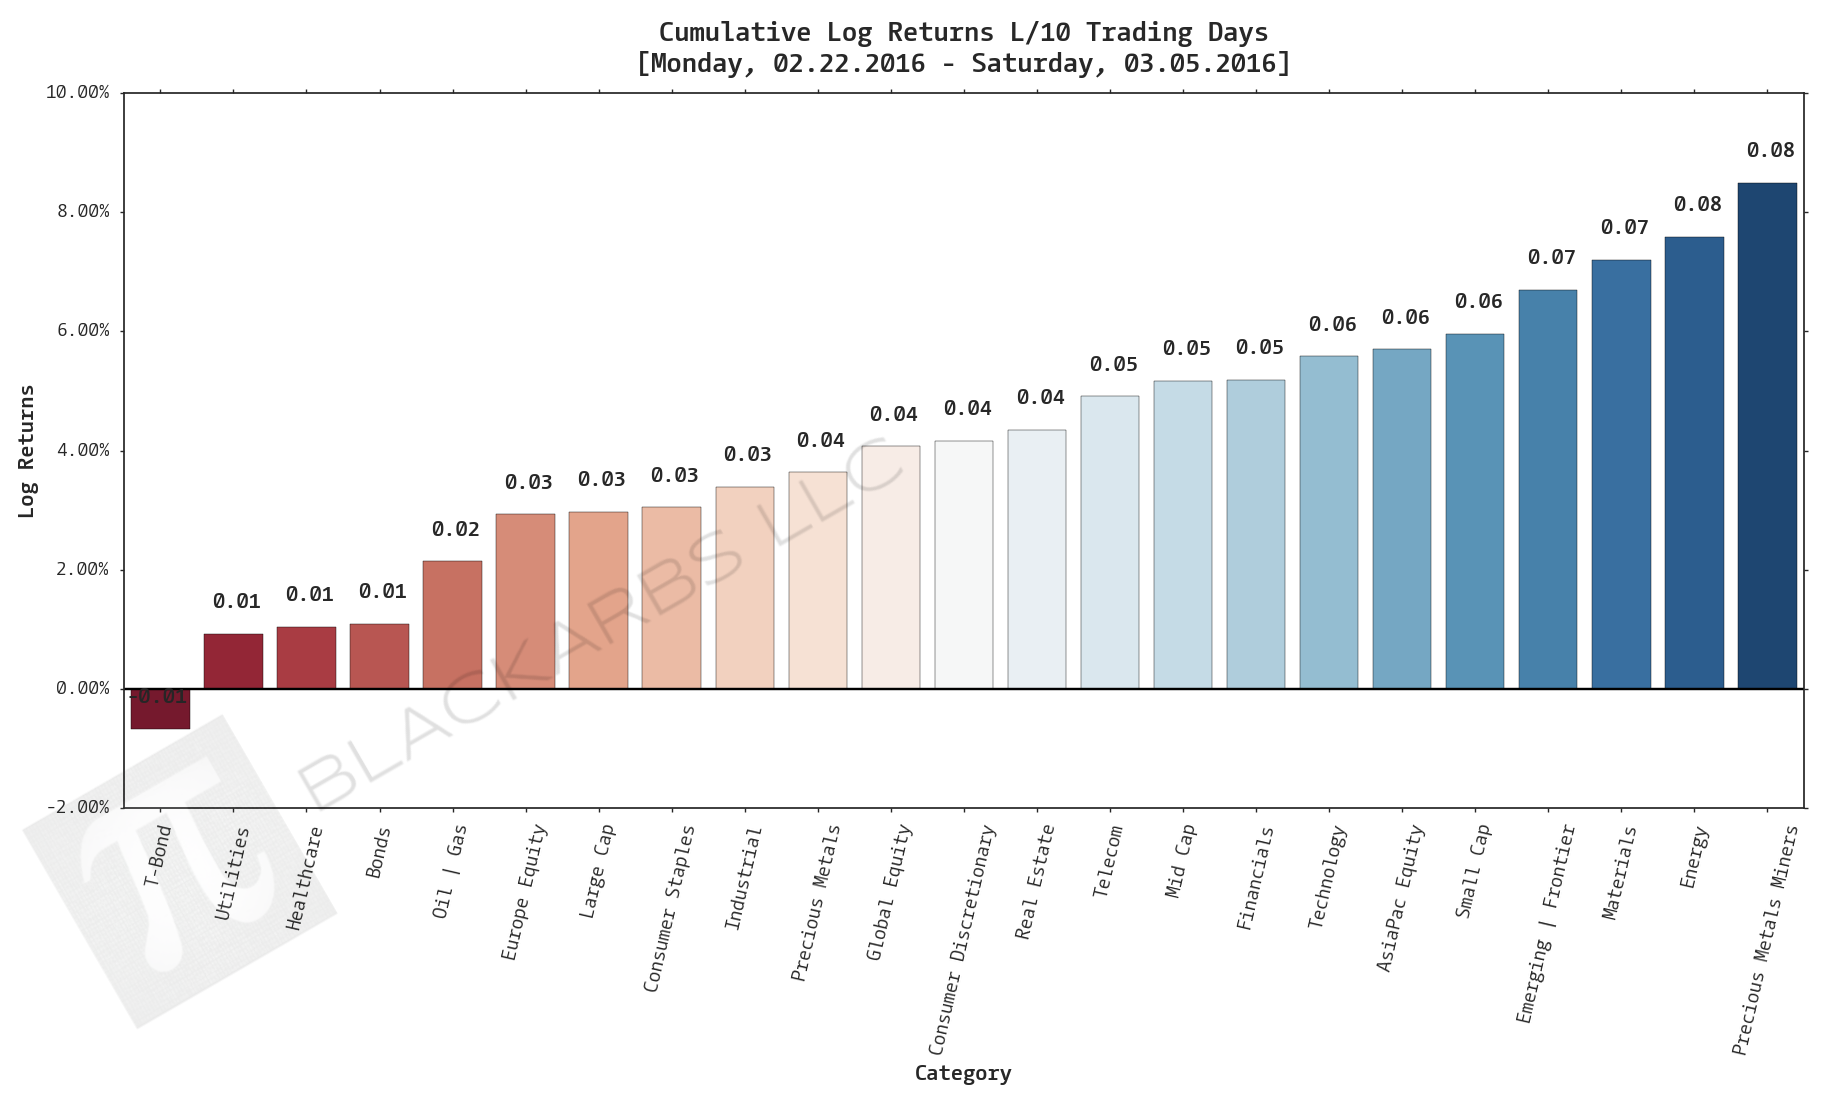
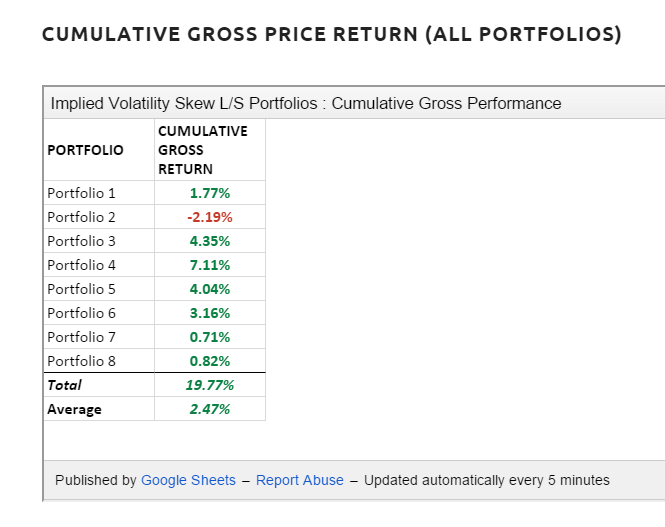
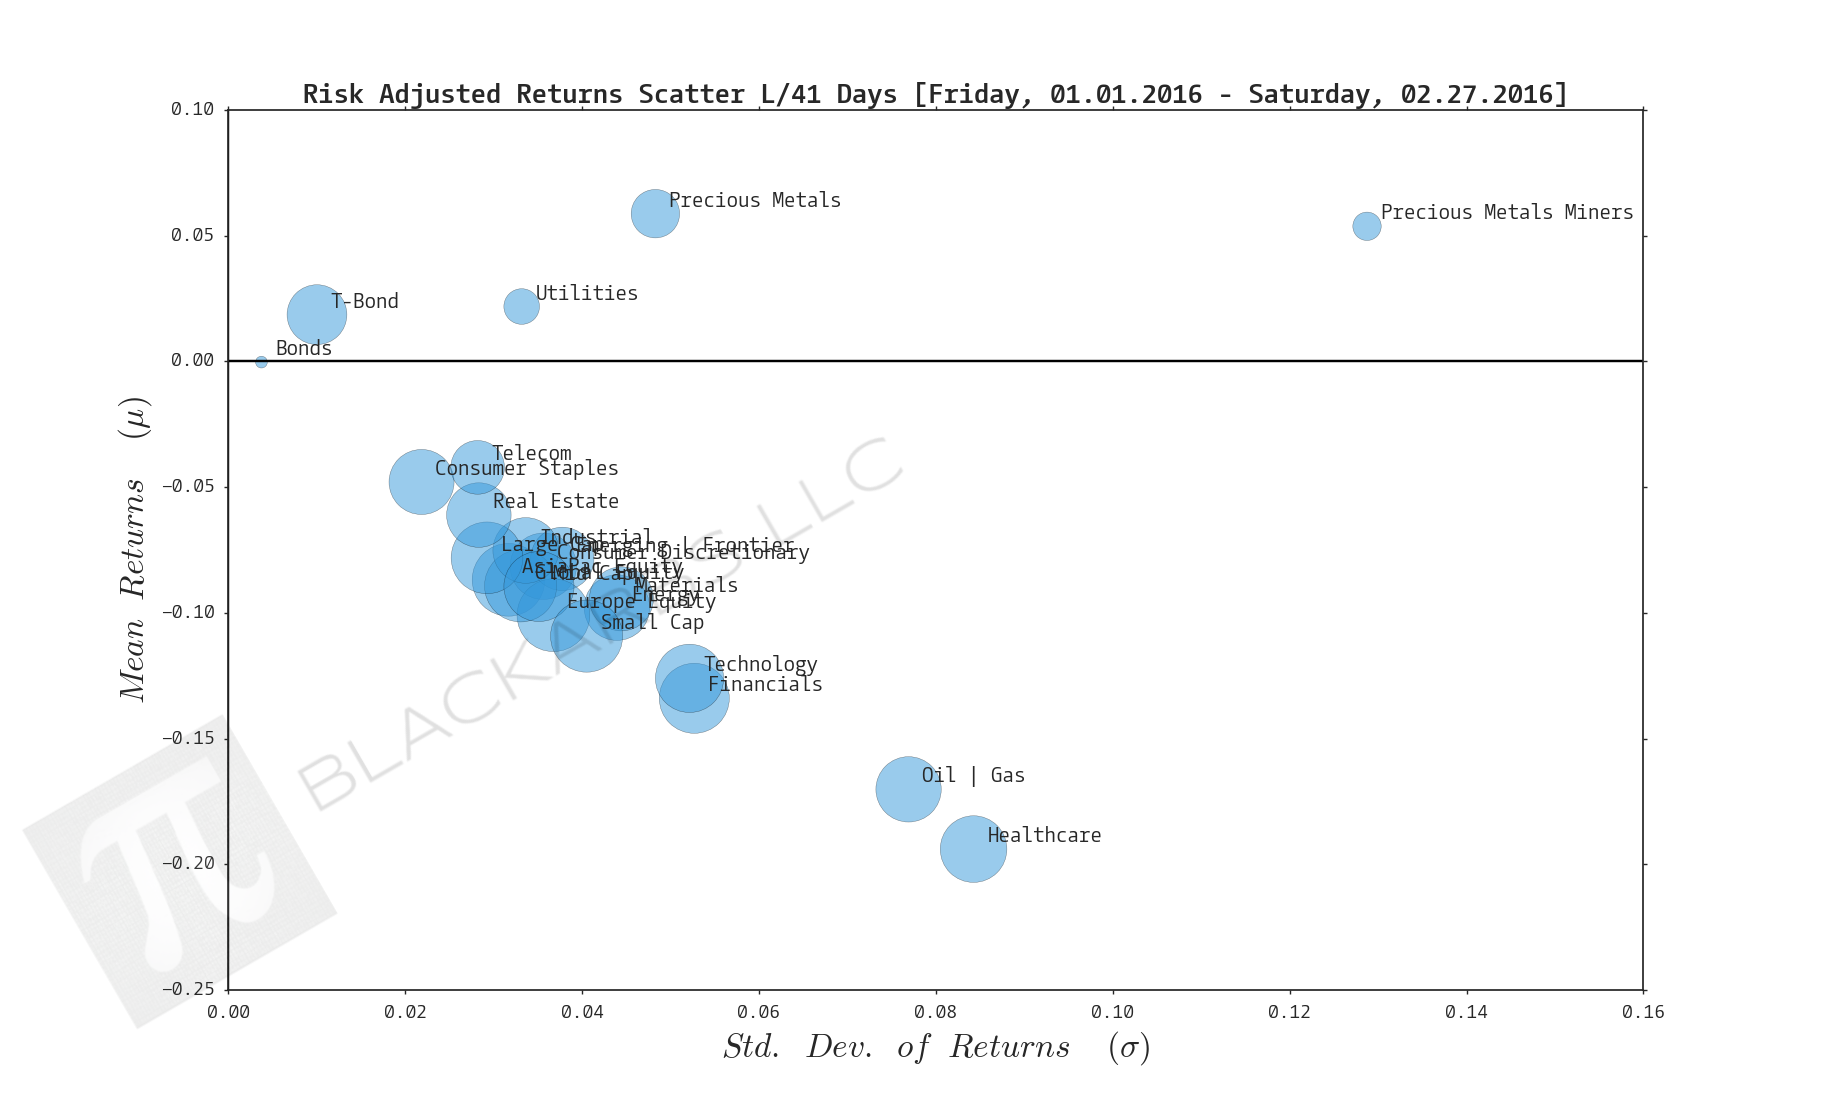
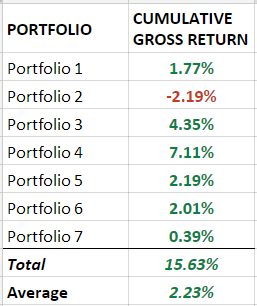
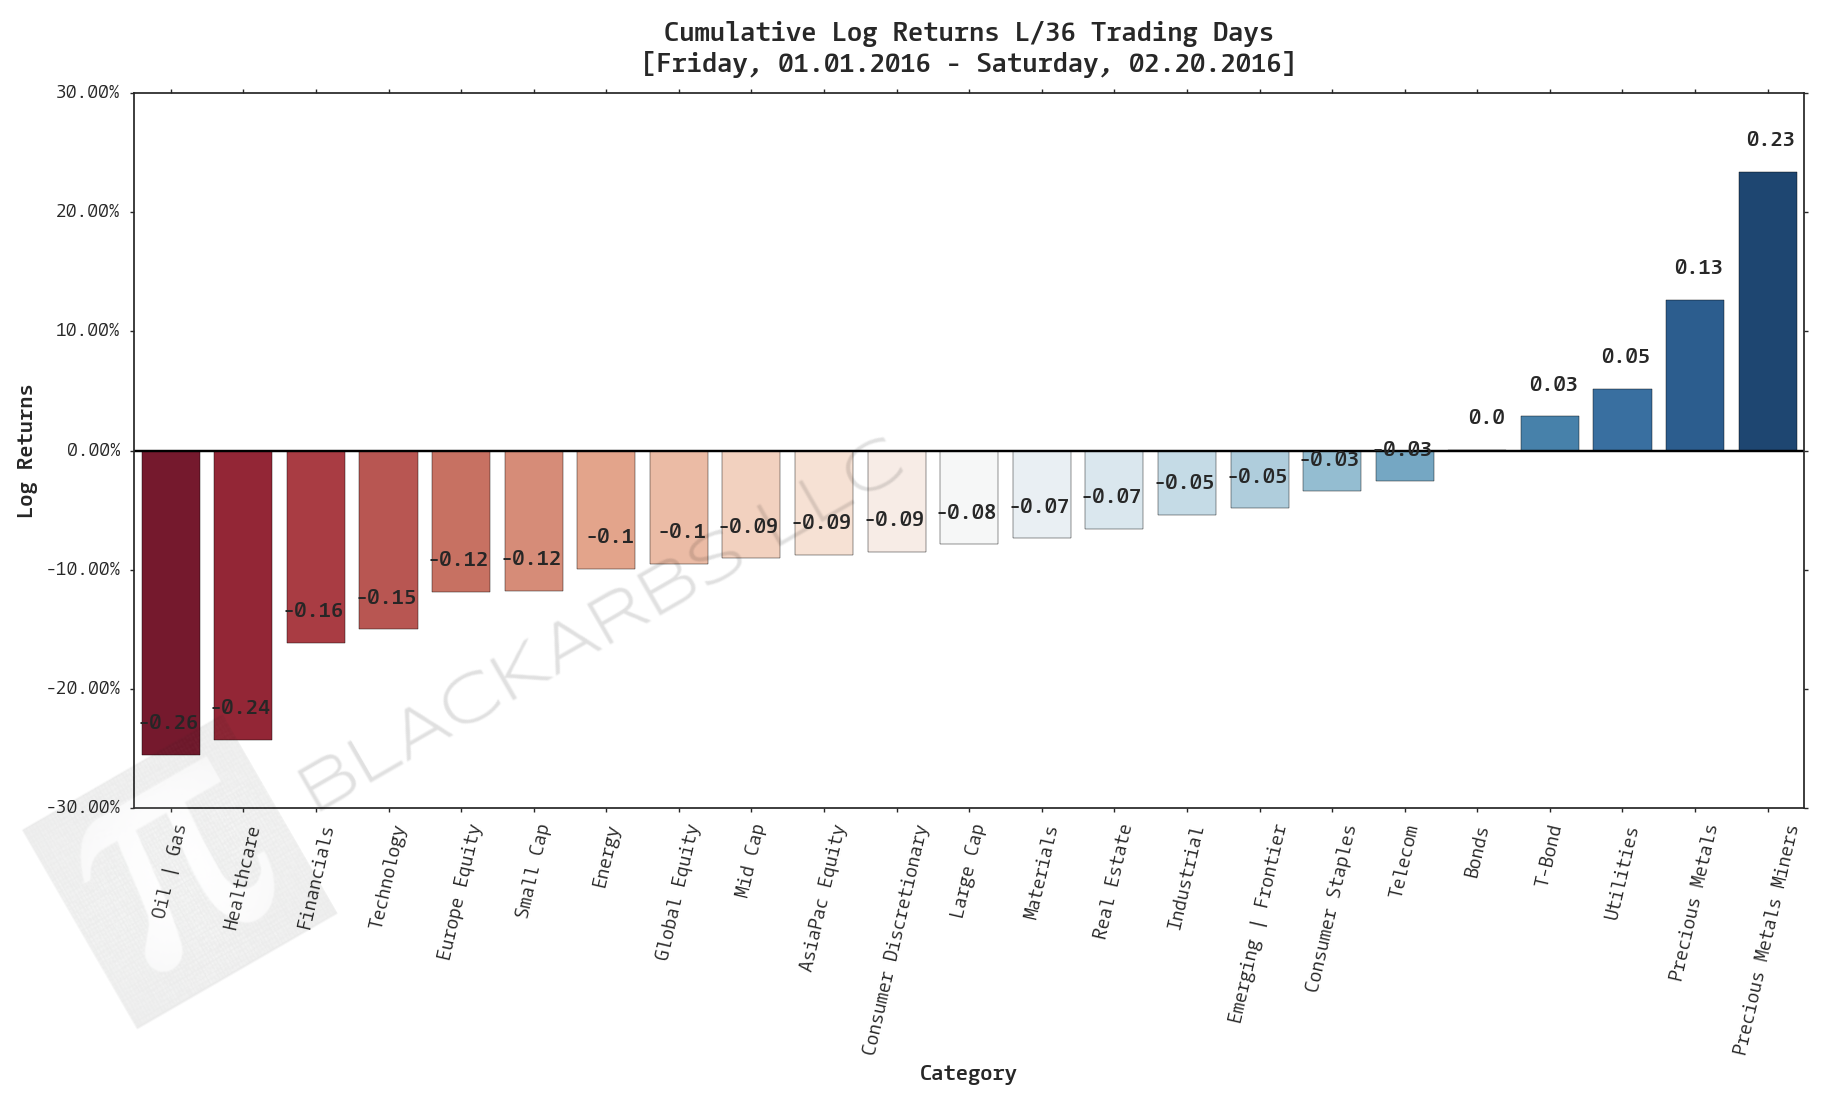
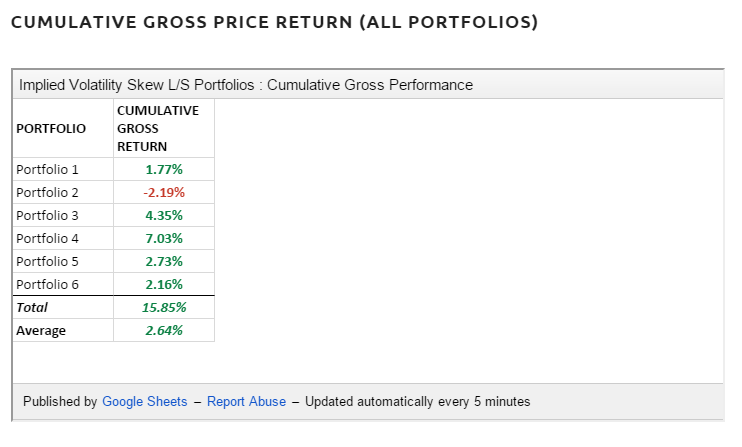
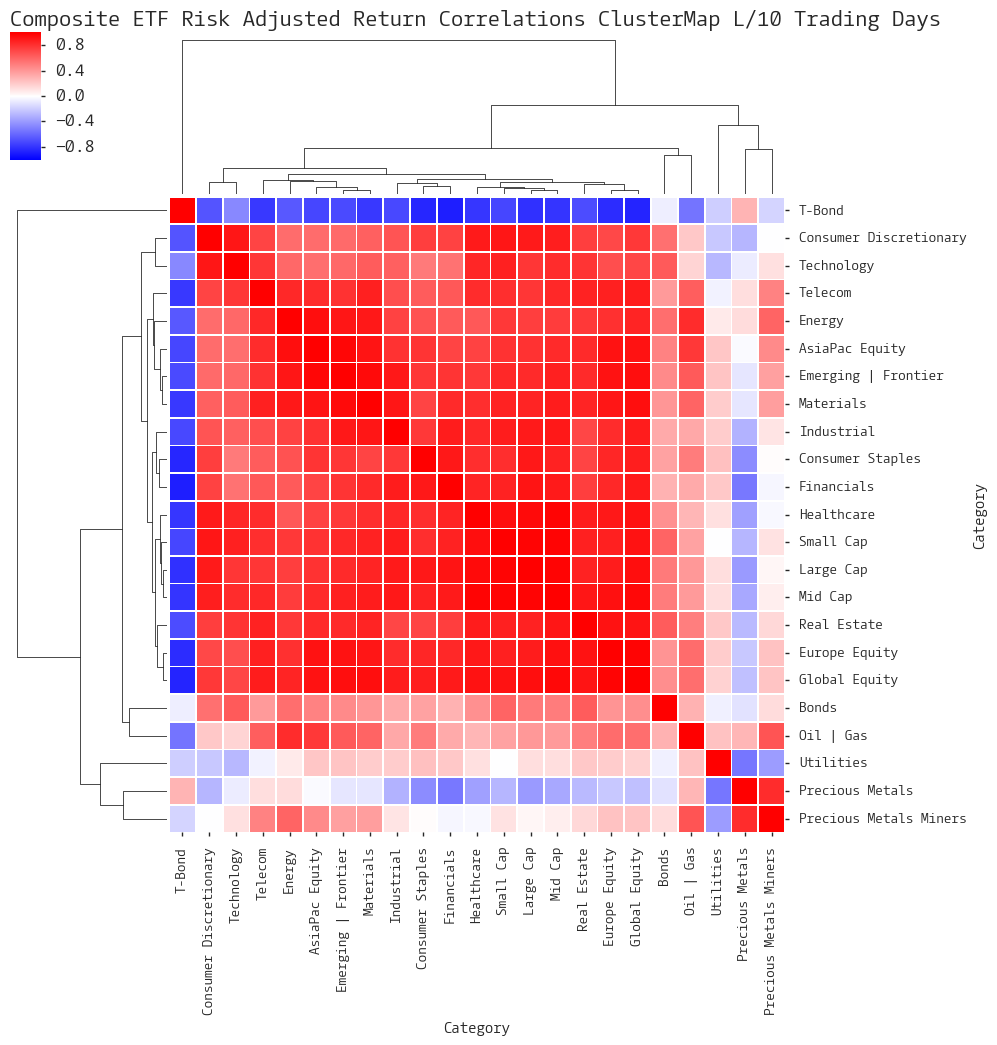
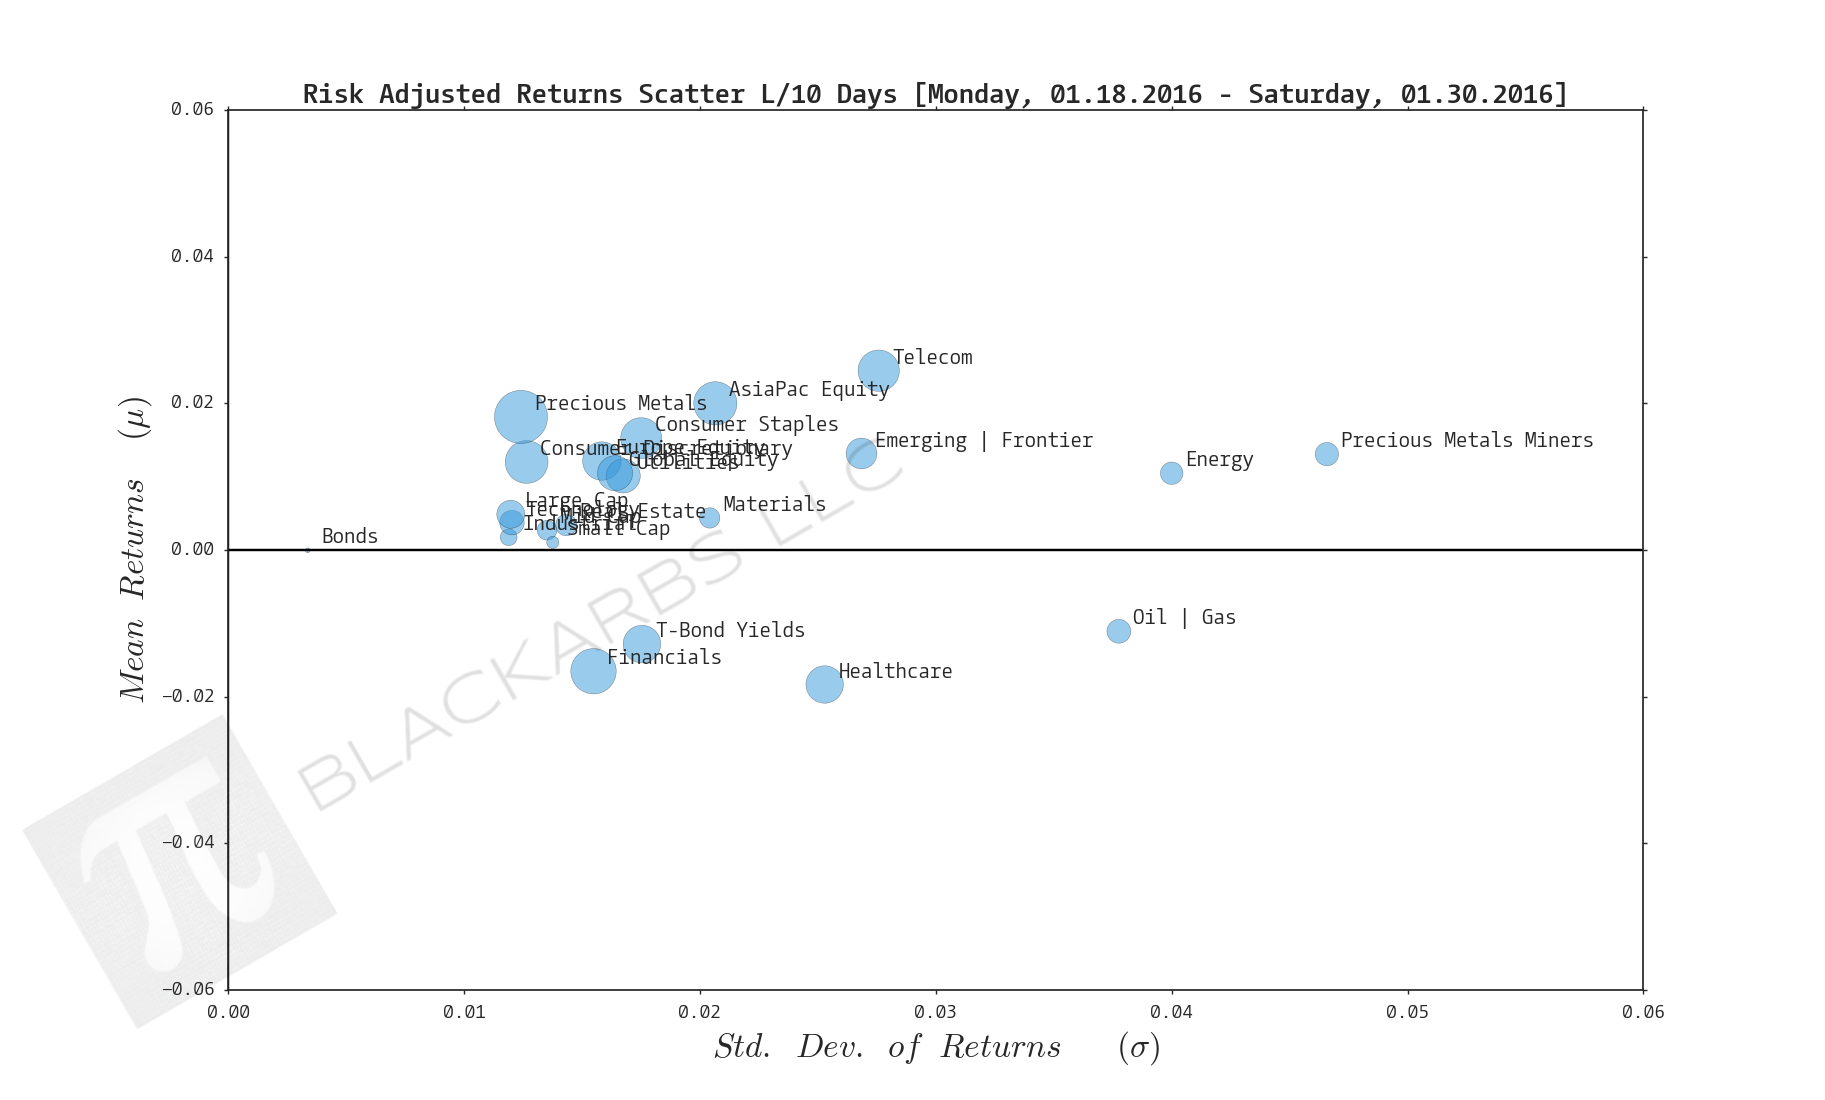
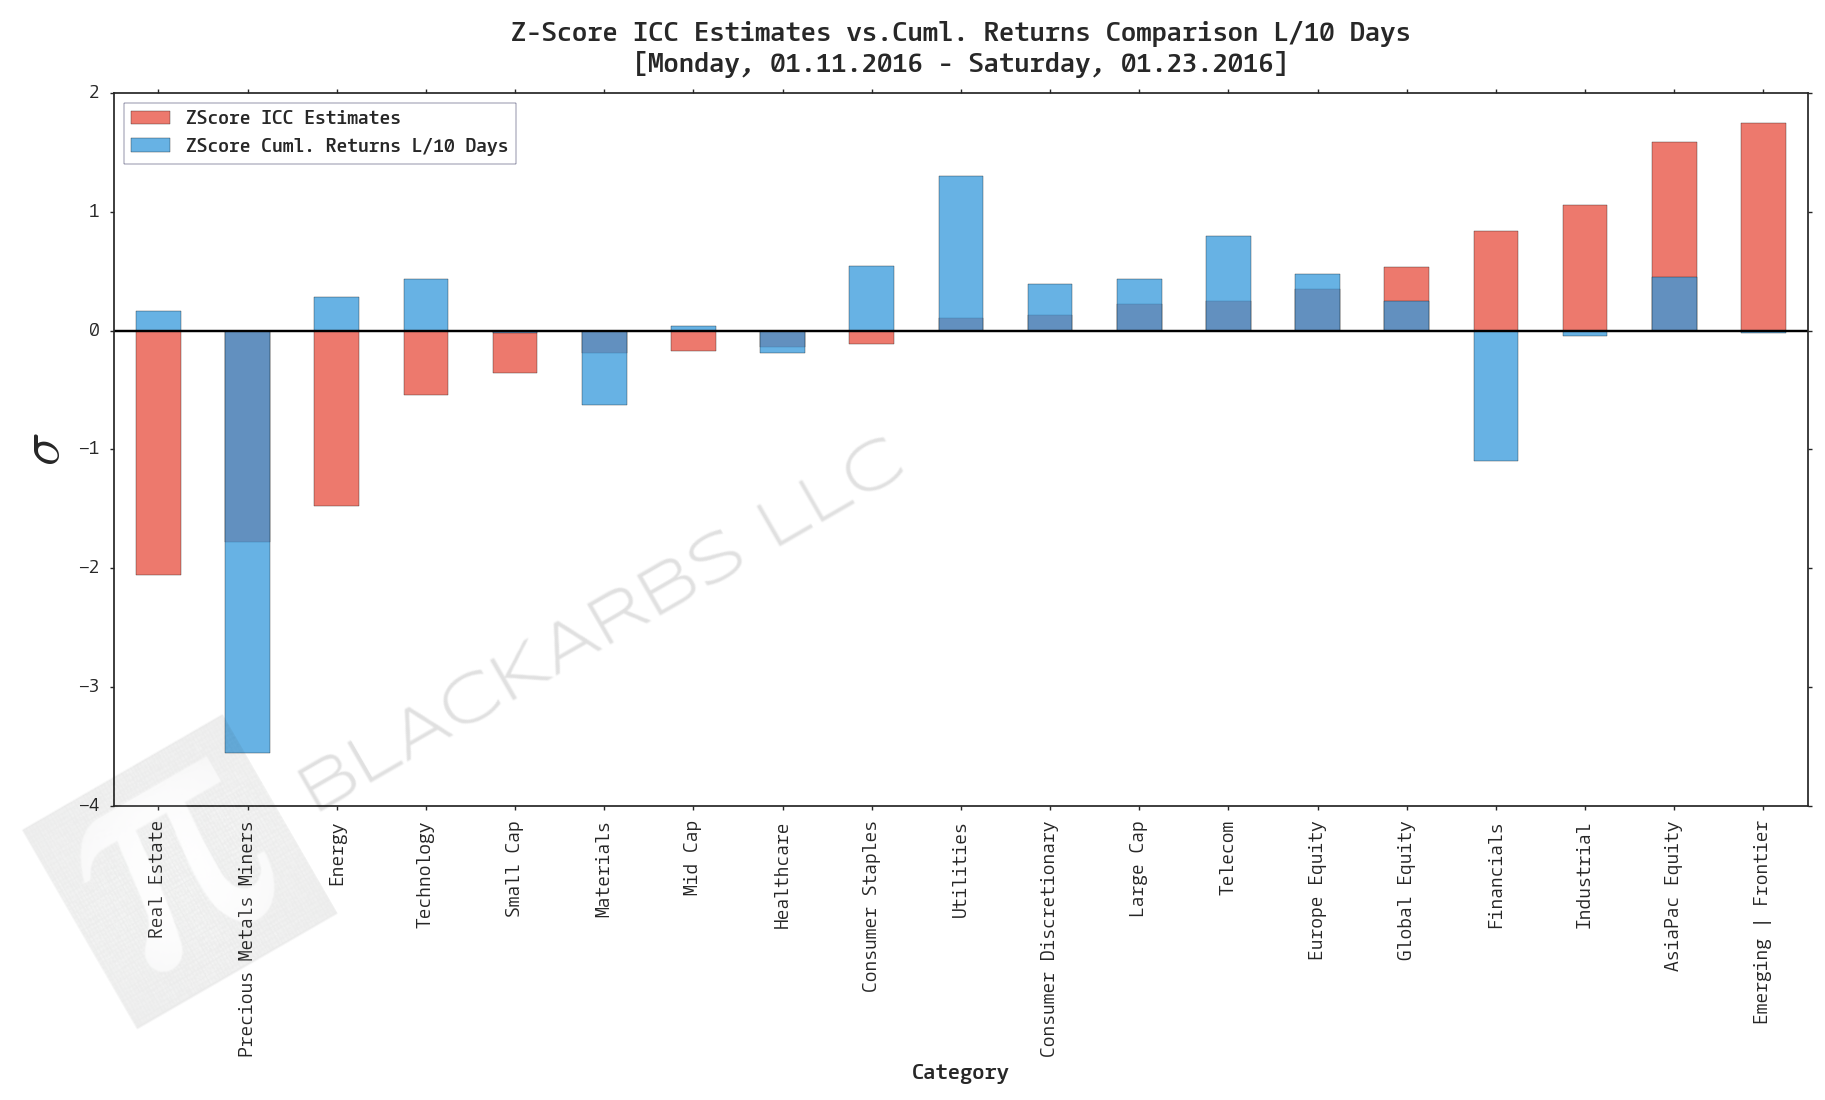
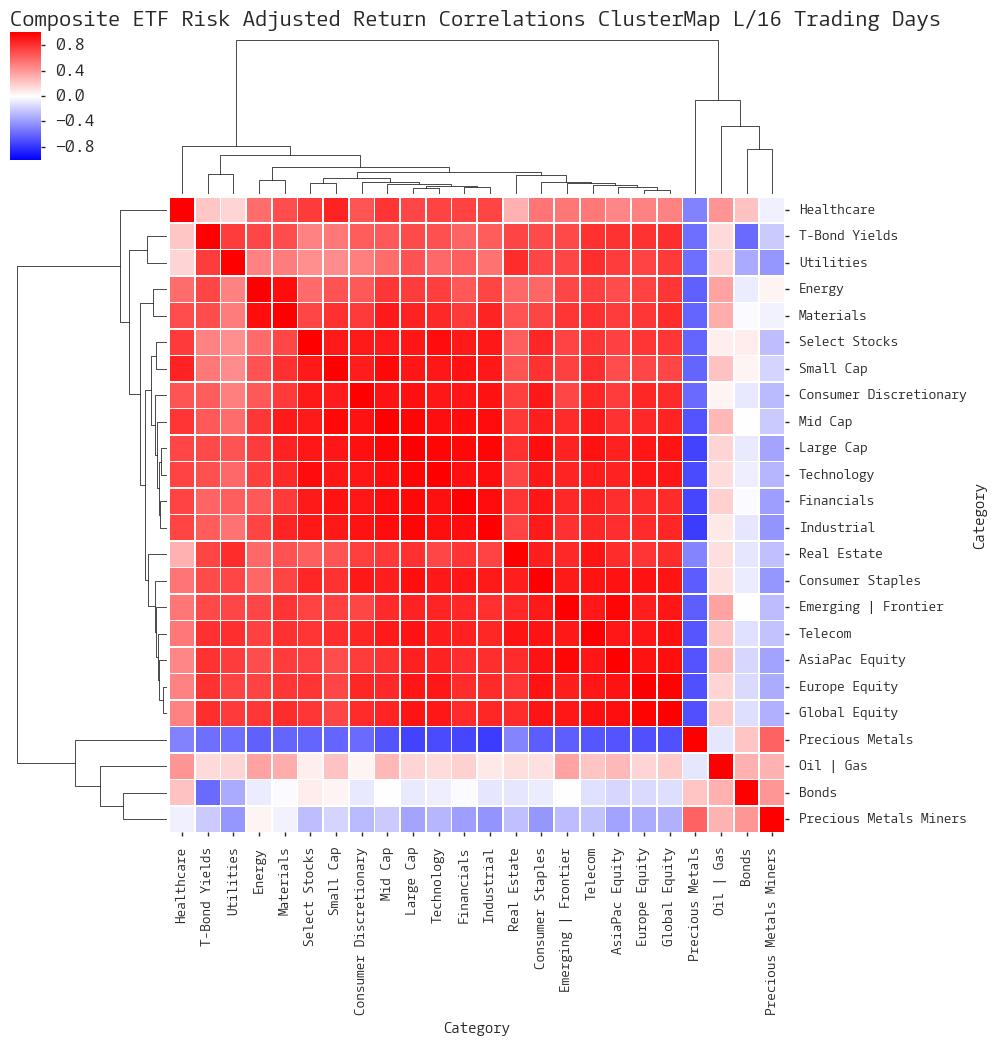
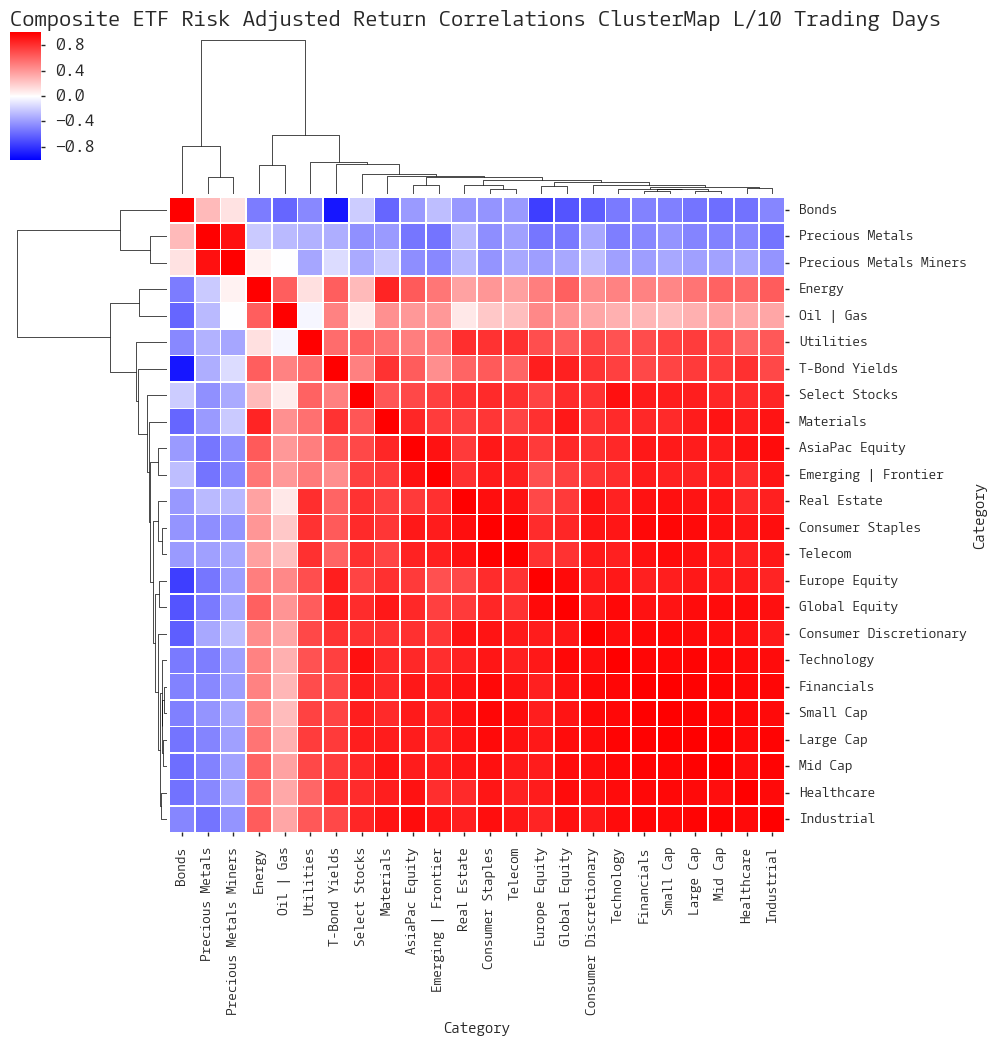
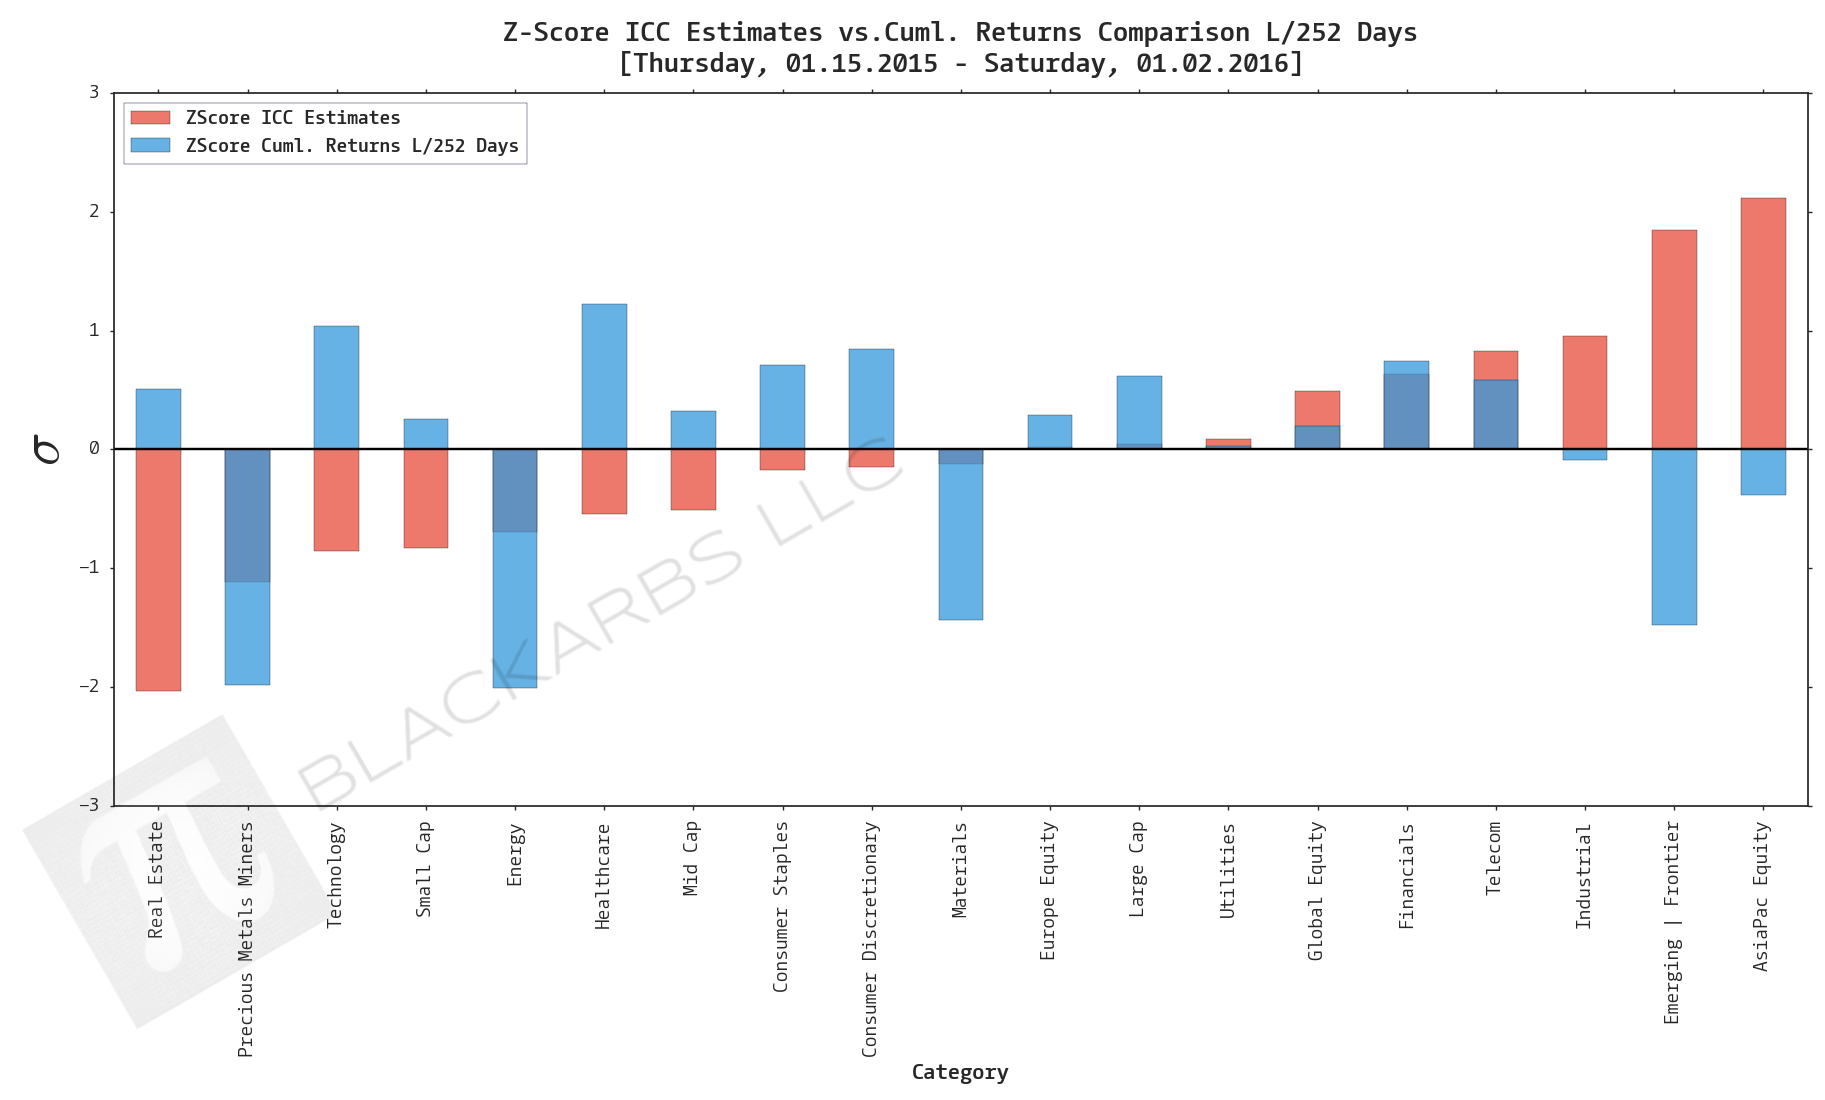
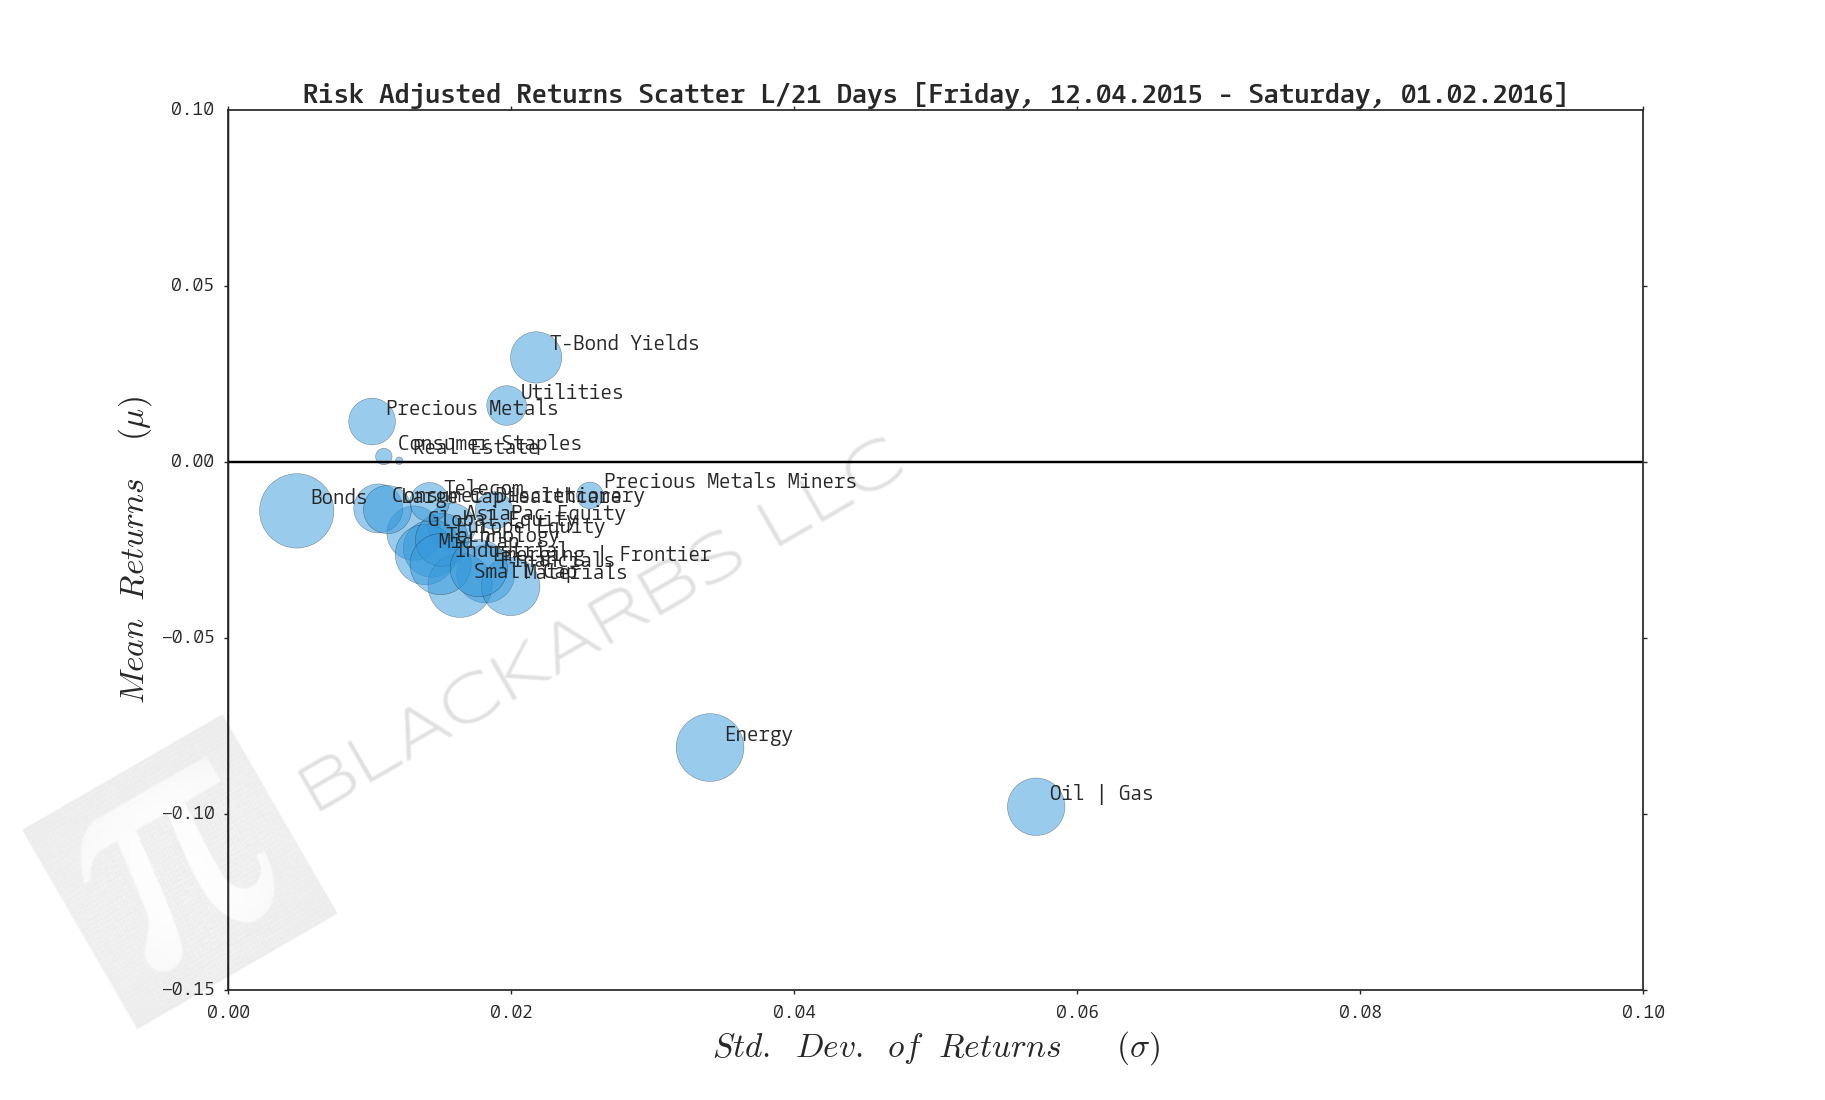
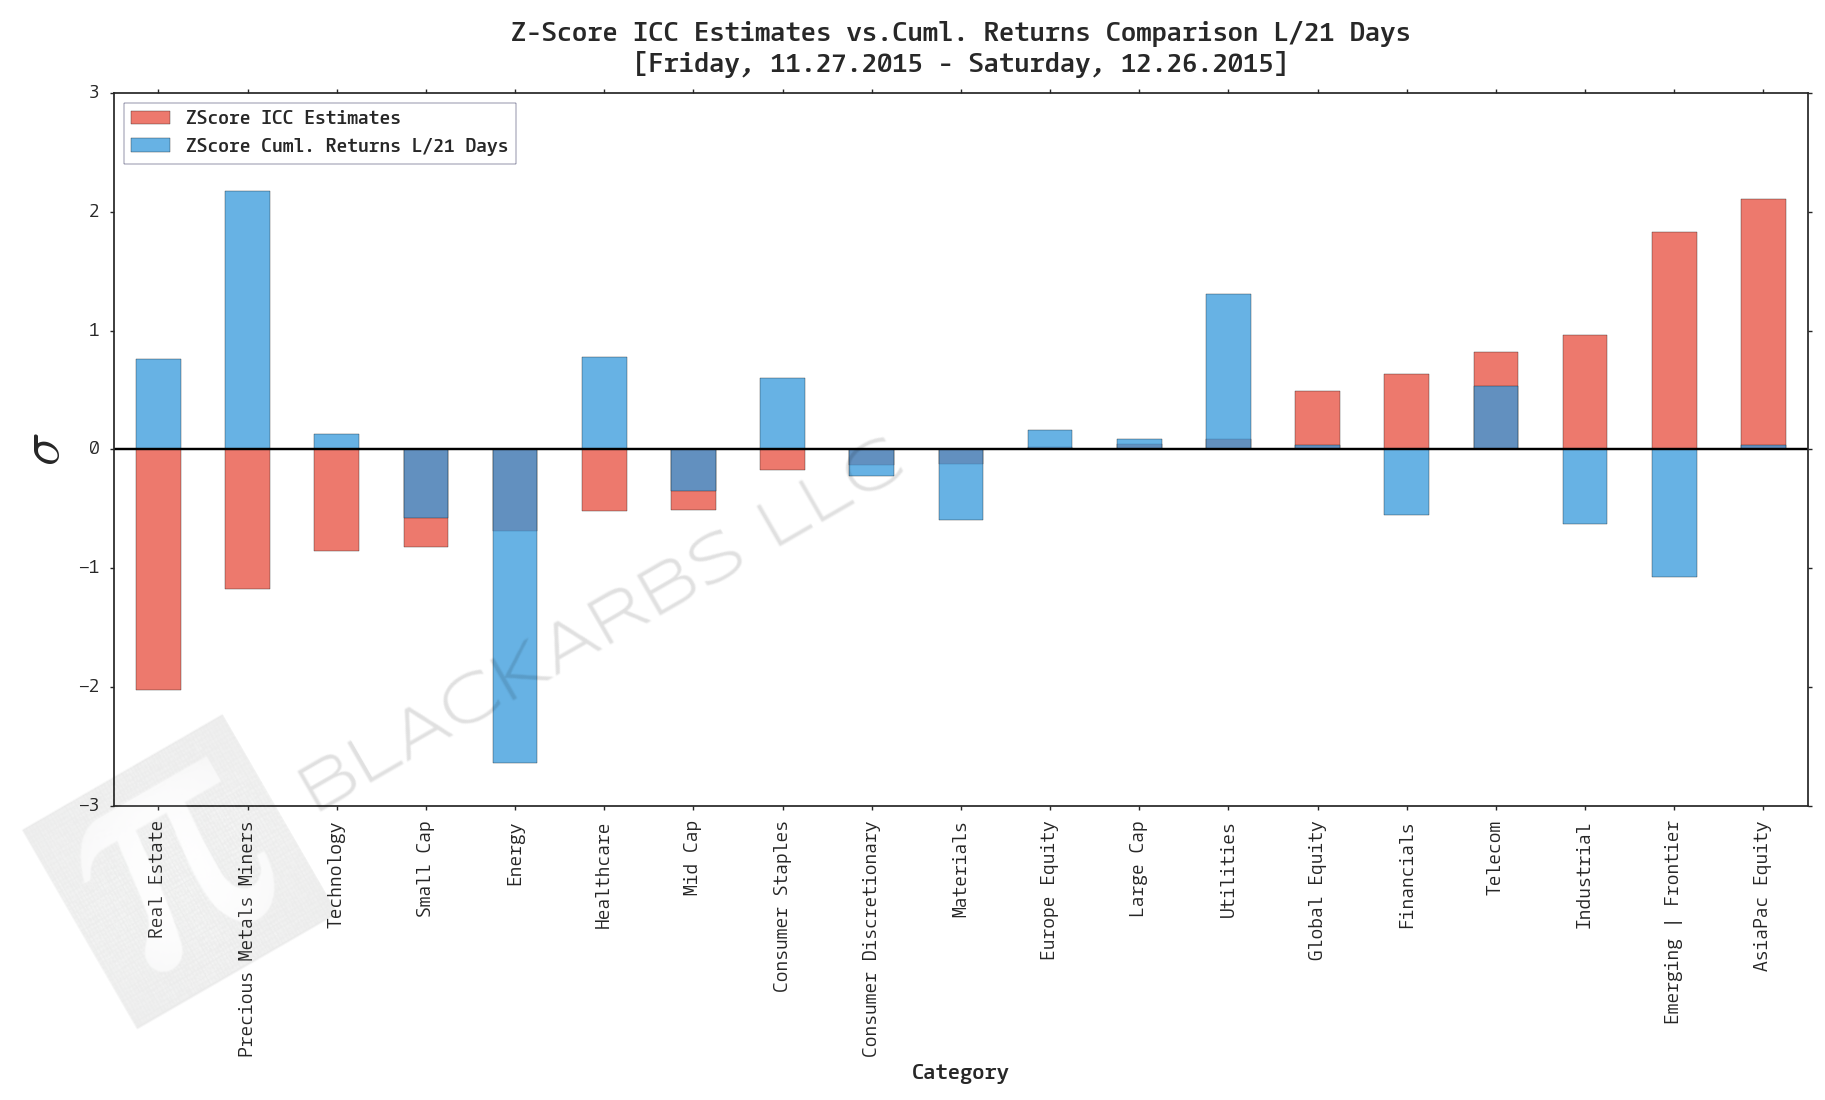
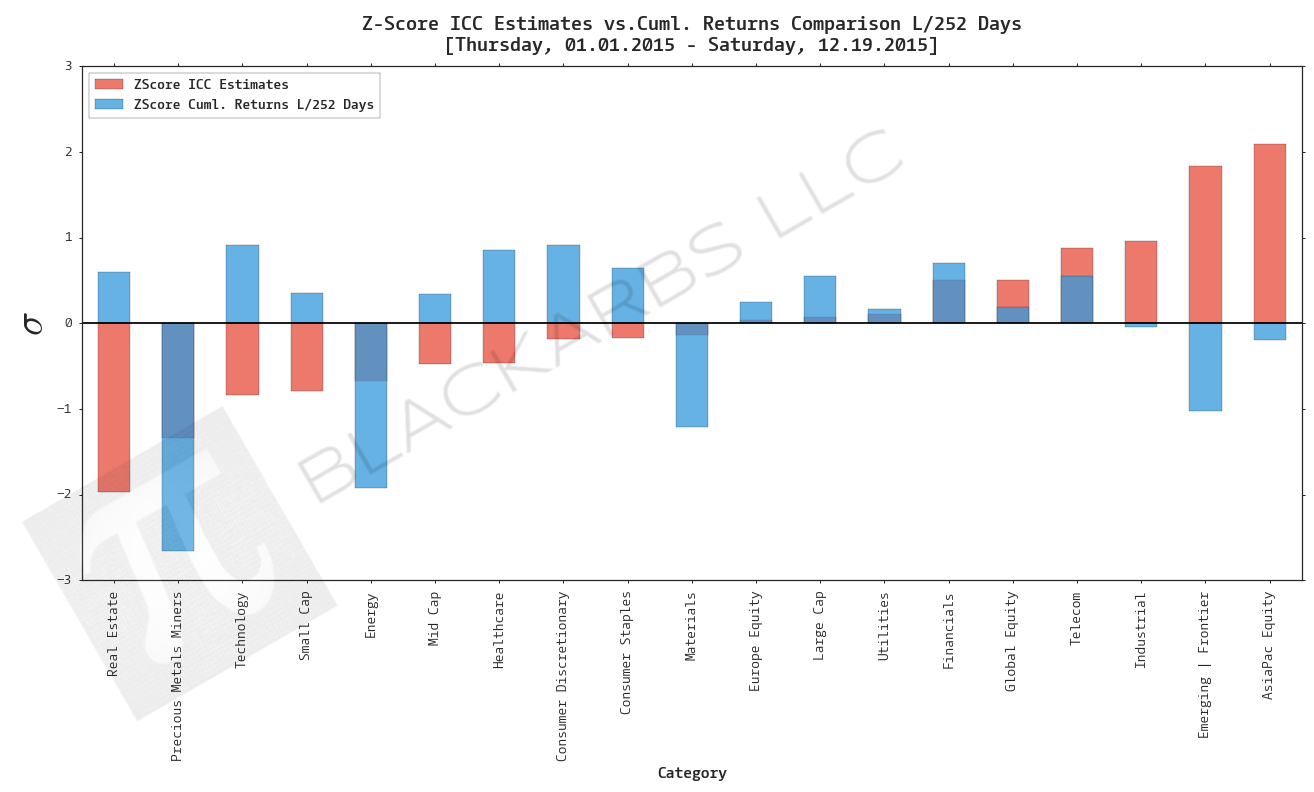
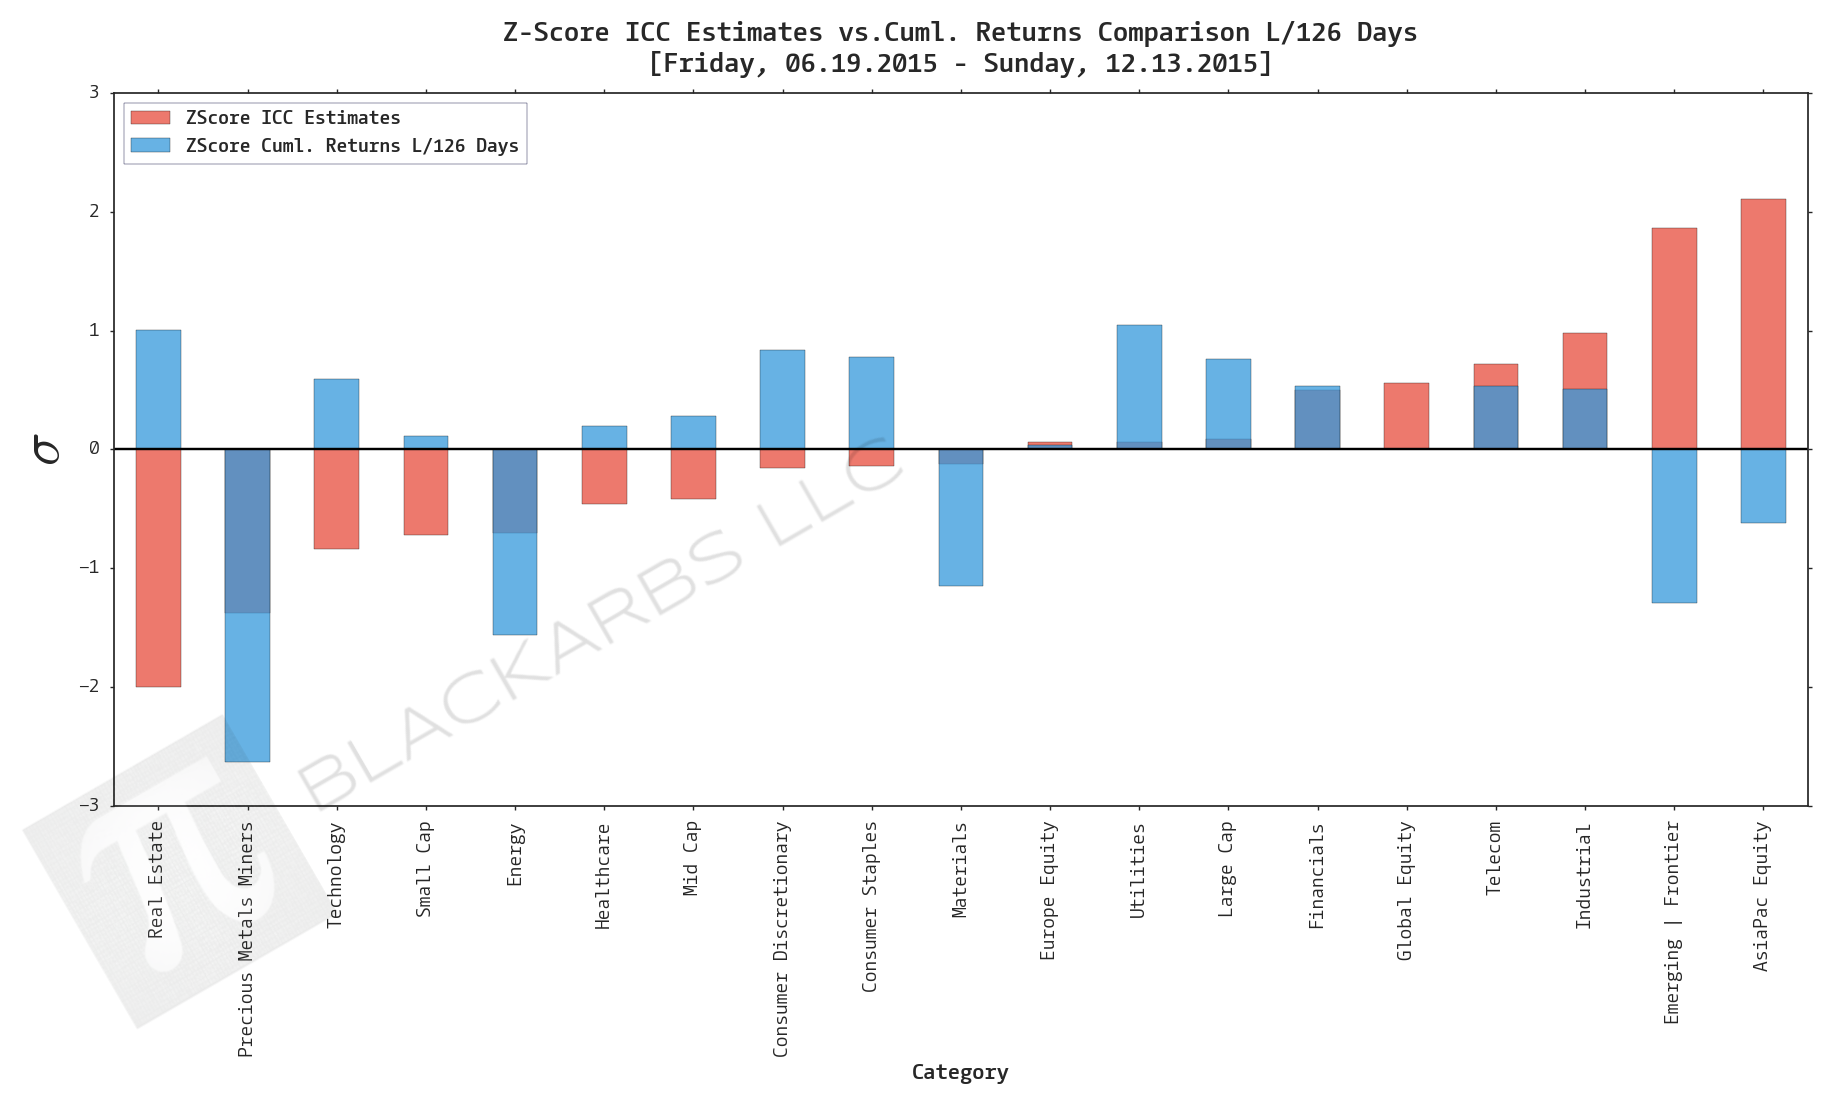
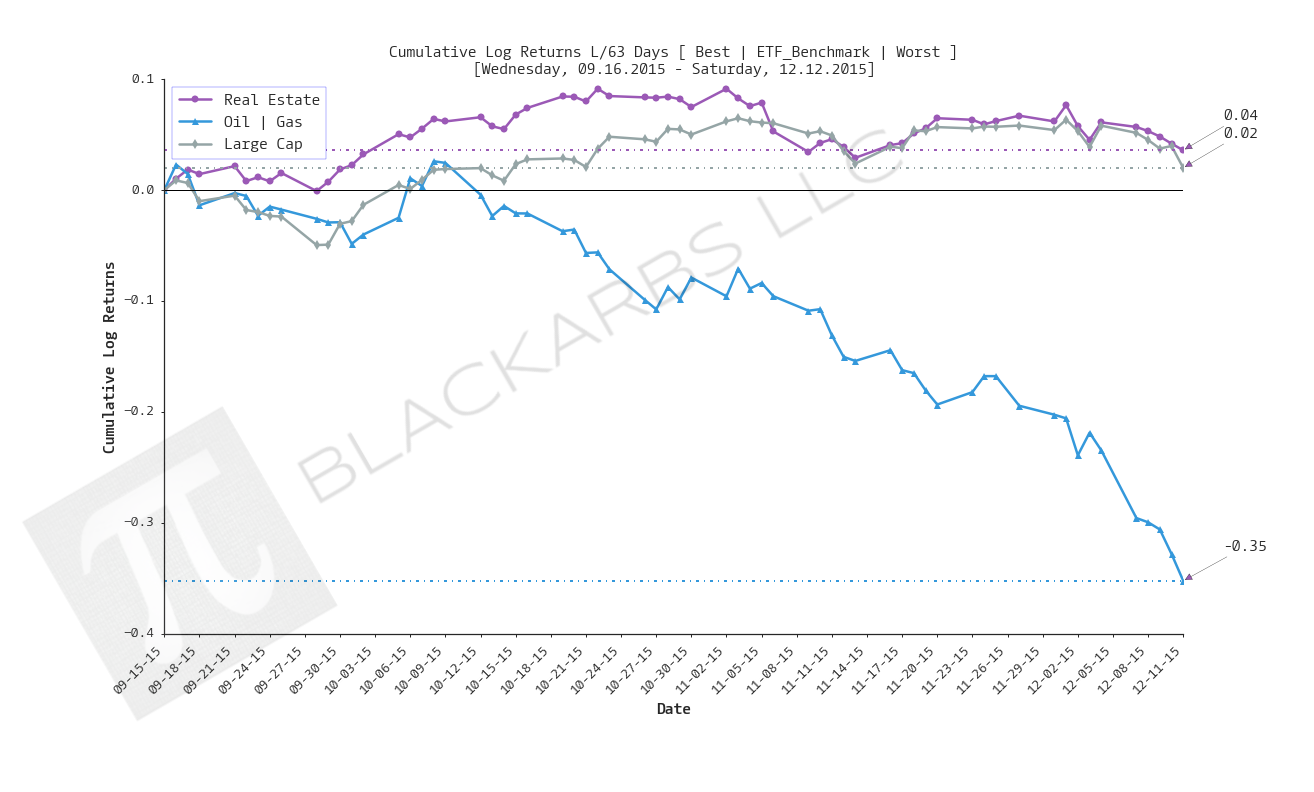
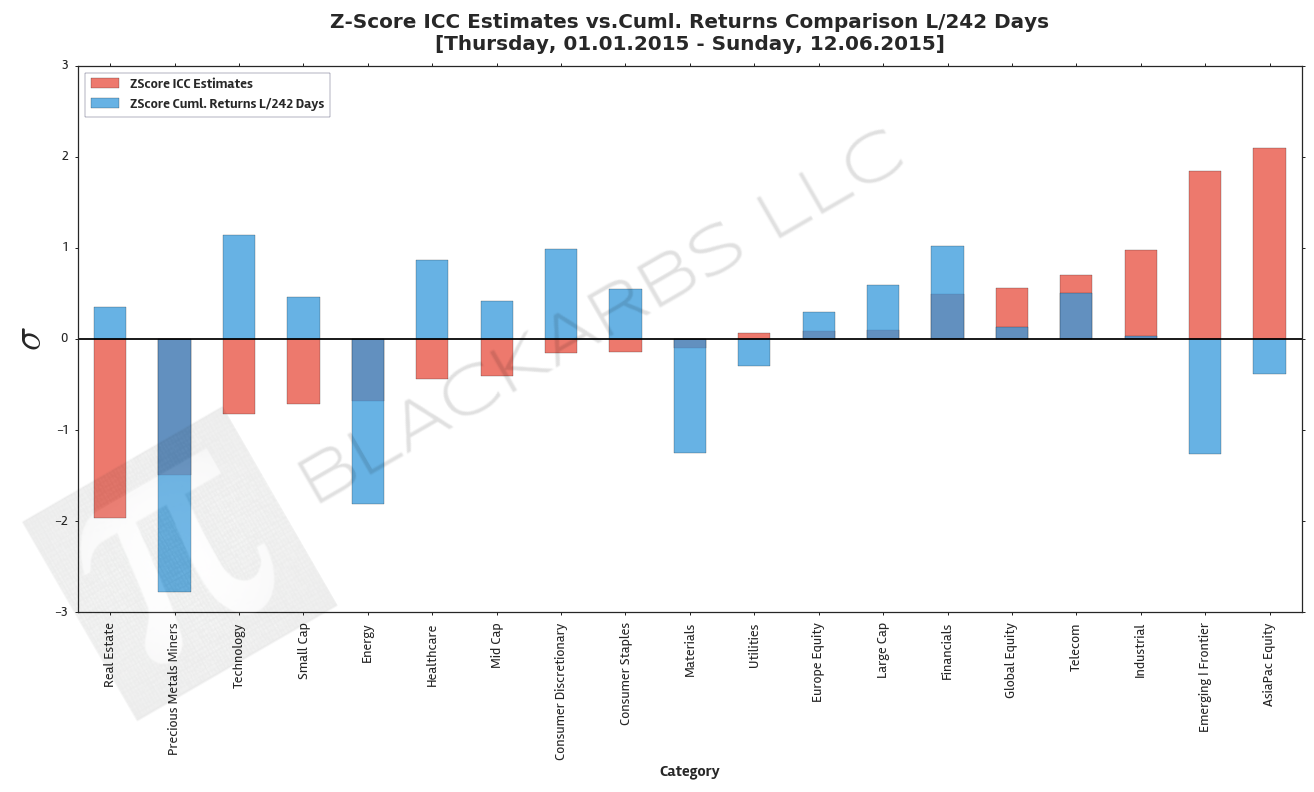
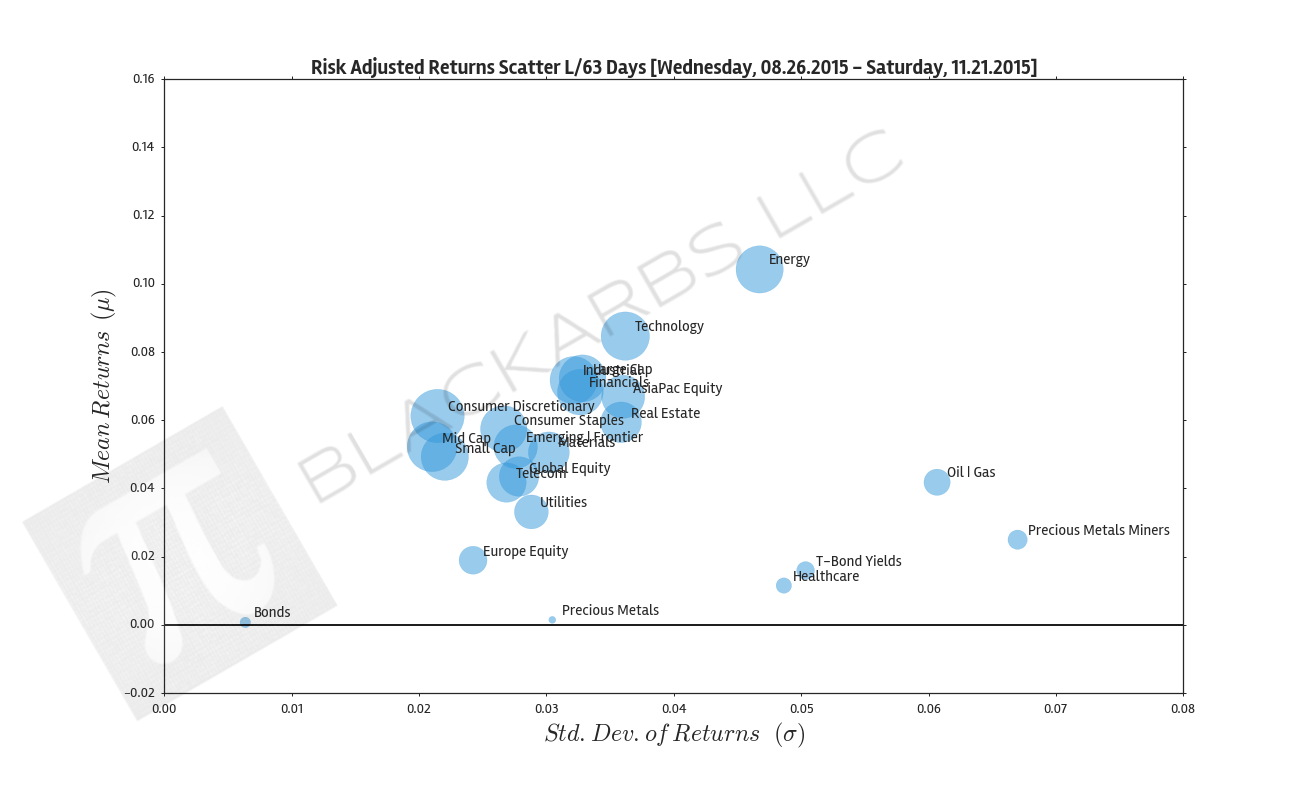
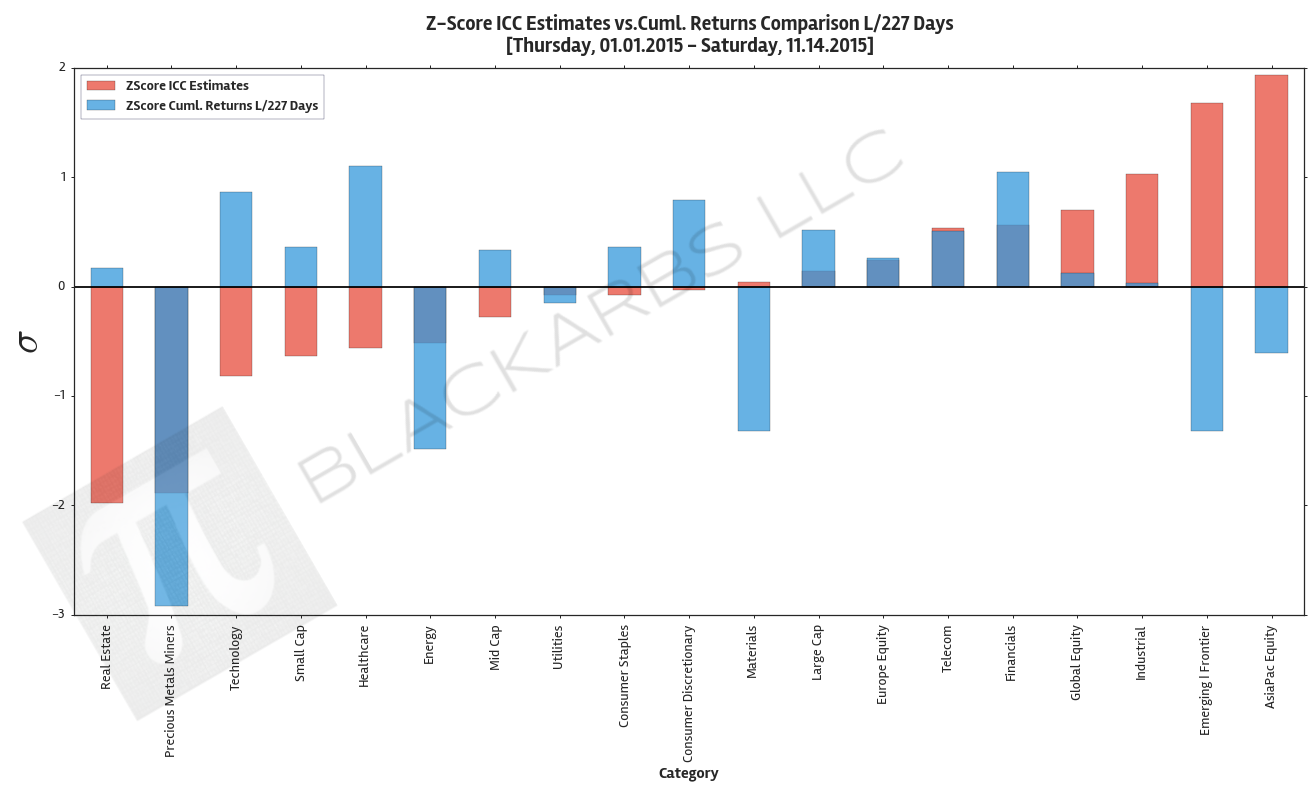
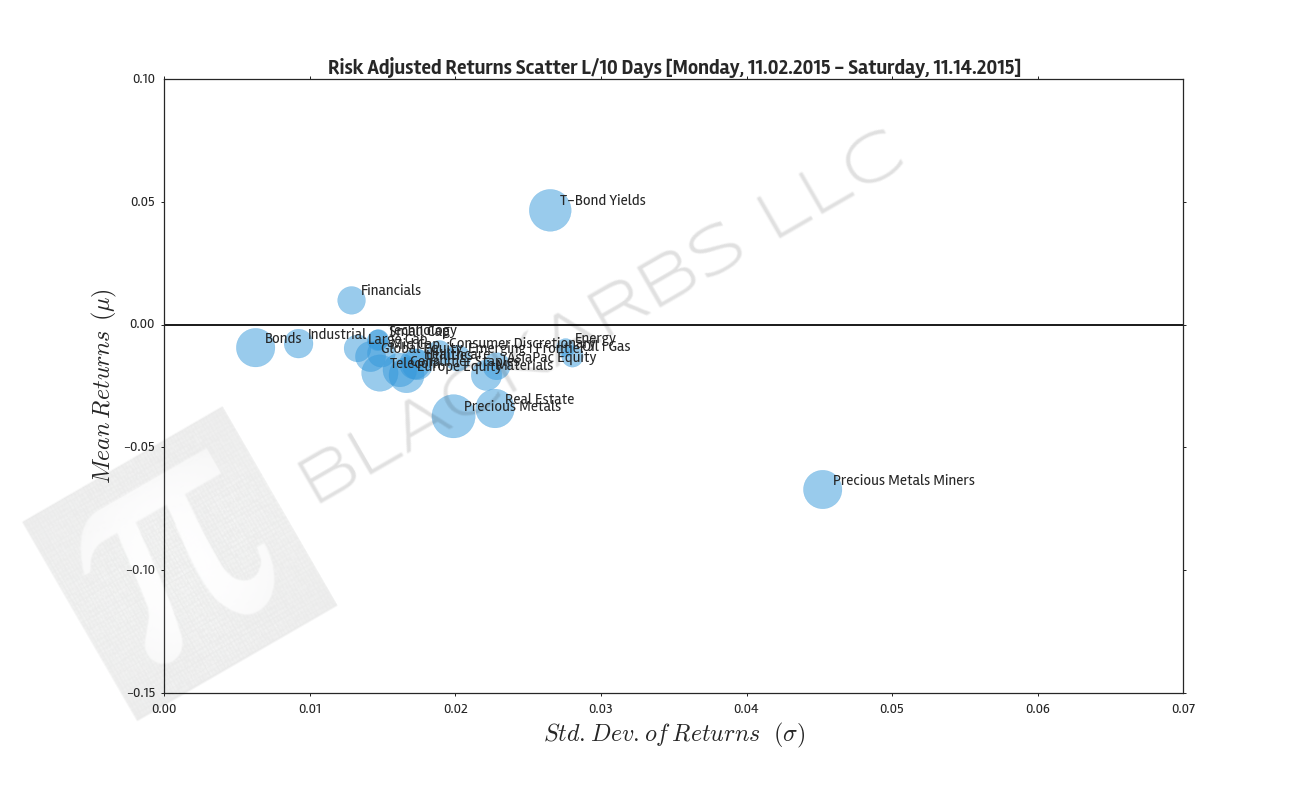
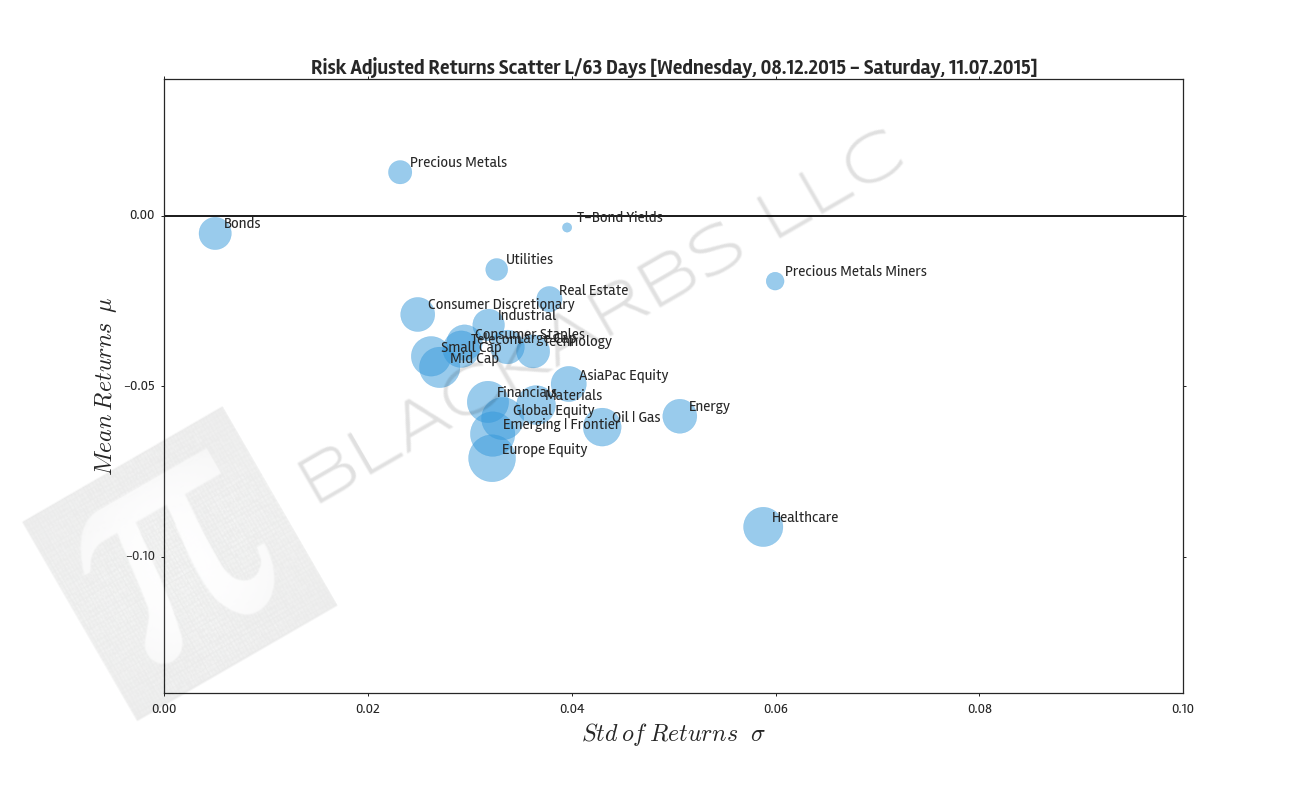
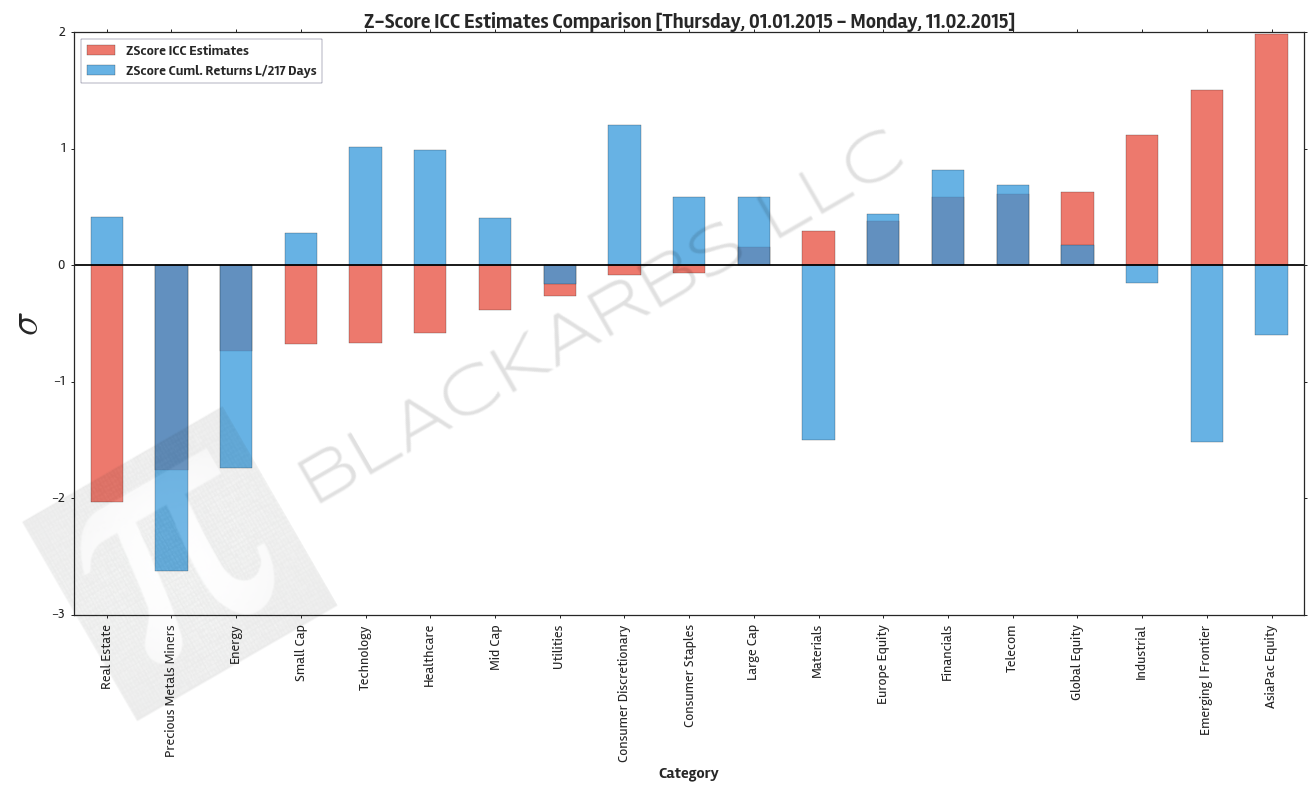
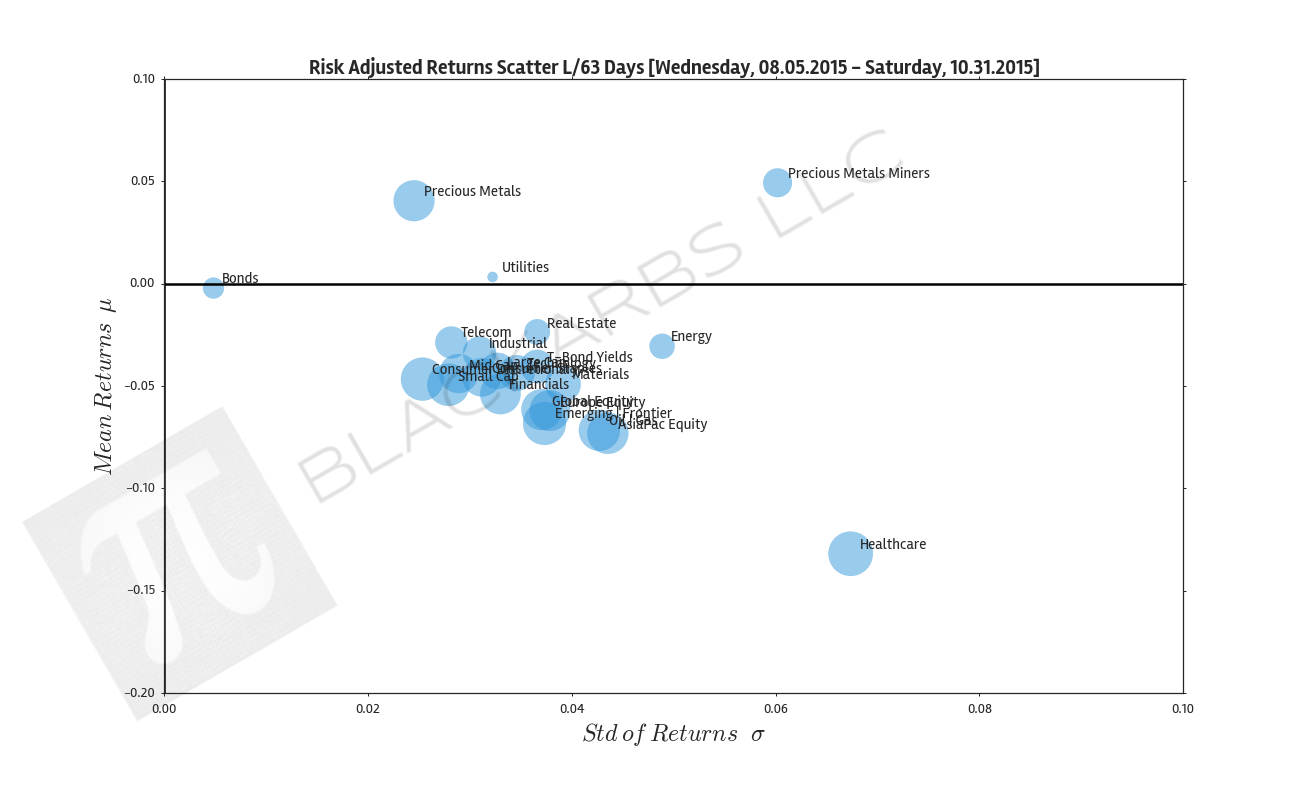
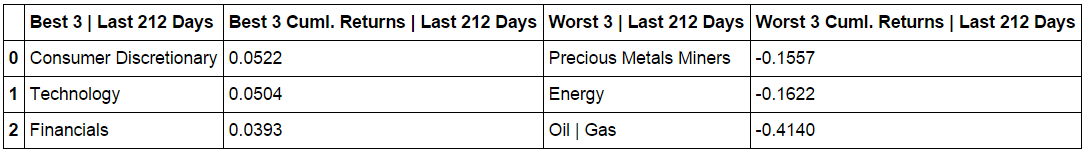
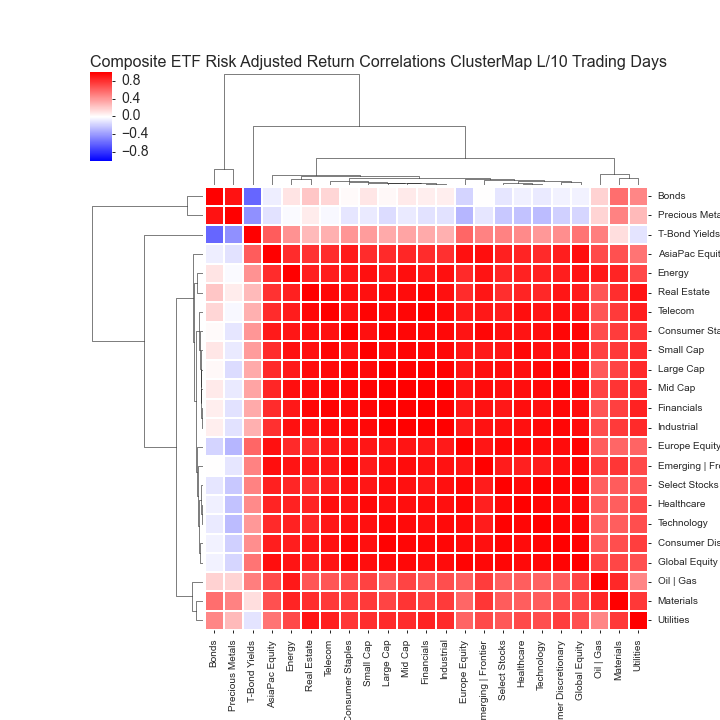
FOR A DEEPER DIVE INTO ETF PERFORMANCE AND RELATIVE VALUE SUBSCRIBE TO THE ETF INTERNAL ANALYTICS PACKAGE HERE LAYOUT (Organized by Time Period): Composite ETF Cumulative Returns Momentum Bar plot Composite ETF Cumulative Returns Line plot (best vs worst vs benchmark) Composite ETF Risk-Adjusted Returns Scatter plot (Std vs Mean) Composite ETF Risk-Adjusted Return Correlations Heatmap (Clusterplot) Implied Cost of Capital Estimates Composite ETF Cumulative Return Tables Notable Trends an
READ MORE →


![COMPOSITE SECTOR ETF VALUATION UPDATED [5.24.2015]](https://images.squarespace-cdn.com/content/v1/53ac905ee4b003339a856a1d/1432487411121-MTTLFLABAOM2TUW8U3XZ/image-asset.png/img.png)
![Composite Sector ETF Valuation updated [5.10.2015]](https://images.squarespace-cdn.com/content/v1/53ac905ee4b003339a856a1d/1431314948330-G43HVEQVV34RD704GZTZ/image-asset.png/img.png)