
FOR A DEEPER DIVE INTO ETF PERFORMANCE AND RELATIVE VALUE SUBSCRIBE TO THE ETF INTERNAL ANALYTICS PACKAGE HERE
LAYOUT (Organized by Time Period):
Composite ETF Cumulative Returns Momentum Bar plot
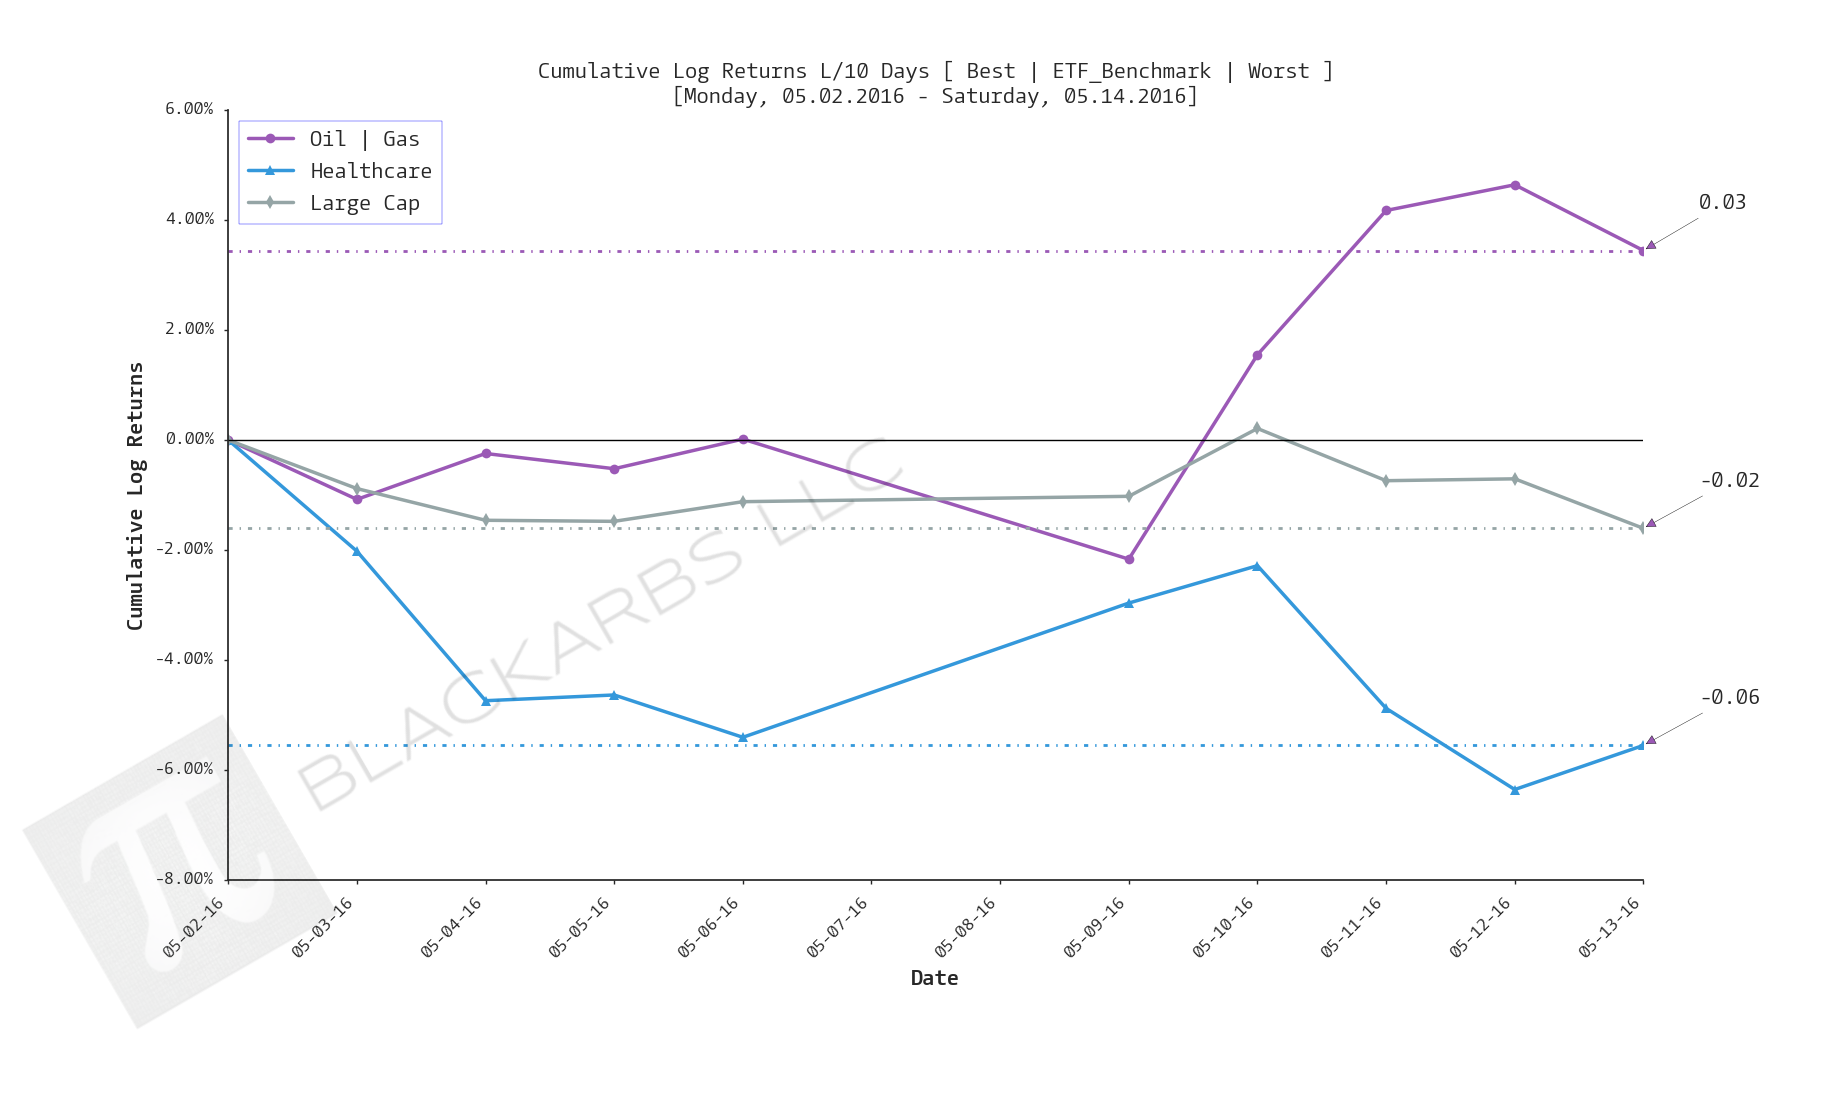
Composite ETF Cumulative Returns Line plot (best vs worst vs benchmark)
Composite ETF Risk-Adjusted Returns Scatter plot (Std vs Mean)
Composite ETF Risk-Adjusted Return Correlations Heatmap (Clusterplot)
Implied Cost of Capital Estimates
Composite ETF Cumulative Return Tables
Notable Trends and Observations
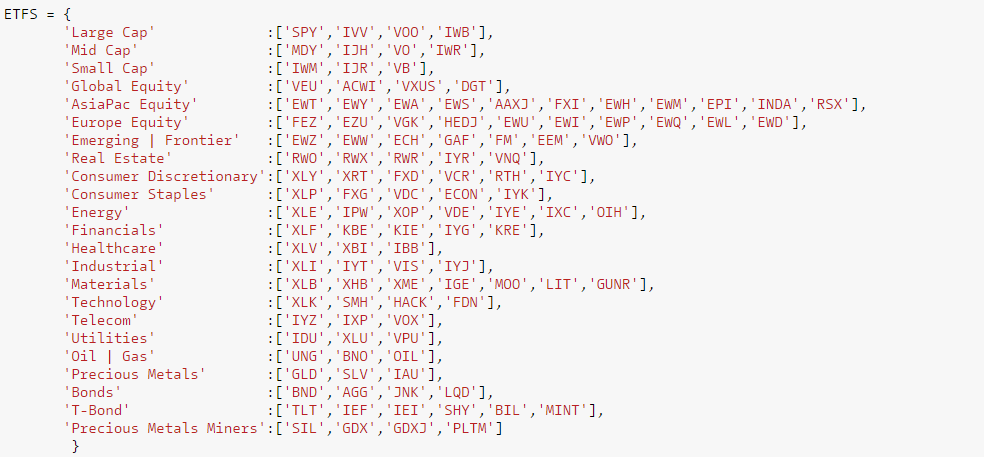
COMPOSITE ETF COMPONENTS:
LAST 252 TRADING DAYS

CLICK HERE FOR HELP UNDERSTANDING THIS CHART

CLICK HERE FOR HELP UNDERSTANDING THIS CHART

CLICK HERE FOR HELP UNDERSTANDING THIS CHART

CLICK HERE FOR HELP UNDERSTANDING THIS CHART
LAST 126 TRADING DAYS

CLICK HERE FOR HELP UNDERSTANDING THIS CHART

CLICK HERE FOR HELP UNDERSTANDING THIS CHART

CLICK HERE FOR HELP UNDERSTANDING THIS CHART

CLICK HERE FOR HELP UNDERSTANDING THIS CHART
LAST 63 TRADING DAYS

CLICK HERE FOR HELP UNDERSTANDING THIS CHART

CLICK HERE FOR HELP UNDERSTANDING THIS CHART

CLICK HERE FOR HELP UNDERSTANDING THIS CHART

CLICK HERE FOR HELP UNDERSTANDING THIS CHART
LAST 21 TRADING DAYS

CLICK HERE FOR HELP UNDERSTANDING THIS CHART

CLICK HERE FOR HELP UNDERSTANDING THIS CHART

CLICK HERE FOR HELP UNDERSTANDING THIS CHART

CLICK HERE FOR HELP UNDERSTANDING THIS CHART
LAST 10 TRADING DAYS

CLICK HERE FOR HELP UNDERSTANDING THIS CHART
CLICK HERE FOR HELP UNDERSTANDING THIS CHART

CLICK HERE FOR HELP UNDERSTANDING THIS CHART

CLICK HERE FOR HELP UNDERSTANDING THIS CHART
Implied Cost of Capital Estimates:
To learn more about the Implied Cost of Capital see here.
ALL ETF ICC ESTIMATES BY CATEGORY
CATEGORY AVERAGE ICC ESTIMATES
CUMULATIVE RETURN TABLES:
NOTABLE OBSERVATIONS AND TRENDS:
- The healthcare composite has been a bottom 3 performer across all time frames.
- The Oil+Gas composite has been strong recently as a top 3 performer L/63, L/21, and L/10 days.
- The Large Cap composite is essentially unchanged over the L/252 and L/126 days.
- PMM has continued to outperform. The long gold and gold producers trade has been the trade of the year.
- PMM is up 60% (log returns) over L/126 days!
- An anecdotal observation: When every composite is all positive(negative) returns over the L/63 days or less, there has been a tendency for the markets to mean revert. Notice the return range compression for both best/worst performers over L/10 days. Seems like there is either a lack of catalysts or indecision among market participants.