NEW LAYOUT:
Going forward I will be testing a new organizational format for the charts. I have created a chart description page which details how each plot type is commonly interpreted (used). I will provide a link to the chart description page in the caption of each chart. The primary change is all the chart types will be grouped by the referenced time period. It is my hope that grouping the data this way will allow for easier analysis. Each time period grouping will display the charts in the following order:
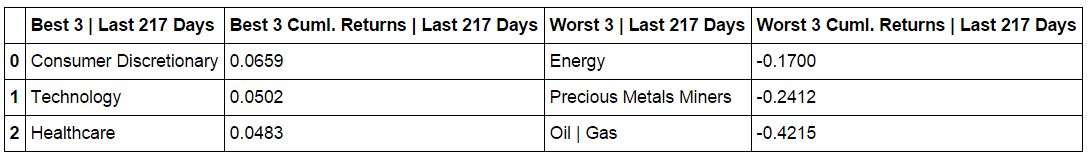
Composite ETF Cumulative Returns Momentum Bar plot and associated Tables
Composite ETF Cumulative Returns Line plot
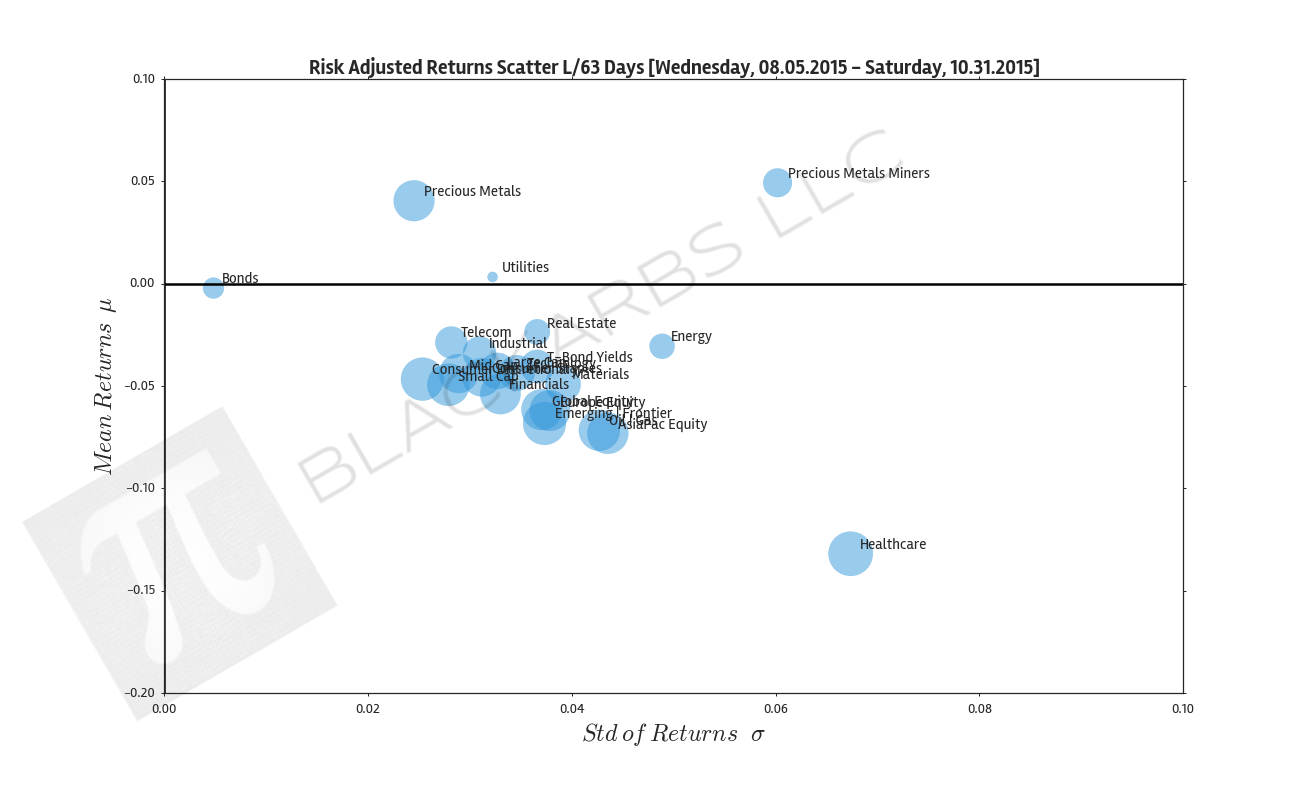
Composite ETF Risk-Adjusted Returns Scatter plot (Std vs Mean)
Composite ETF Risk-Adjusted Return Correlations Heatmap (Clusterplot)
YEAR-TO-DATE LAST 217 TRADING DAYS

Click here for help understanding this Chart

Click here for help understanding this Chart

Click here for help understanding this Chart

Click here for help understanding this Chart
LAST 63 TRADING DAYS

Click here for help understanding this Chart


Click here for help understanding this Chart

Click here for help understanding this Chart

Click here for help understanding this Chart
LAST 21 TRADING DAYS

Click here for help understanding this Chart


Click here for help understanding this Chart

Click here for help understanding this Chart
LAST 10 TRADING DAYS

Click here for help understanding this Chart


Click here for help understanding this Chart

Click here for help understanding this Chart

Click here for help understanding this Chart Blog RSS #block-yui_3_17_2_4_1446322691243_58460 .social-icons-style-border .sqs-svg-icon--wrapper { box-shadow: 0 0 0 2px inset; border: none; }