Global MarketsPython
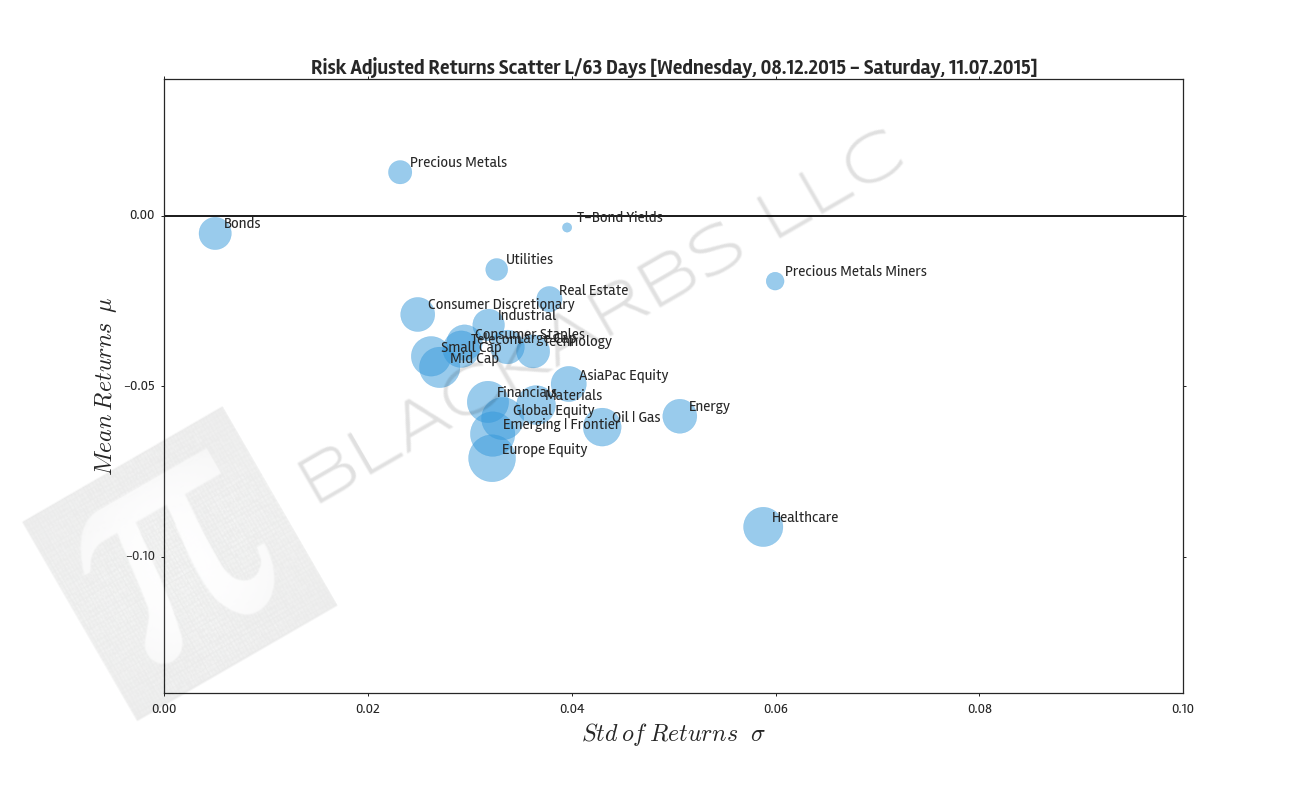
COMPOSITE MACRO ETF WEEKLY ANALYTICS (11/07/2015)
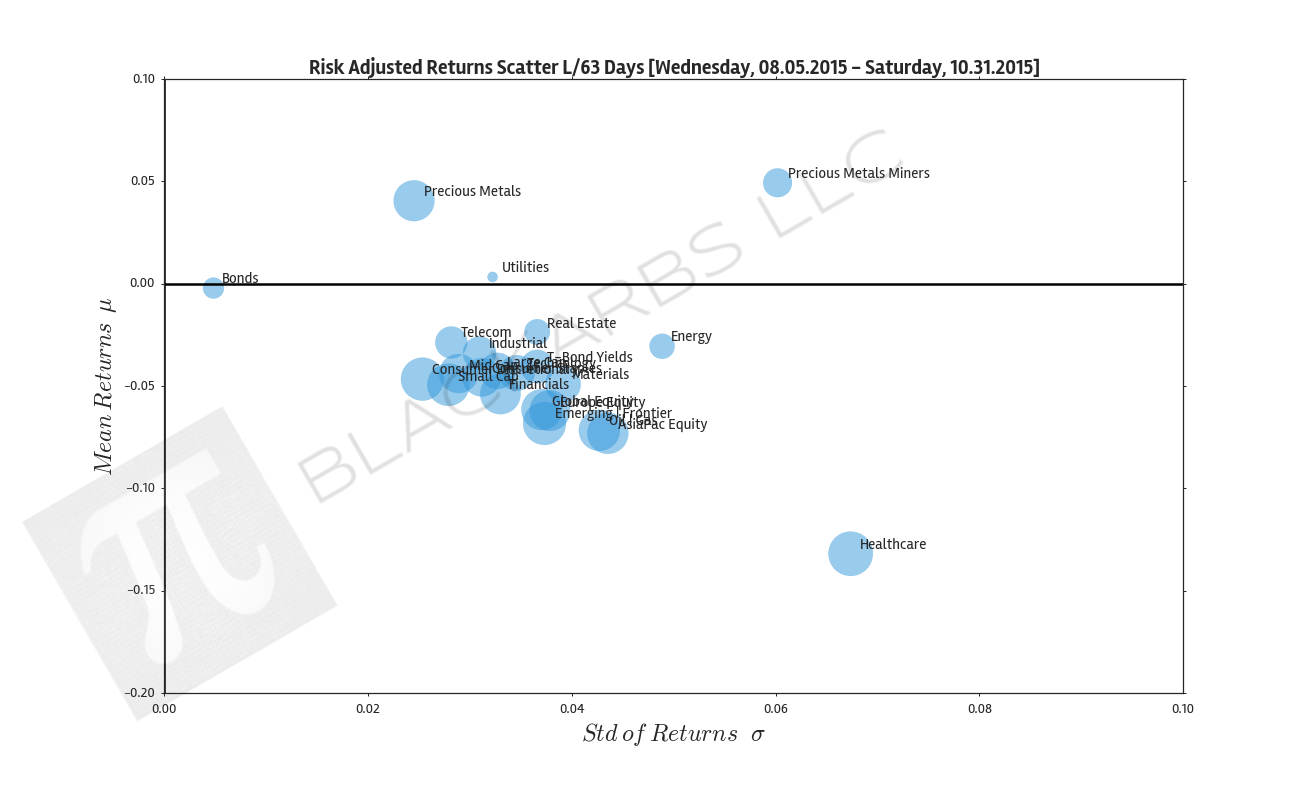
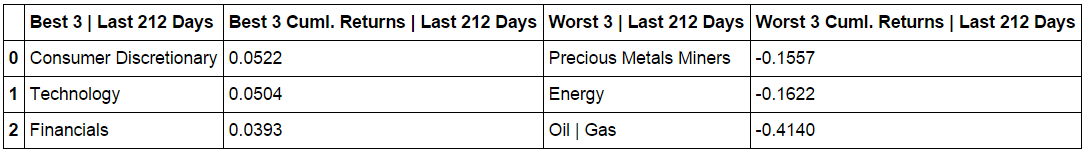
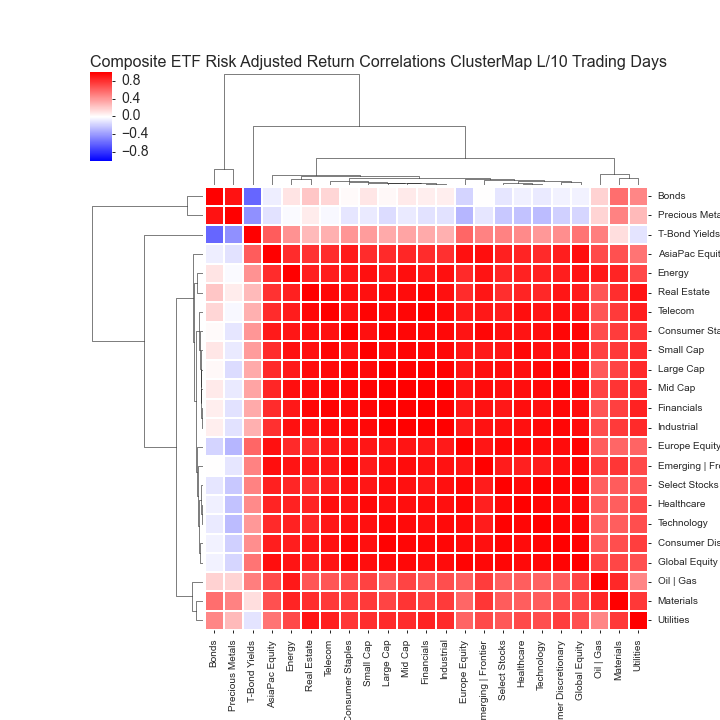
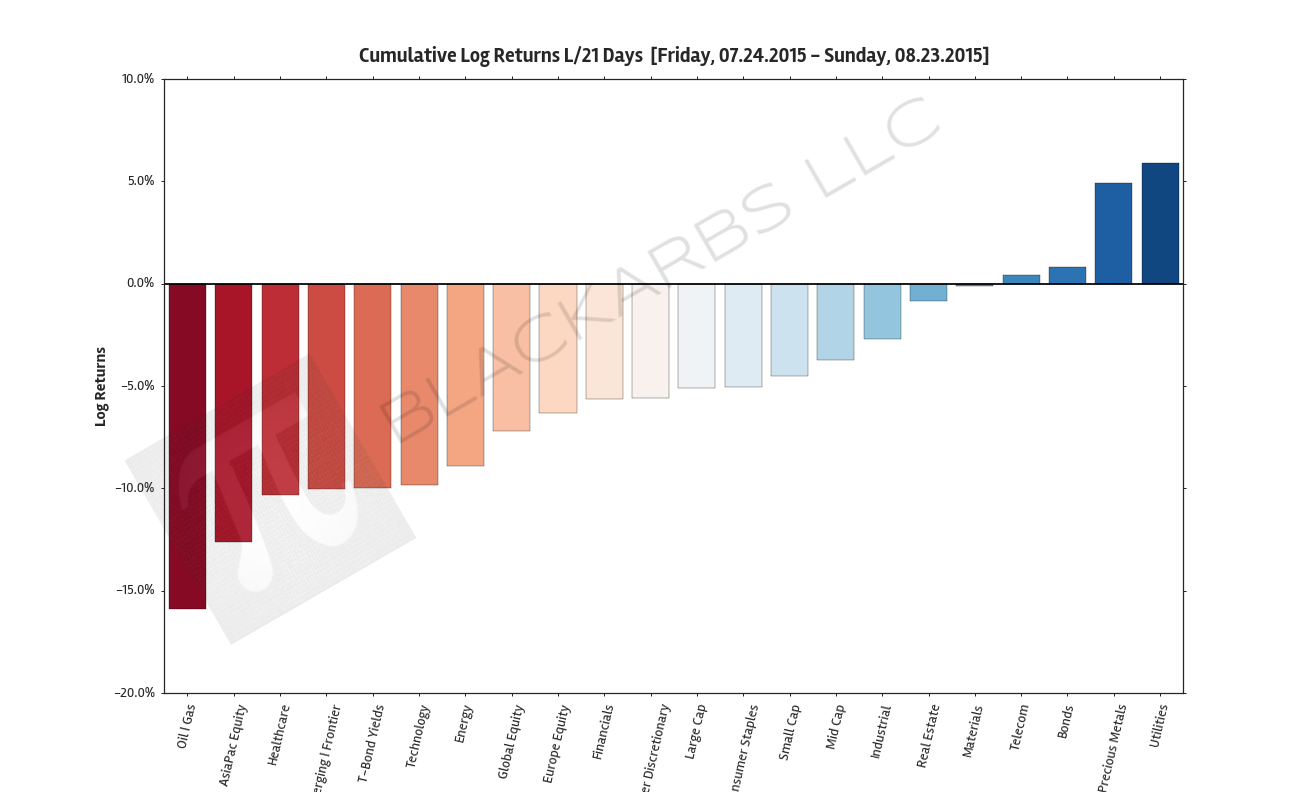
NEW LAYOUT: Composite ETF Cumulative Returns Momentum Bar plot and associated Tables Composite ETF Cumulative Returns Line plot Composite ETF Risk-Adjusted Returns Scatter plot (Std vs Mean) Composite ETF Risk-Adjusted Return Correlations Heatmap (Clusterplot) YEAR-TO-DATE LAST 222 TRADING DAYS Click here for help understanding this Chart Click here for help understanding this Chart Click here for help understanding this Chart Click here for help understanding this Chart LAST 63
READ MORE →