PythonGlobal Markets
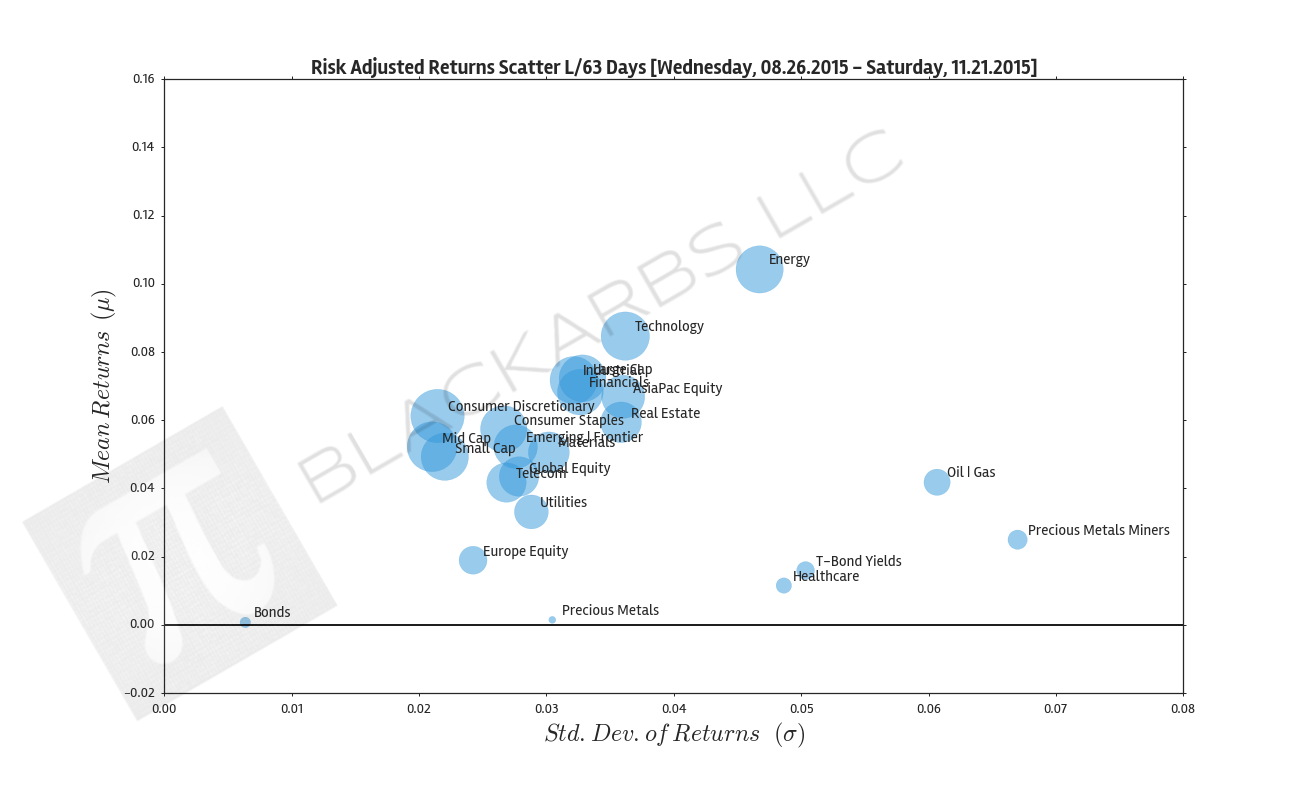
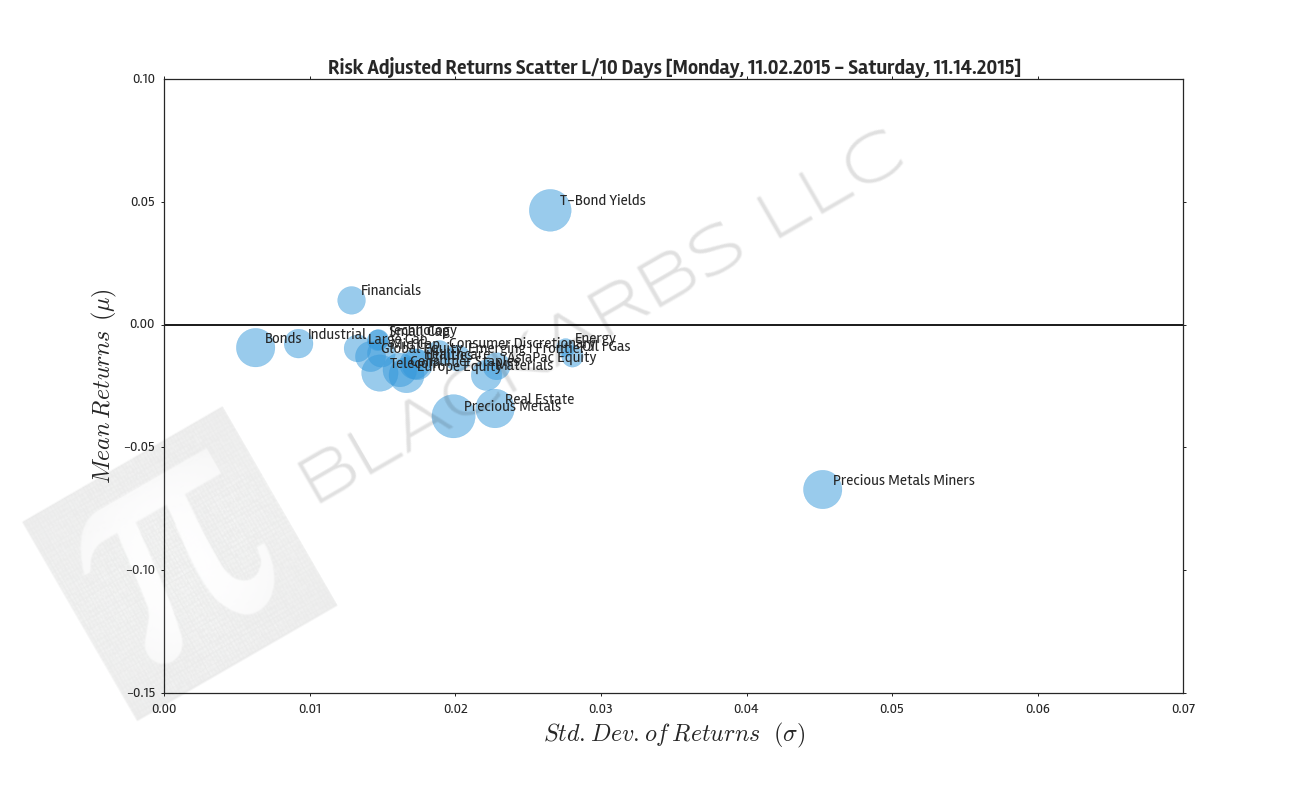
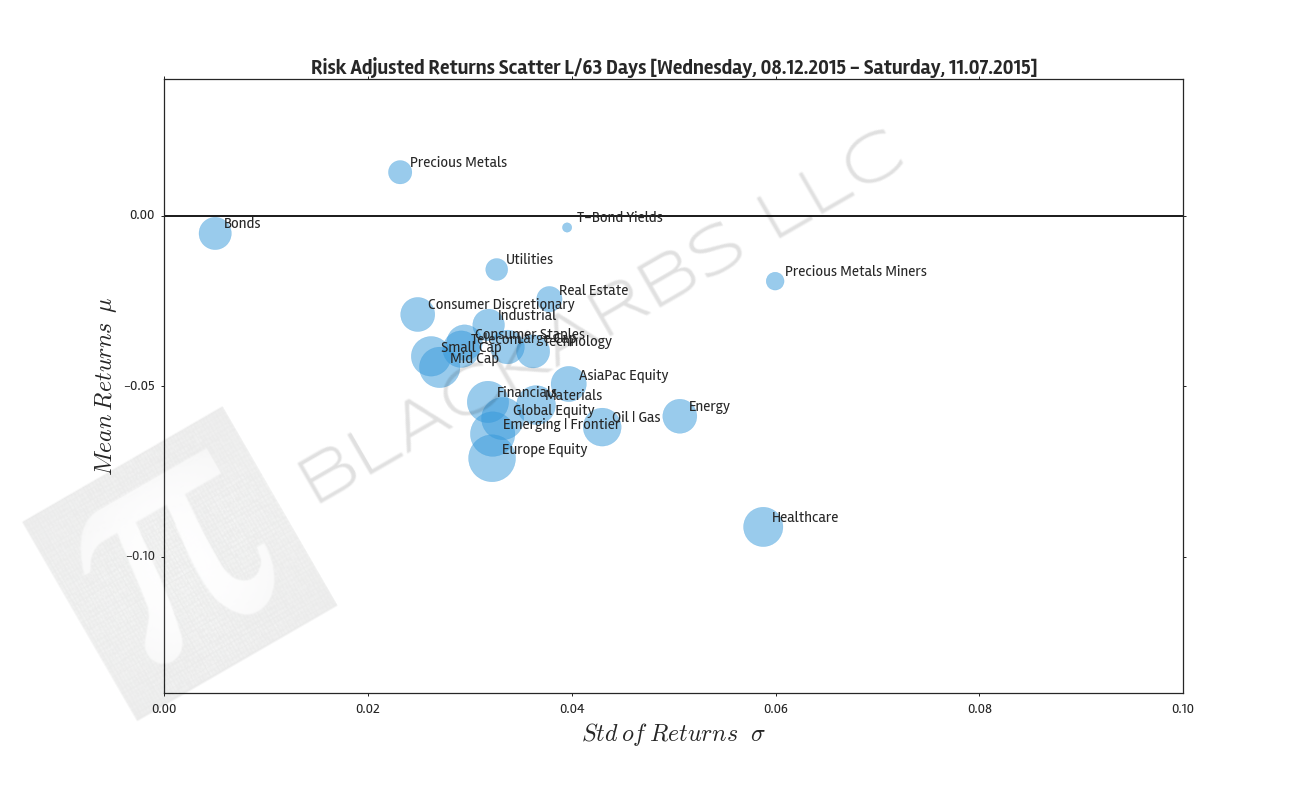
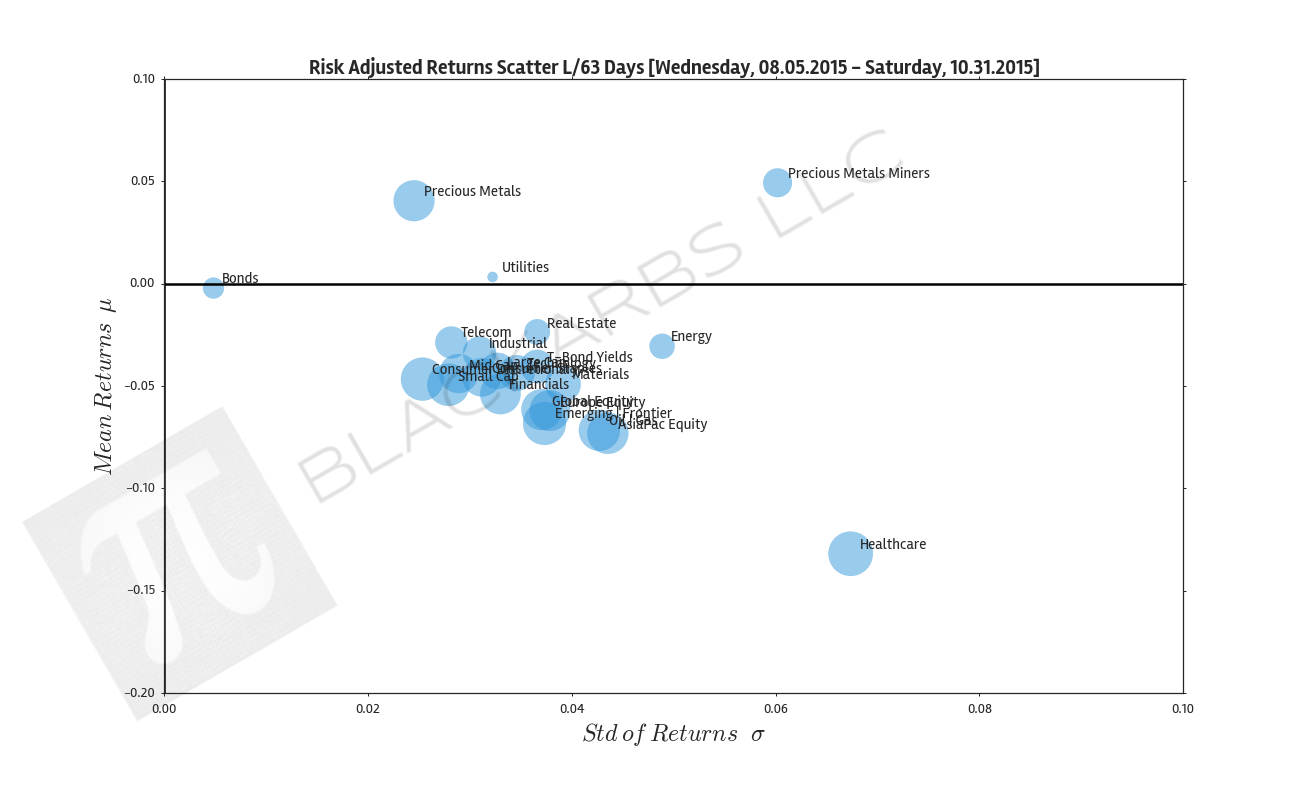
COMPOSITE MACRO ETF WEEKLY ANALYTICS (11/28/2015)
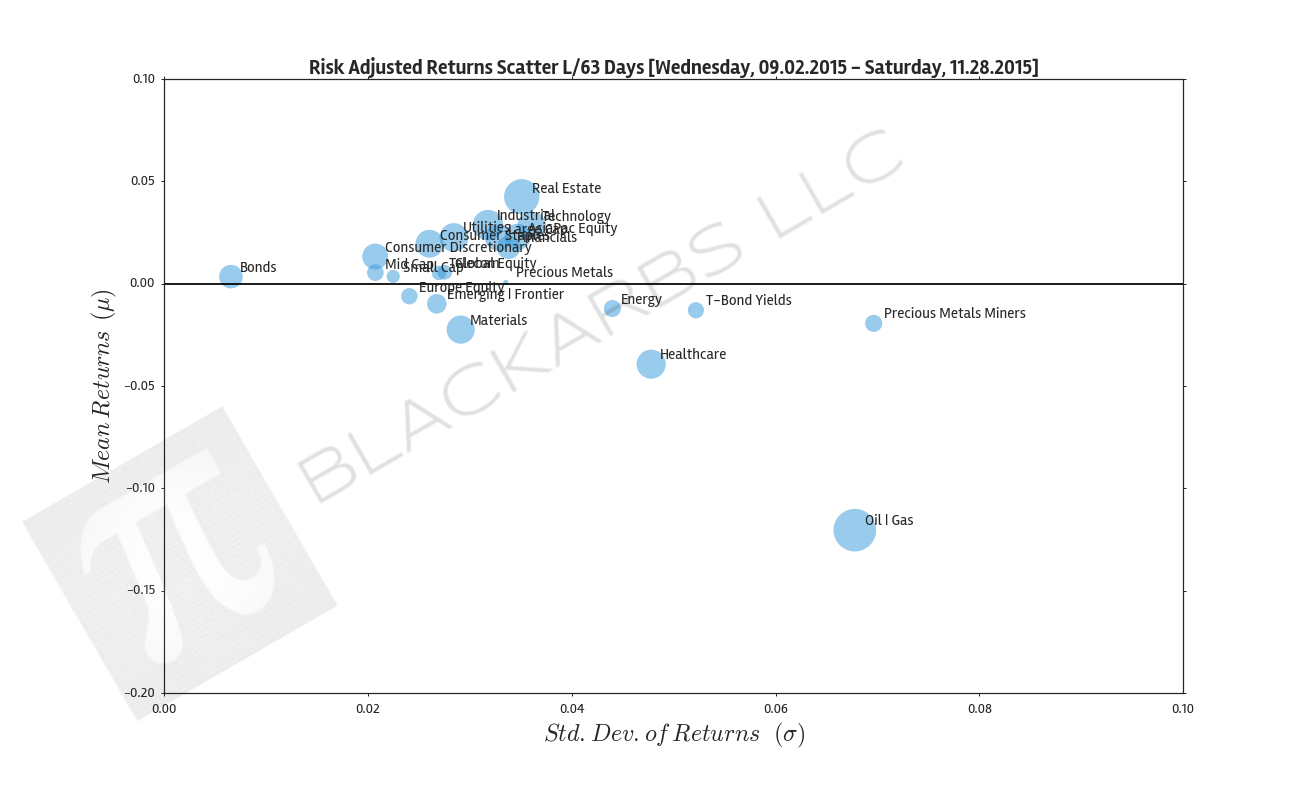
NEW LAYOUT (Organized by Time Period): Composite ETF Cumulative Returns Momentum Bar plot and associated Tables Composite ETF Cumulative Returns Line plot Composite ETF Risk-Adjusted Returns Scatter plot (Std vs Mean) Composite ETF Risk-Adjusted Return Correlations Heatmap (Clusterplot) COMPOSITE ETF COMPONENTS: YEAR-TO-DATE LAST 237 TRADING DAYS Click here for help understanding this Chart Click here for help understanding this Chart Click here for help understanding this Chart
READ MORE →