
FOR A DEEPER DIVE INTO ETF PERFORMANCE AND RELATIVE VALUE SUBSCRIBE TO THE ETF INTERNAL ANALYTICS PACKAGE HERE
LAYOUT (Organized by Time Period):
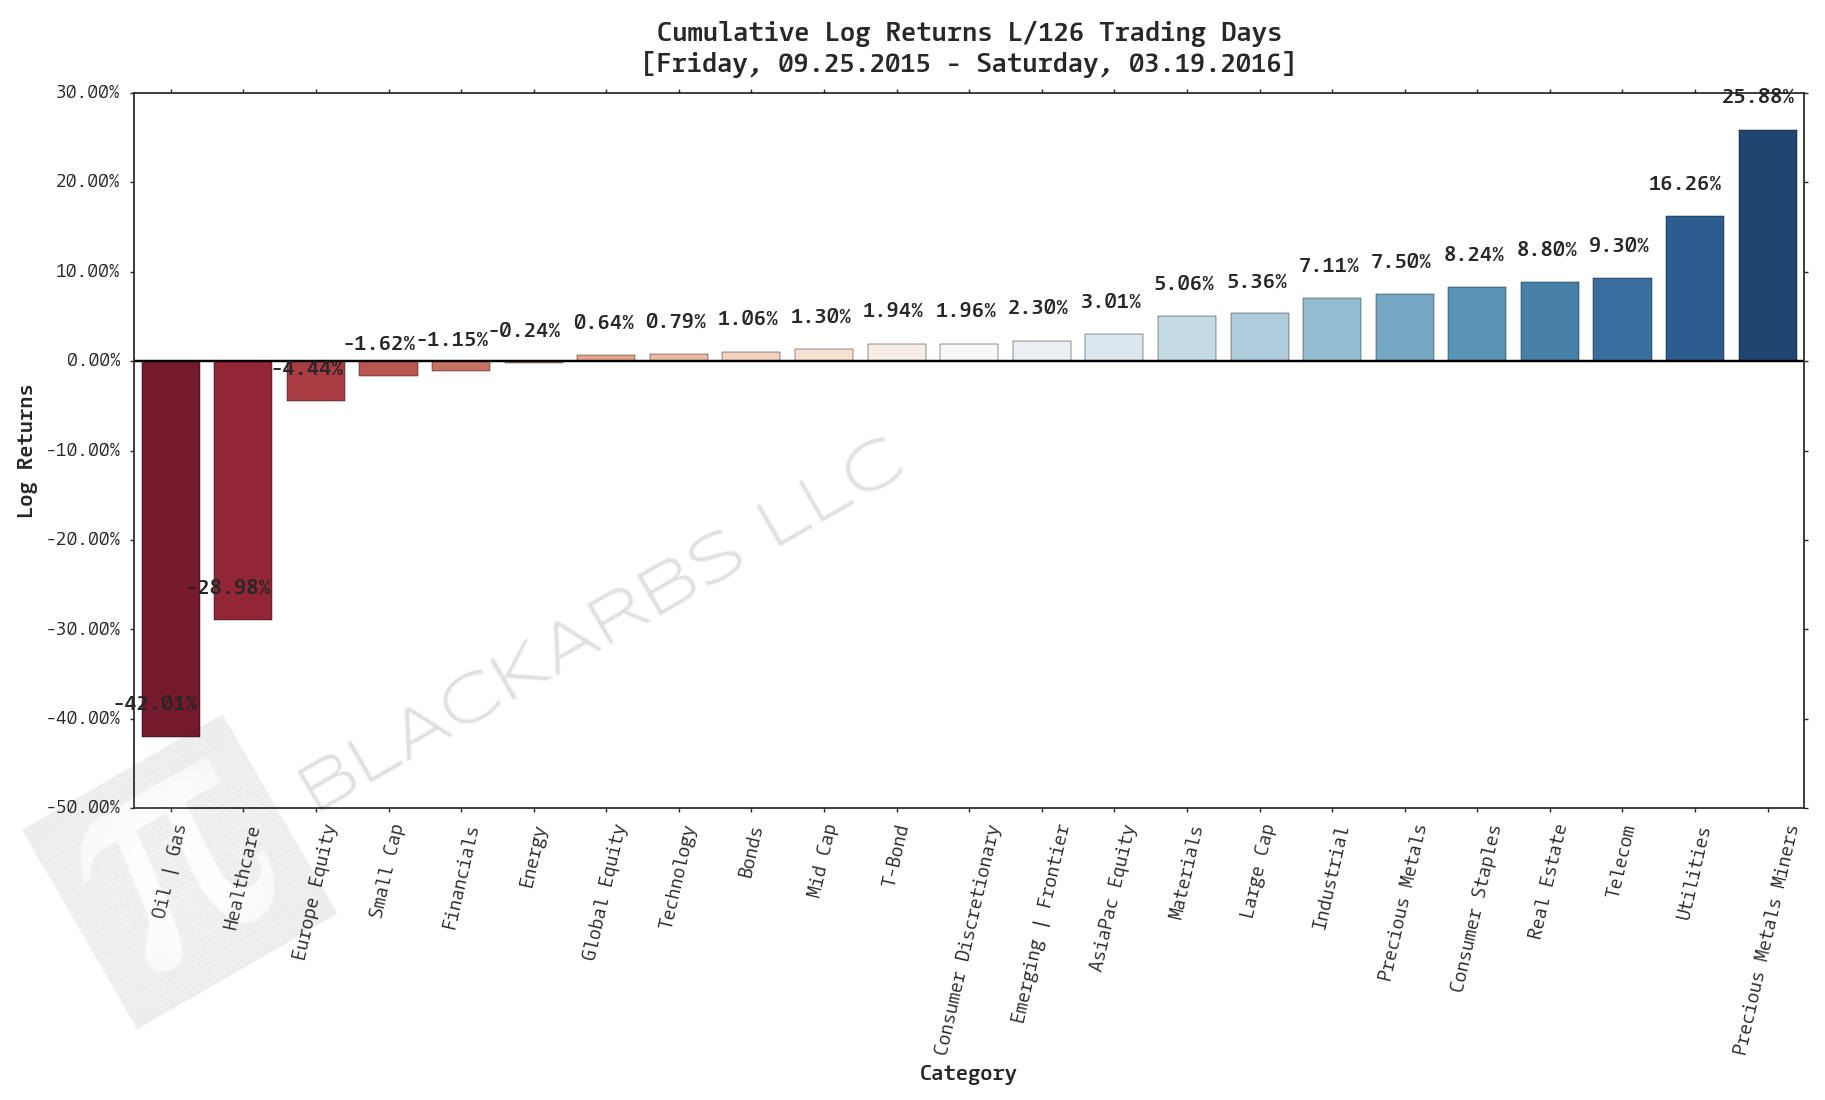
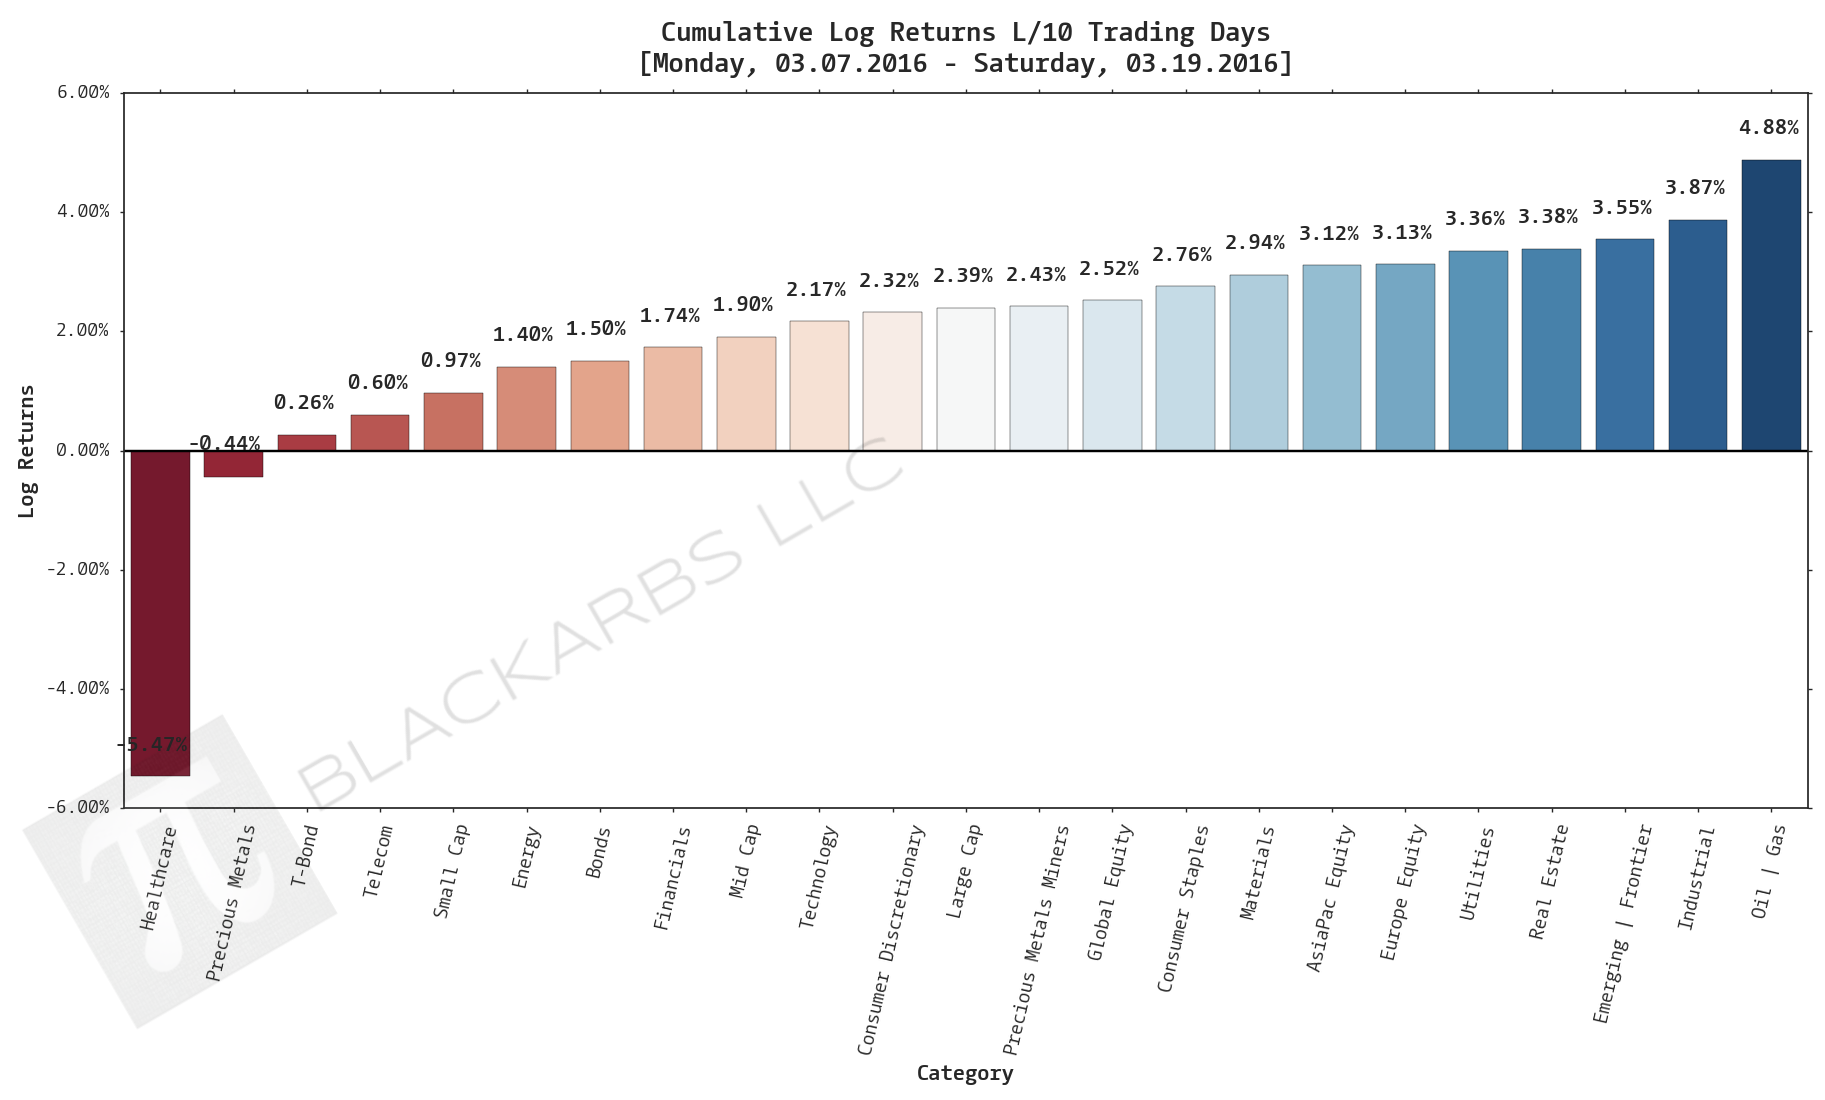
Composite ETF Cumulative Returns Momentum Bar plot
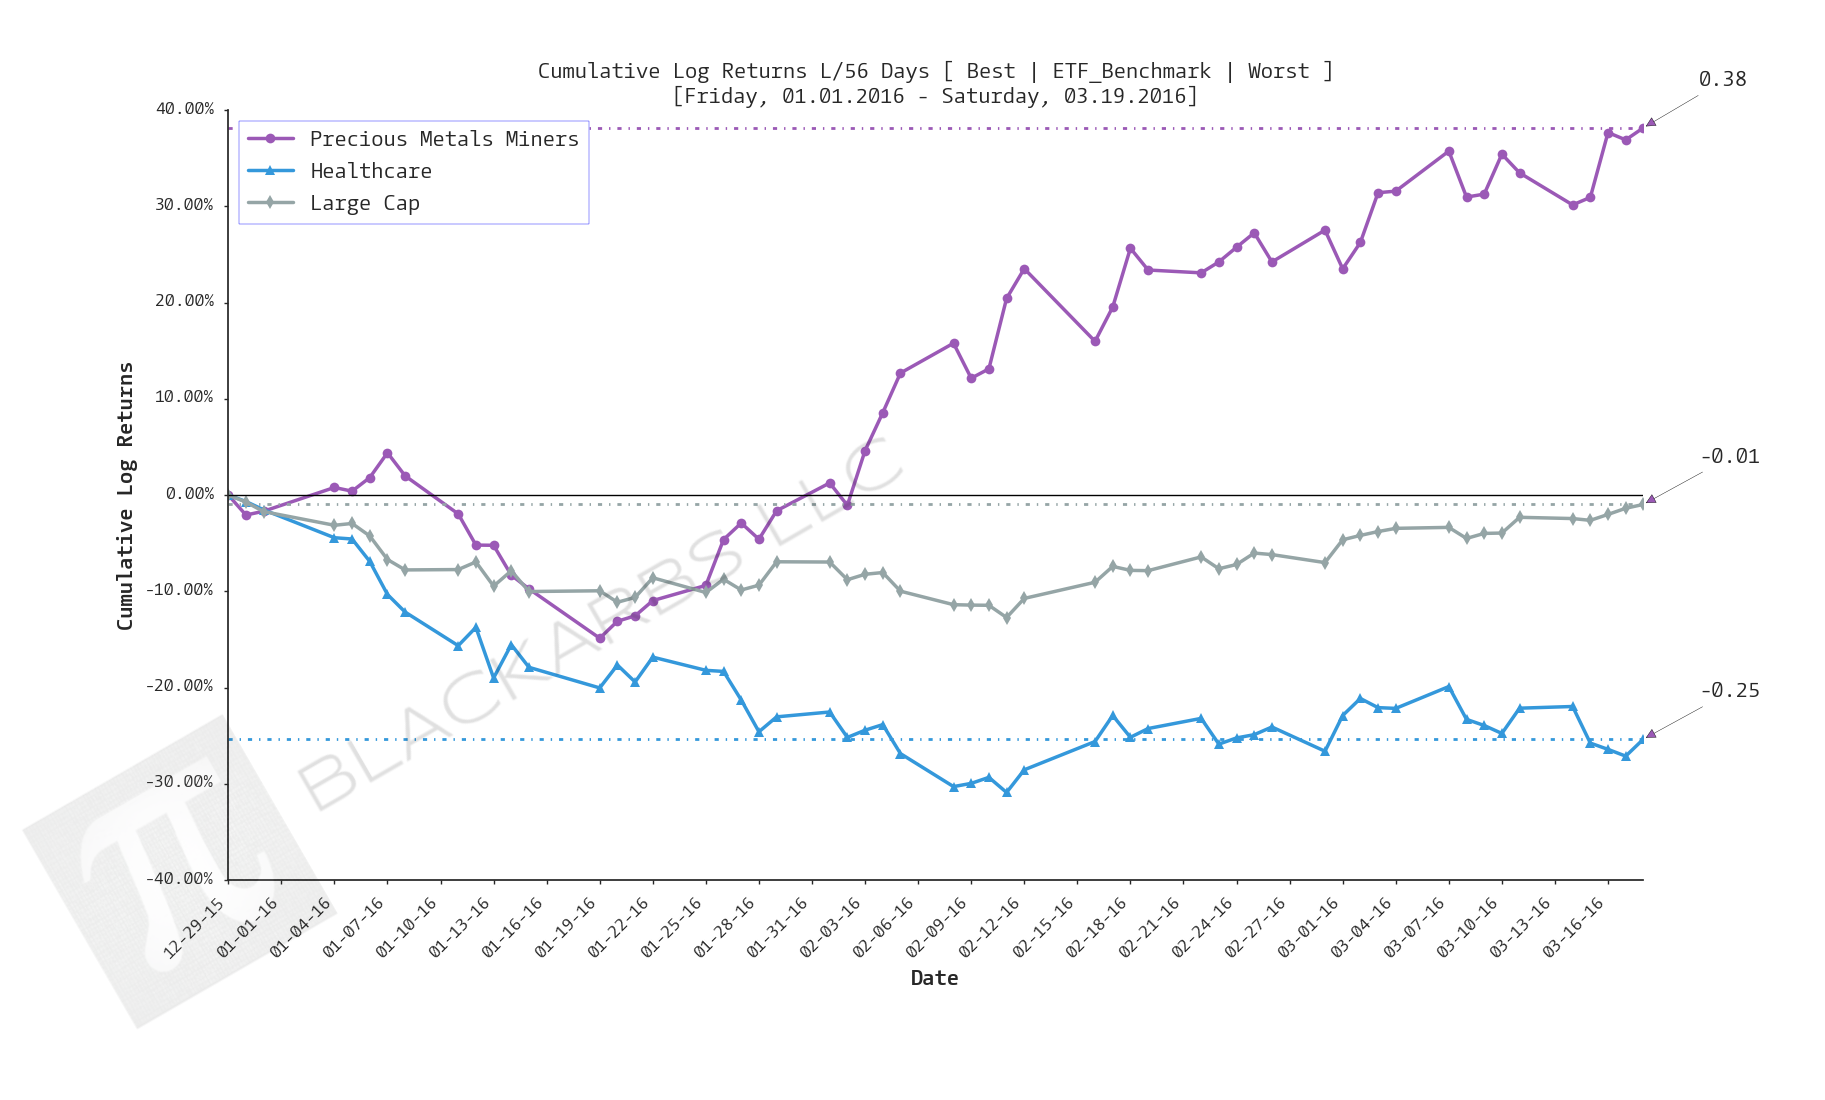
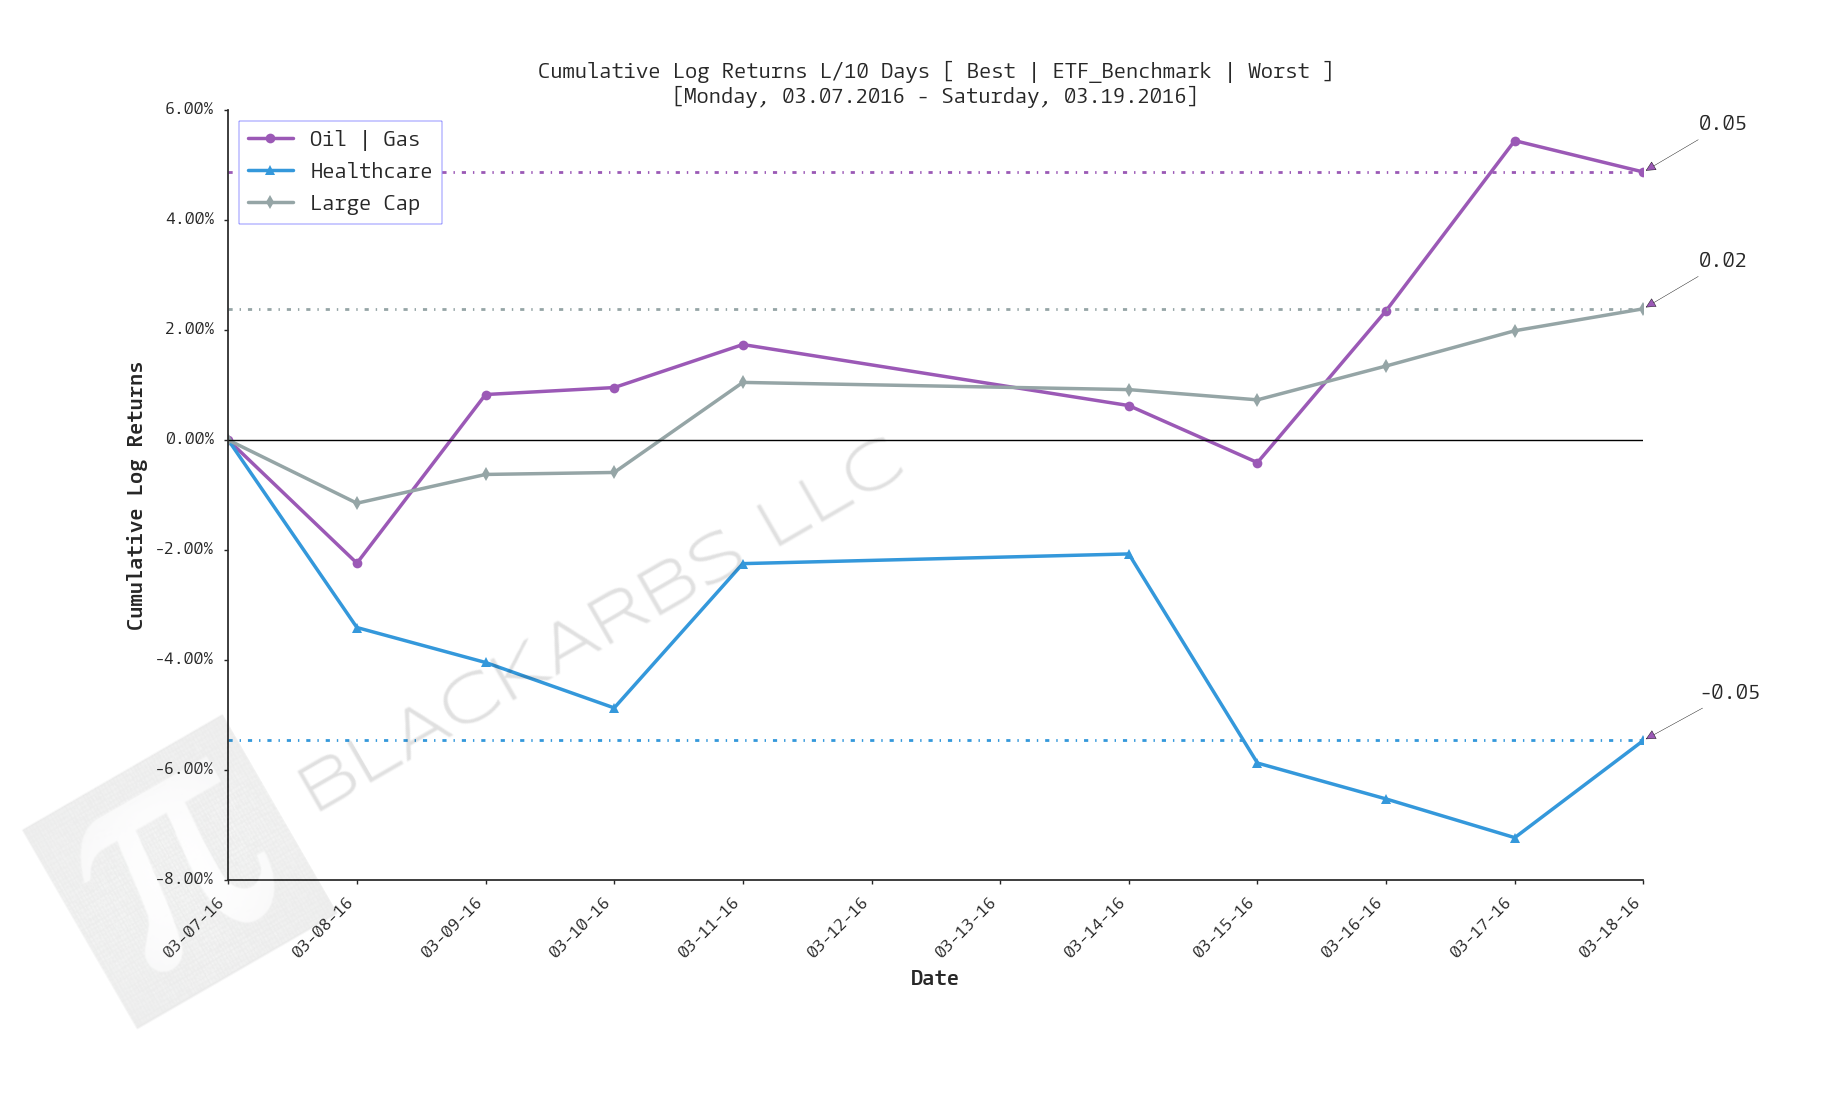
Composite ETF Cumulative Returns Line plot
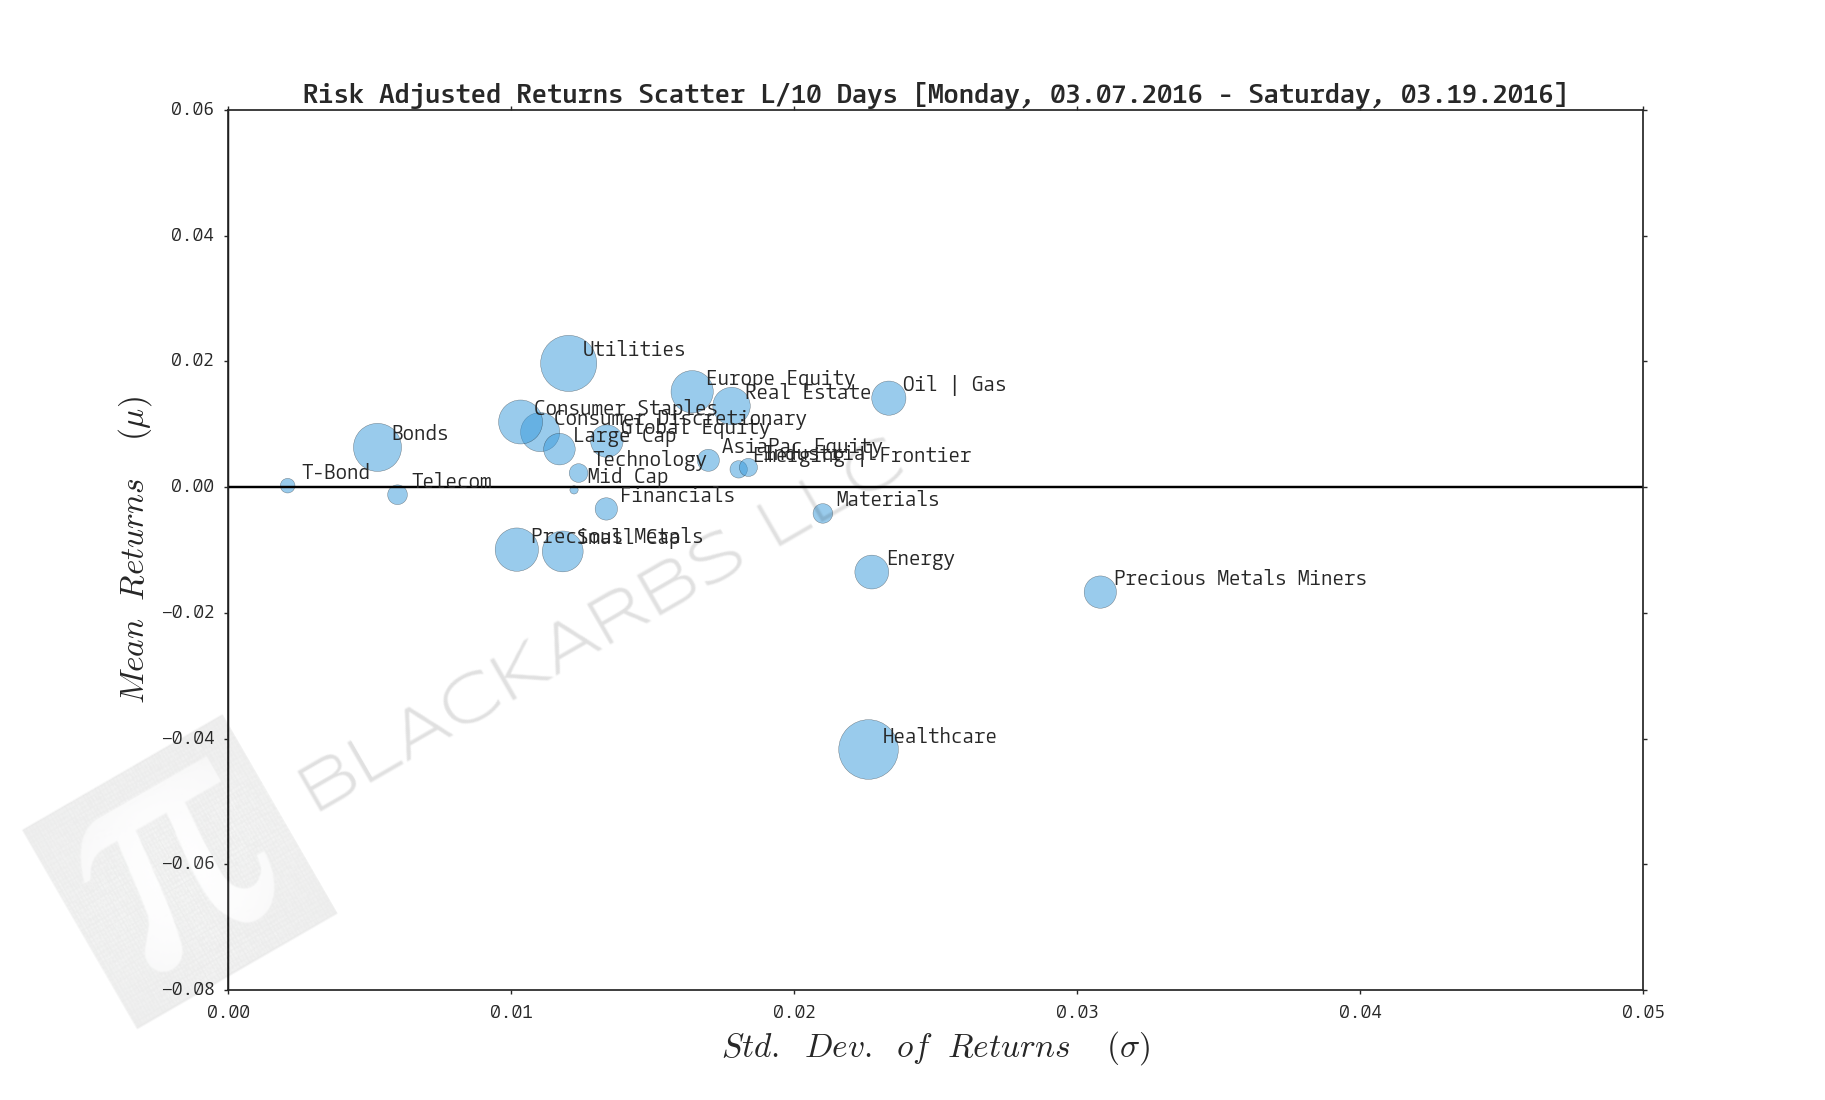
Composite ETF Risk-Adjusted Returns Scatter plot (Std vs Mean)
Composite ETF Risk-Adjusted Return Correlations Heatmap (Clusterplot)
Implied Cost of Capital Estimates
Composite ETF Cumulative Return Tables
Notable Trends and Observations
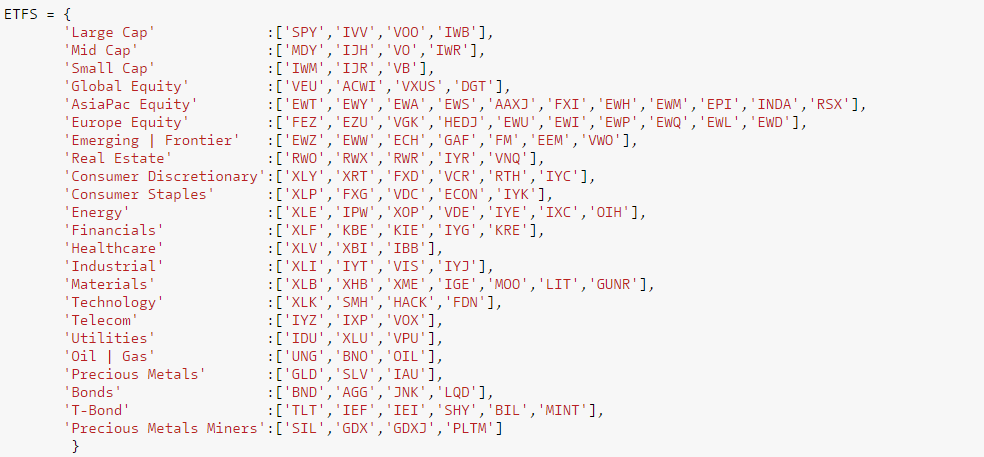
COMPOSITE ETF COMPONENTS:
LAST 252 TRADING DAYS

Click here for help understanding this chart

Click here for help understanding this chart

Click here for help understanding this chart

Click here for help understanding this chart
LAST 126 TRADING DAYS
Click here for help understanding this chart

Click here for help understanding this chart

Click here for help understanding this chart

Click here for help understanding this chart
YEAR-TO-DATE LAST 56 TRADING DAYS

Click here for help understanding this chart
Click here for help understanding this chart

Click here for help understanding this chart

Click here for help understanding this chart
LAST 21 TRADING DAYS

Click here for help understanding this chart

Click here for help understanding this chart

Click here for help understanding this chart

Click here for help understanding this chart
LAST 10 TRADING DAYS
Click here for help understanding this chart
Click here for help understanding this chart
Click here for help understanding this chart

Click here for help understanding this chart
Implied Cost of Capital Estimates:
To learn more about the Implied Cost of Capital see here.
CATEGORY AVERAGE ICC ESTIMATES
ALL ETF ICC ESTIMATES BY CATEGORY
Cumulative Return Tables:
Notable Observations and Trends:
- Last 252 days the only Composites with positive returns are the "defensive" sectors: Utilities, Consumer Staples, Telecom, Precious Metals, and Treasuries
- Last 252 days all Composites have negative rolling risk adjusted returns as shown in the Scatterplot.
- There are still concerns that Energy and Oil + Gas showing strong performance over the last 10 and 21 days is simply short covering and momentum traders. Fundamentally that question will be answered by tracking Oil inventories vs production.
- Are the AsiaPacific and Emerging/Frontier composites finally being repriced to the upside or are we simply in a "risk-on" environment where high beta is being purchased indiscriminately? This is something to pay attention to as the Implied Cost of Capital estimates show these two composites have the highest implied returns (most undervalued) over the next year.