LAYOUT (Organized by Time Period):
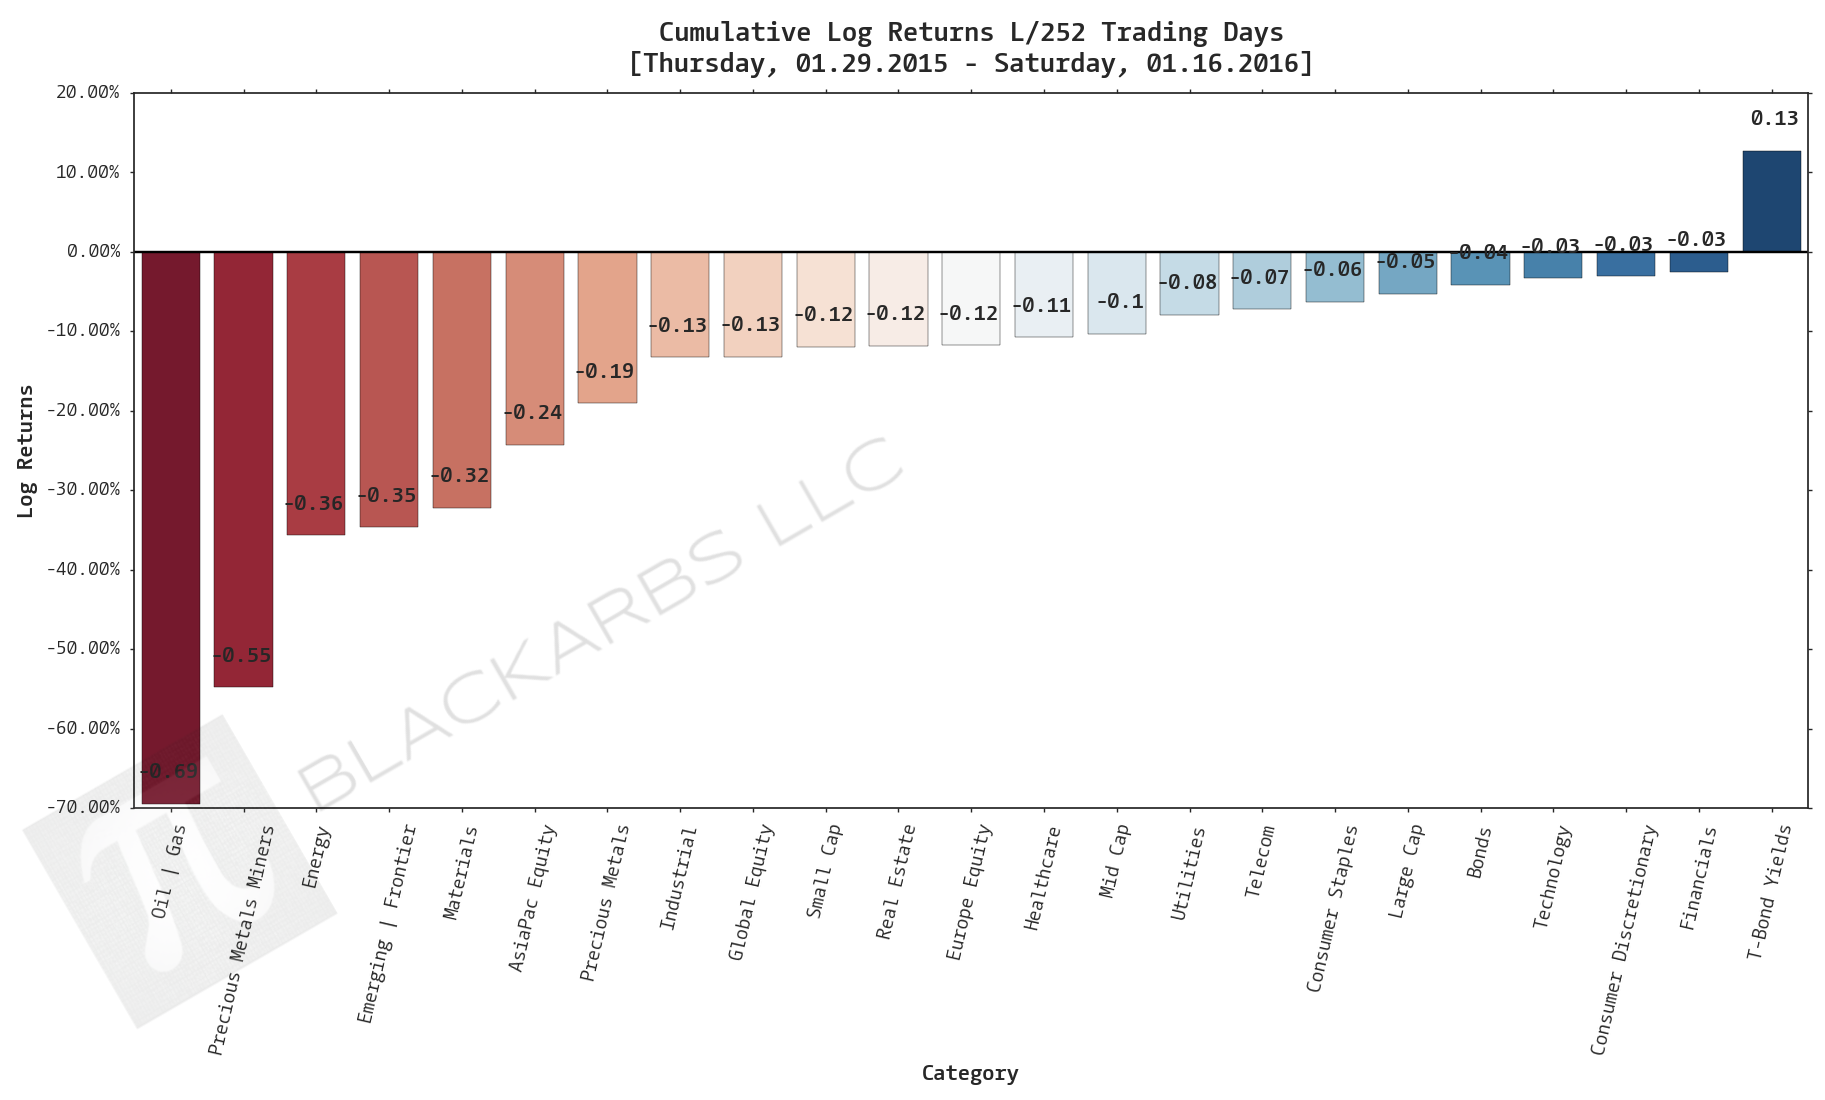
Composite ETF Cumulative Returns Momentum Bar plot
Composite ETF Cumulative Returns Line plot
Composite ETF Risk-Adjusted Returns Scatter plot (Std vs Mean)
Composite ETF Risk-Adjusted Return Correlations Heatmap (Clusterplot)
Composite ETF Cumulative Return Tables
Notable Trends and Observations
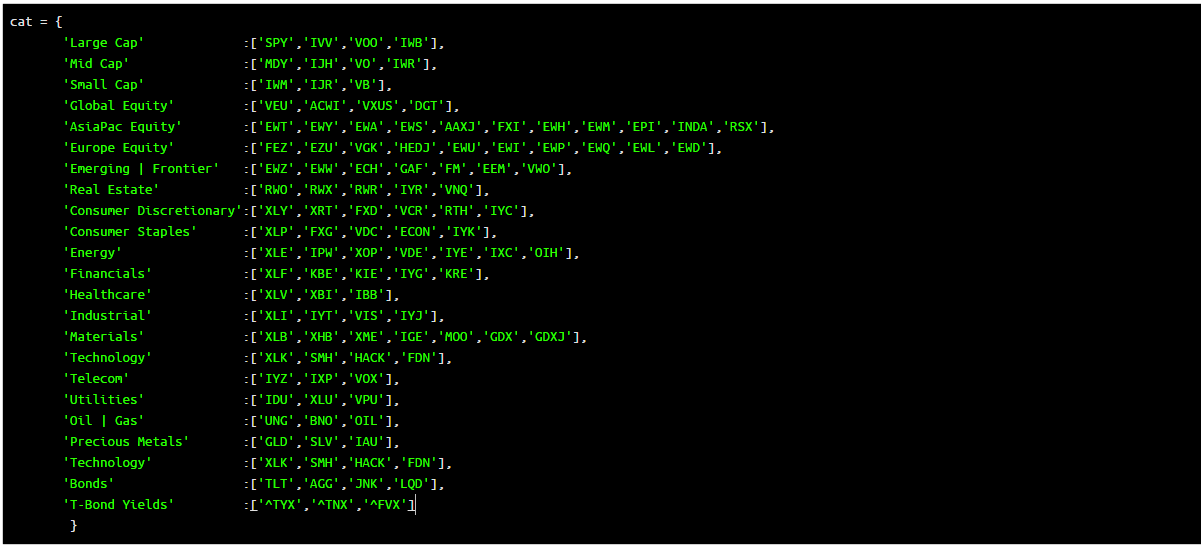
COMPOSITE ETF COMPONENTS:
LAST 252 TRADING DAYS

Click here for help understanding this chart

Click here for help understanding this chart

Click here for help understanding this chart

Click here for help understanding this chart
LAST 126 TRADING DAYS

Click here for help understanding this chart

Click here for help understanding this chart

Click here for help understanding this chart

Click here for help understanding this chart
LAST 63 TRADING DAYS

Click here for help understanding this chart

Click here for help understanding this chart

Click here for help understanding this chart

Click here for help understanding this chart
LAST 21 TRADING DAYS

Click here for help understanding this chart

Click here for help understanding this chart

Click here for help understanding this chart

Click here for help understanding this chart
LAST 10 TRADING DAYS

Click here for help understanding this chart

Click here for help understanding this chart

Click here for help understanding this chart

Click here for help understanding this chart
Cumulative Return Tables:
Notable Observations and Trends:
- Investors have been extremely defensive in recent trading as evidenced by Utilities, Bonds, and Precious Metals making the top 3 performers over the last 21, and 10 day periods.
- Only one composite has had positive cumulative returns over the last 252 days - Treasury Yields. If you're a long investor there have been very few ways to escape the selling outside of moving to cash.
- Flexible investors and traders are making a killing to the short side as selling has been very broad based across sectors.
- We are in a binary risk-on, risk-off phase of investing as evidenced by the increased correlations across sectors and the very high negative correlations of traditional safe havens/crash investments. (Bonds, Precious Metals + Precious Metals Miners)