LAYOUT (Organized by Time Period):
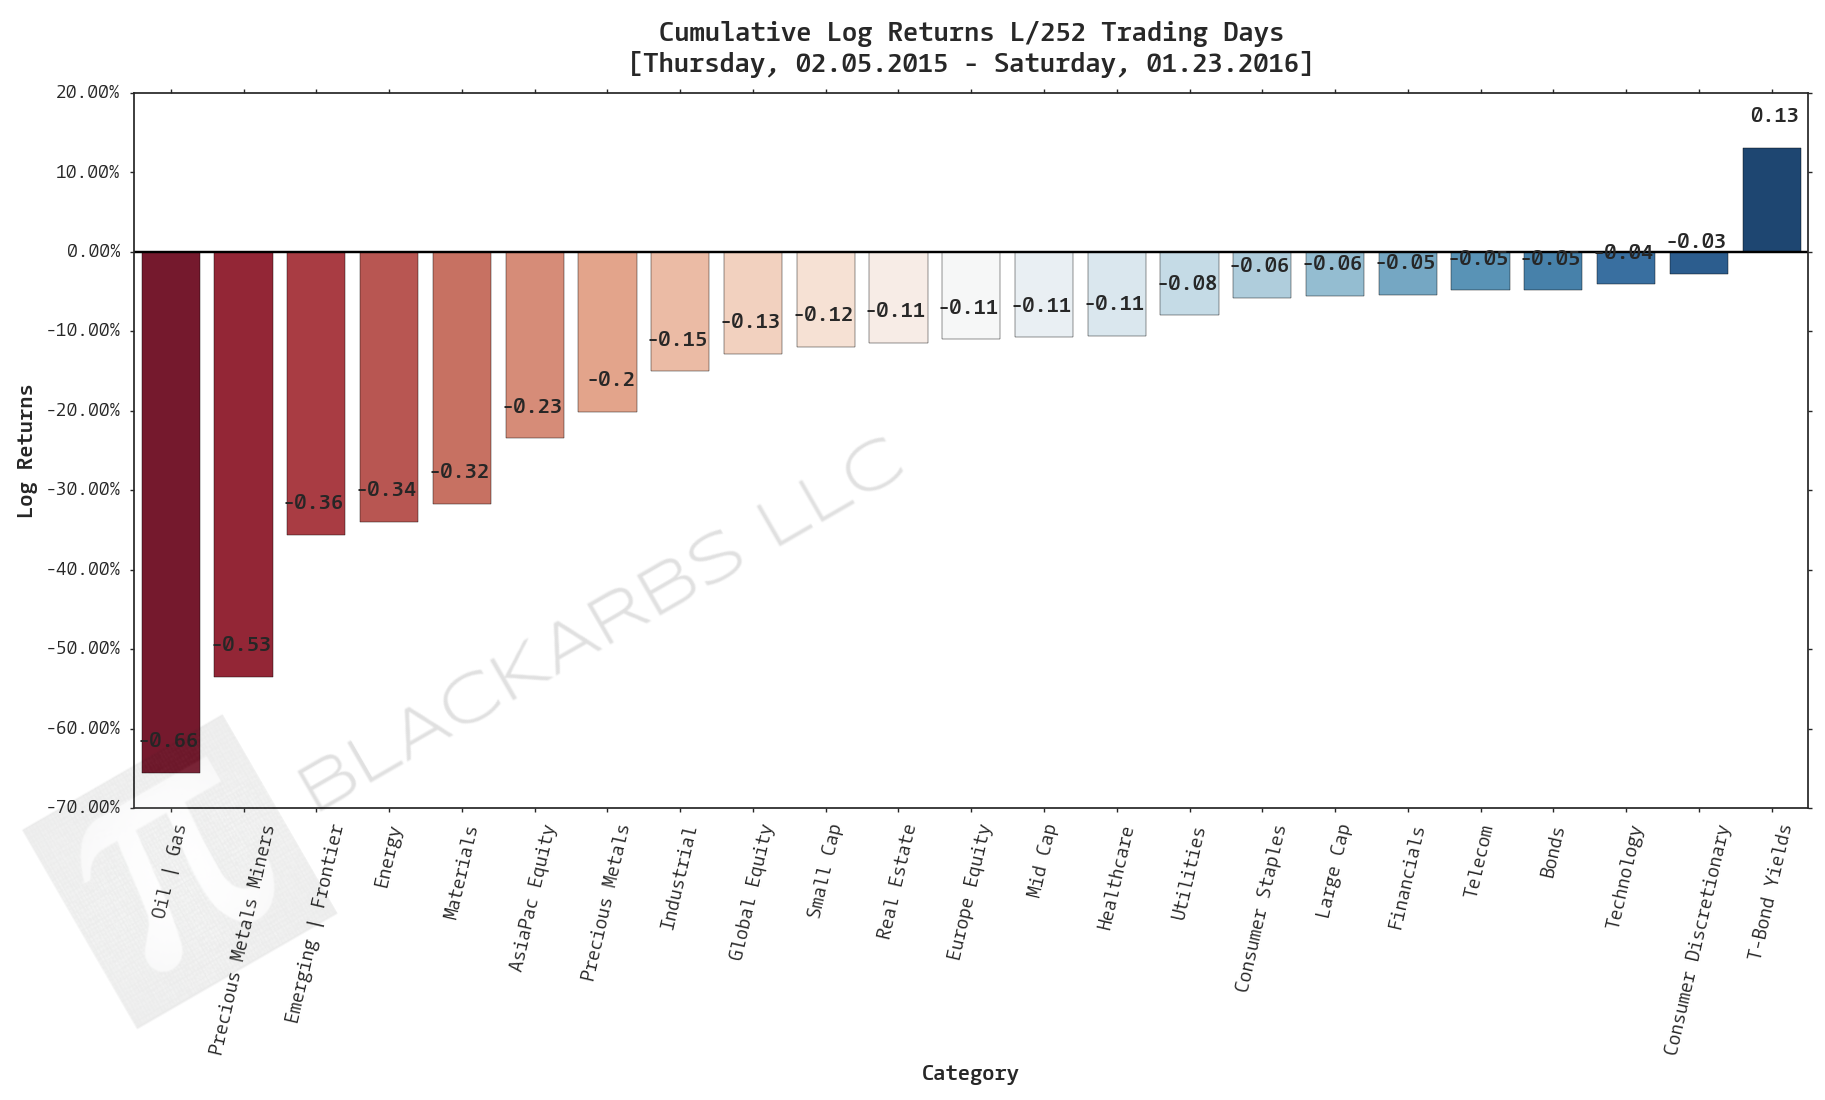
Composite ETF Cumulative Returns Momentum Bar plot
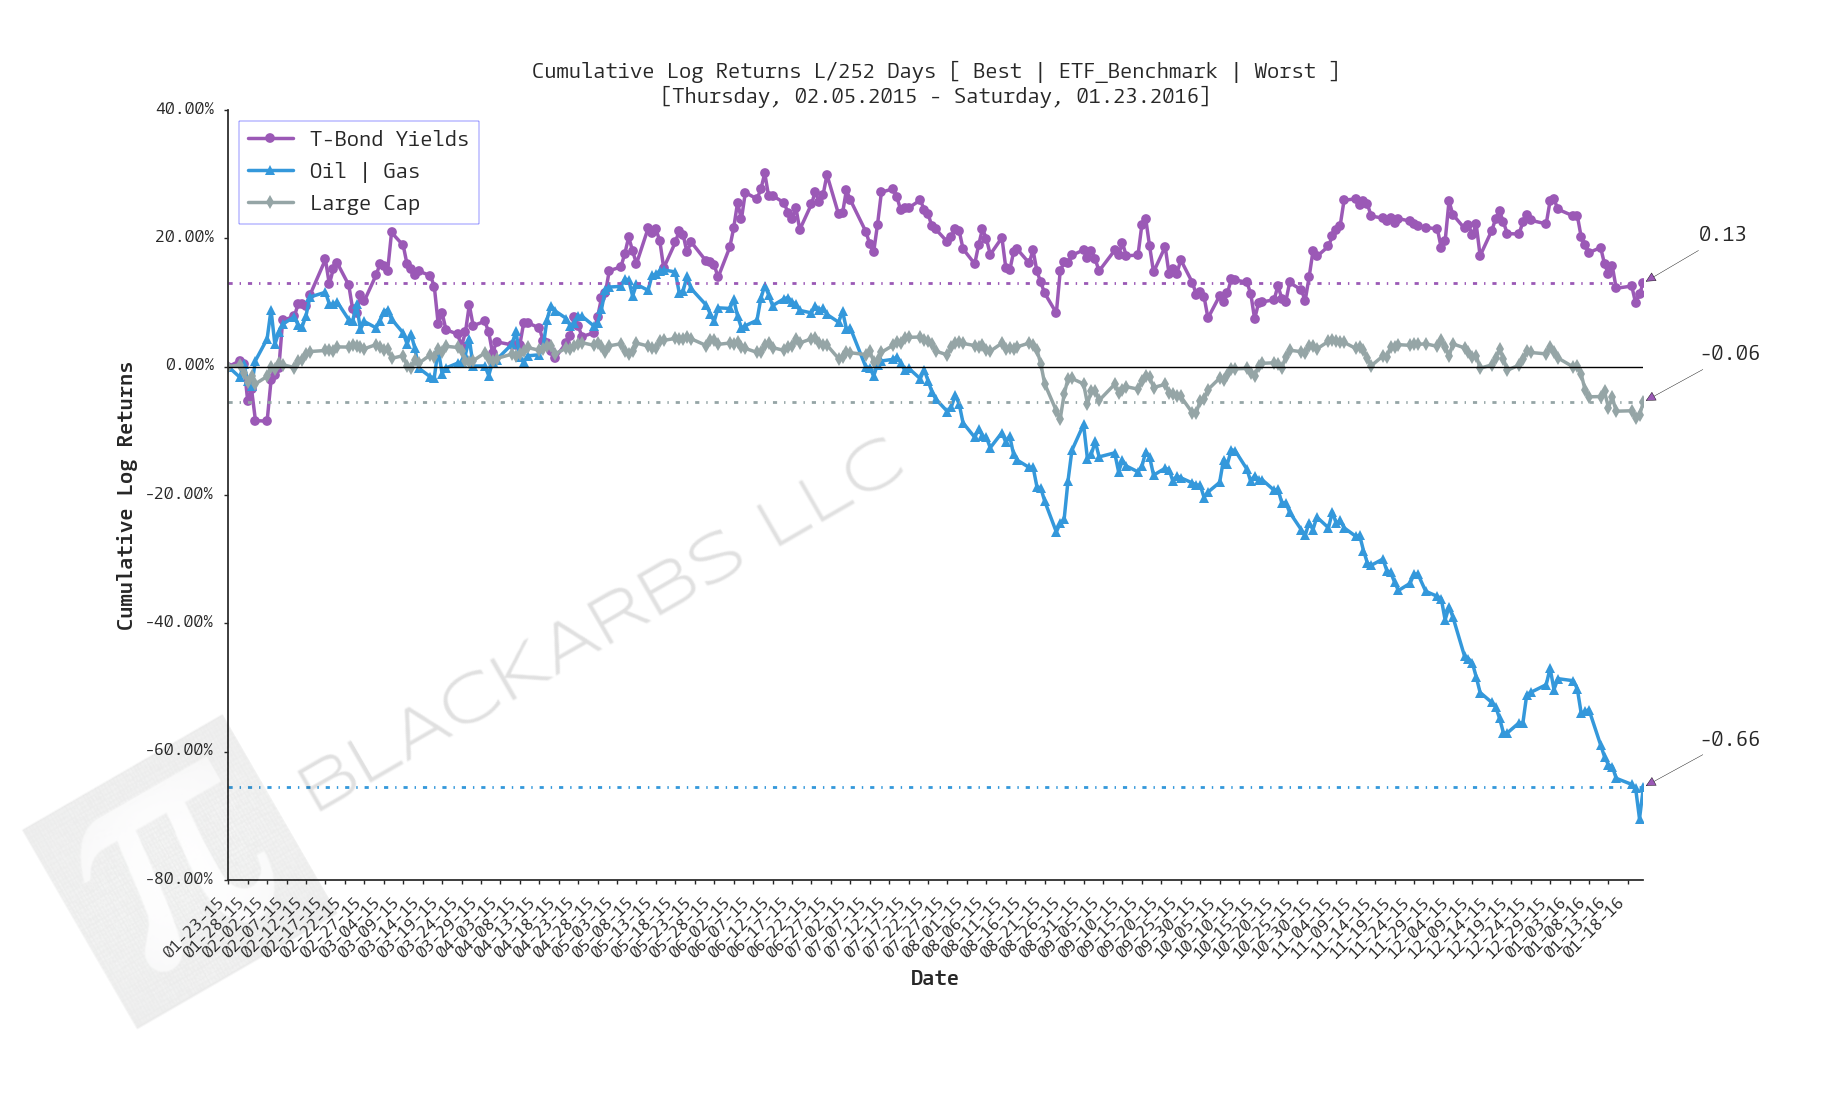
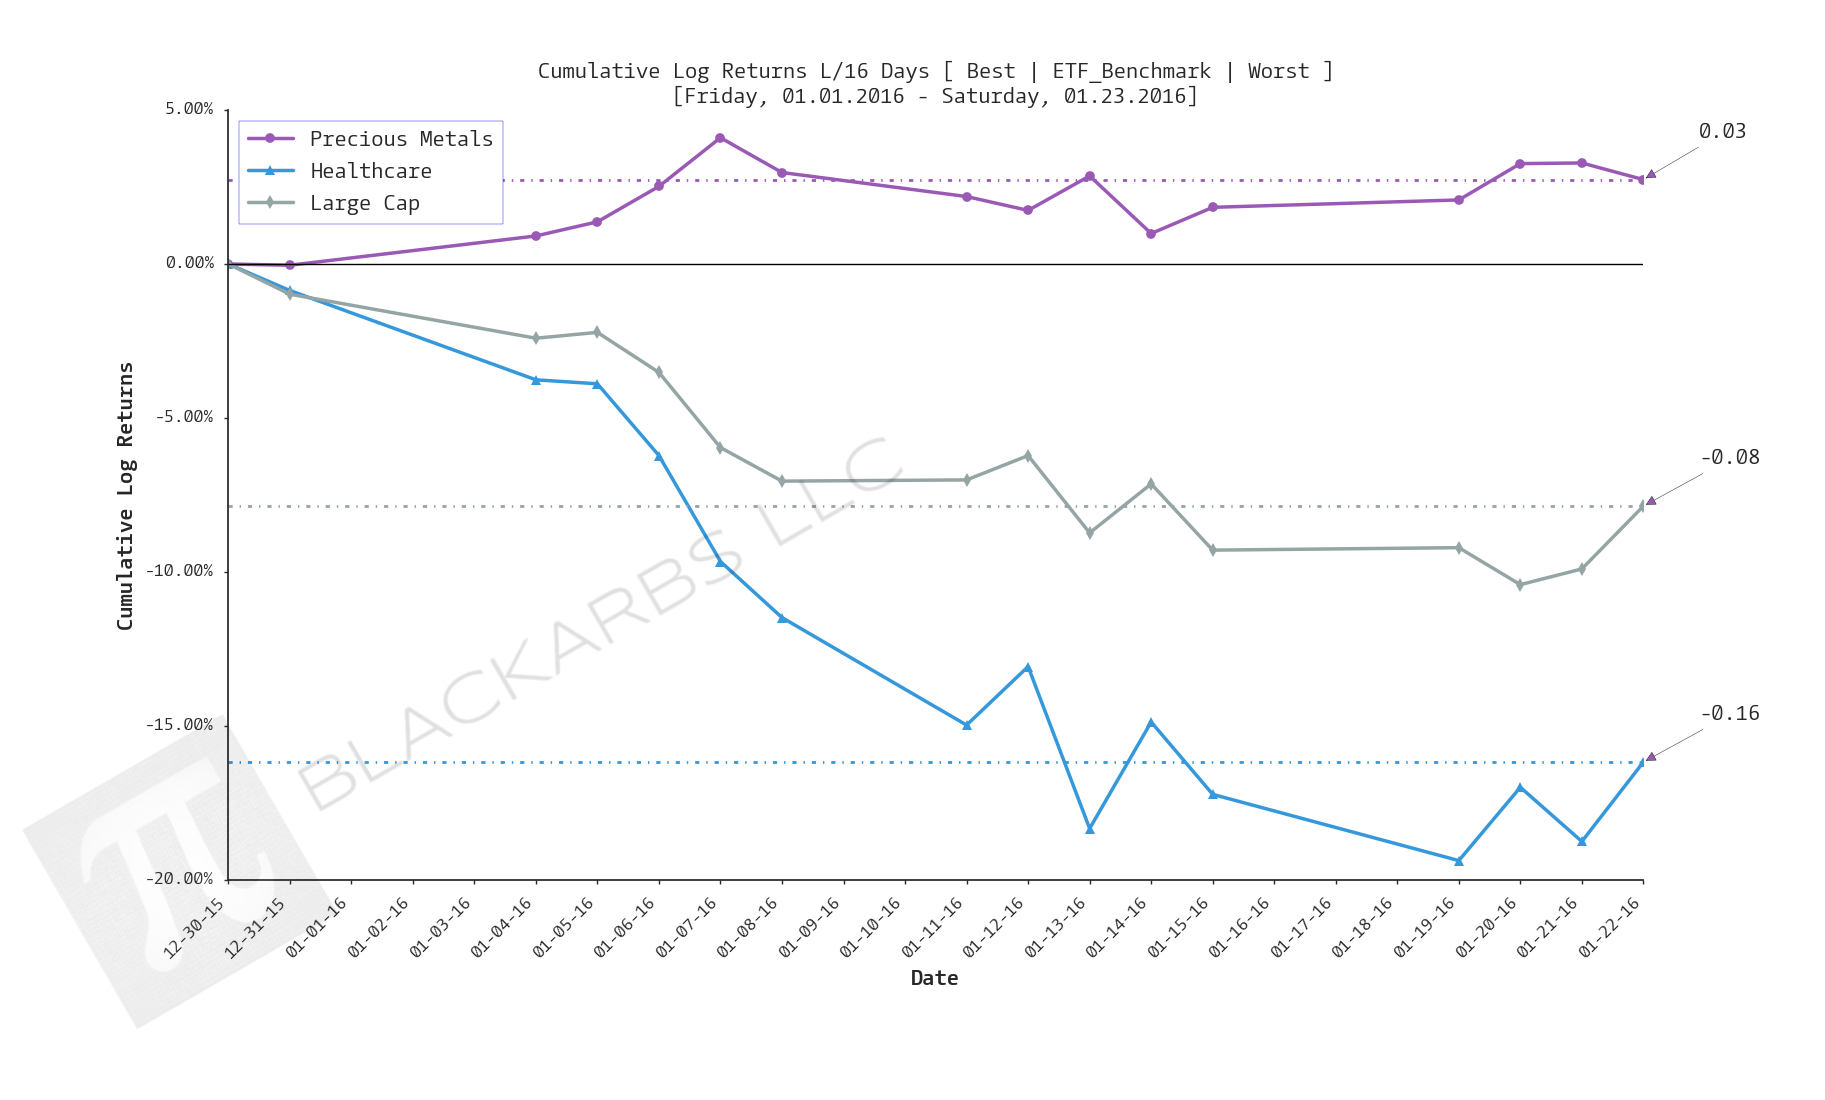
Composite ETF Cumulative Returns Line plot
Composite ETF Risk-Adjusted Returns Scatter plot (Std vs Mean)
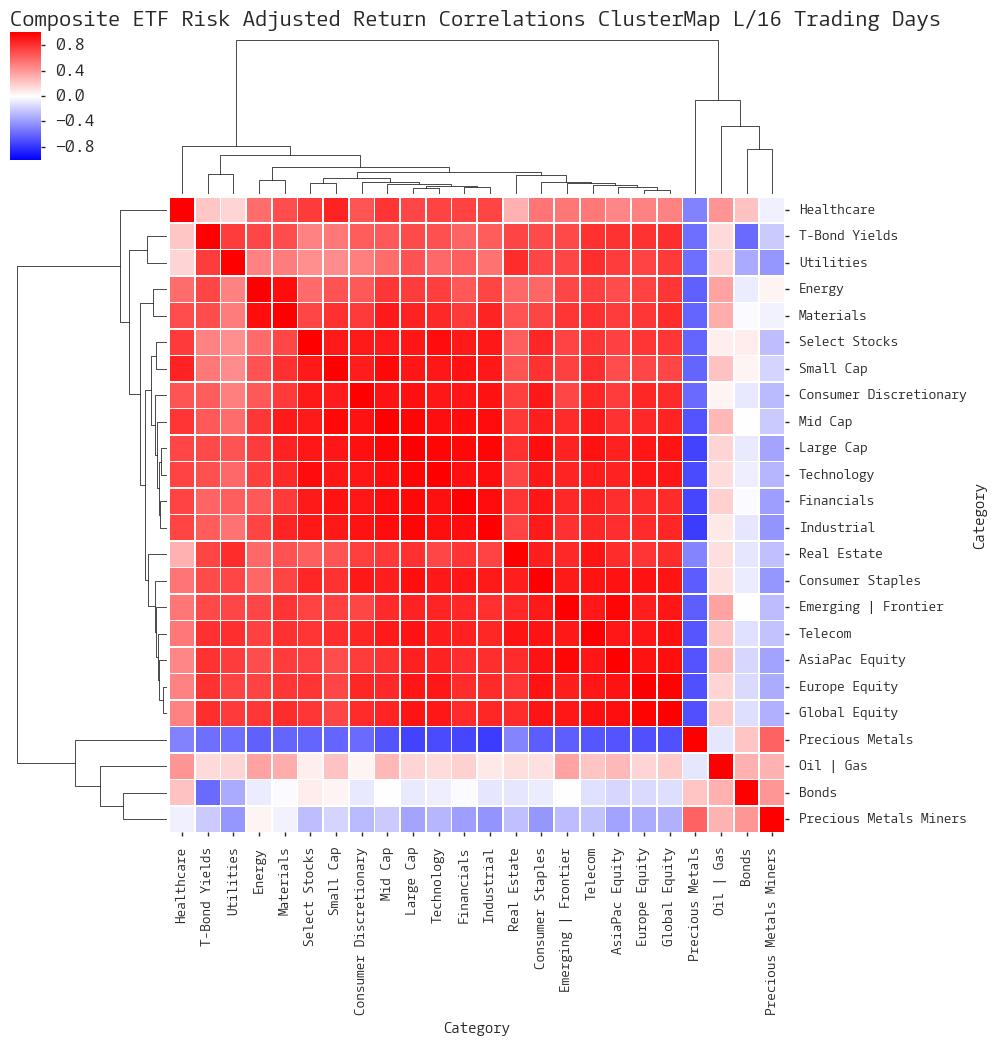
Composite ETF Risk-Adjusted Return Correlations Heatmap (Clusterplot)
Composite ETF Cumulative Return Tables
Notable Trends and Observations
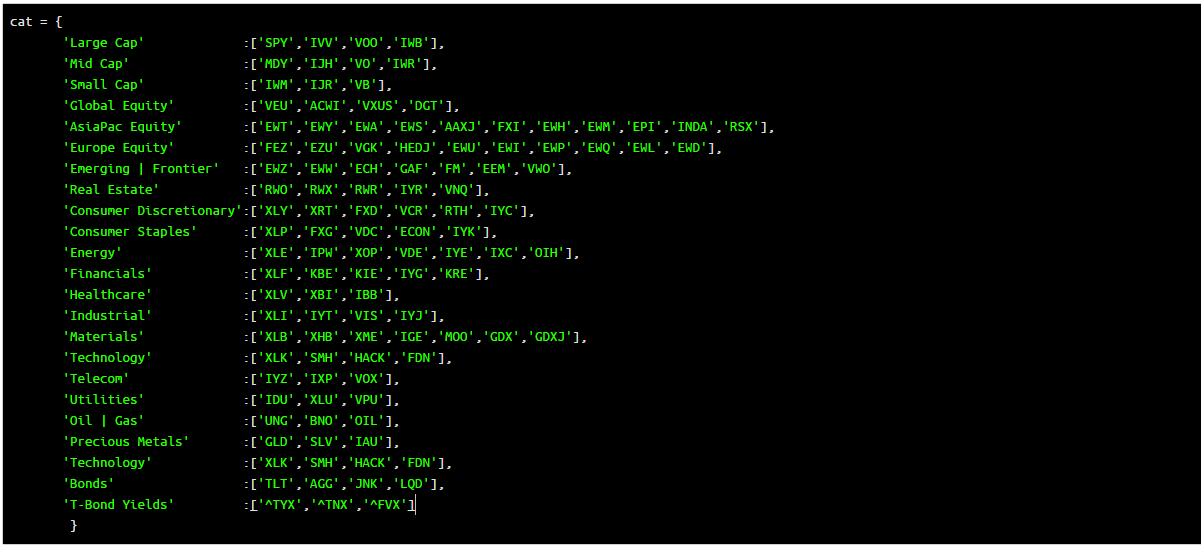
COMPOSITE ETF COMPONENTS:
LAST 252 TRADING DAYS
Click here for help understanding this chart
Click here for help understanding this chart

Click here for help understanding this chart

Click here for help understanding this chart
LAST 126 TRADING DAYS

Click here for help understanding this chart

Click here for help understanding this chart

Click here for help understanding this chart

Click here for help understanding this chart
LAST 63 TRADING DAYS

Click here for help understanding this chart

Click here for help understanding this chart

Click here for help understanding this chart

Click here for help understanding this chart
YTD LAST 16 TRADING DAYS

Click here for help understanding this chart
Click here for help understanding this chart

Click here for help understanding this chart

Click here for help understanding this chart
LAST 10 TRADING DAYS

Click here for help understanding this chart

Click here for help understanding this chart

Click here for help understanding this chart

Click here for help understanding this chart
Cumulative Return Tables:
Notable Observations and Trends:
- Of the top 3 performers in each time frame at least one composite had negative performance.
- Precious Metals Minors losing ~13% over the last 10 days is indicative of a near term bottom as Miners and Precious Metals had been showing relative strength during the recent selloff.
- Precious Metals have been the only composite providing negatively correlated returns (diversification).
- The Oil + Gas composite has been a bottom 3 performer across all time frames and has been the most consistent short across the last 252 trading days.