LAYOUT (Organized by Time Period):
Composite ETF Cumulative Returns Momentum Bar plot
Composite ETF Cumulative Returns Line plot
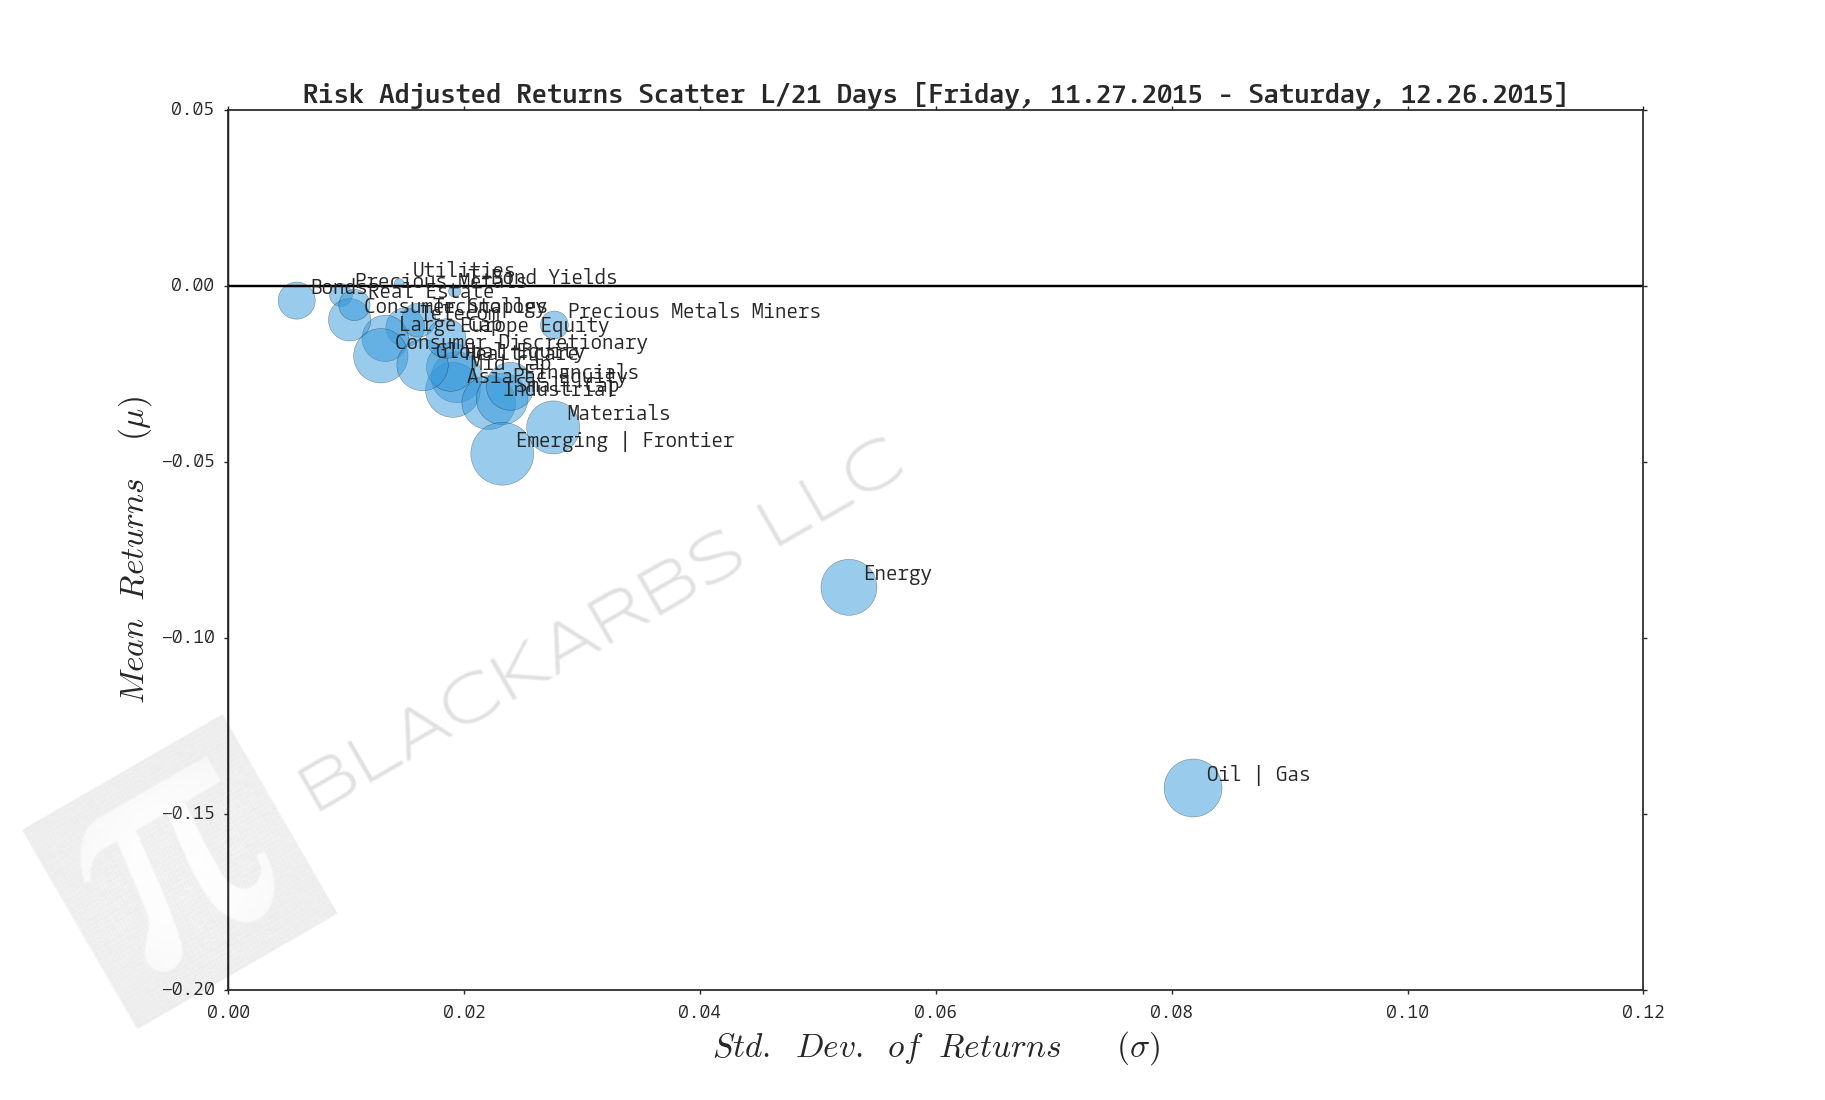
Composite ETF Risk-Adjusted Returns Scatter plot (Std vs Mean)
Composite ETF Risk-Adjusted Return Correlations Heatmap (Clusterplot)
Composite ETF Cumulative Return Tables
Notable Trends and Observations
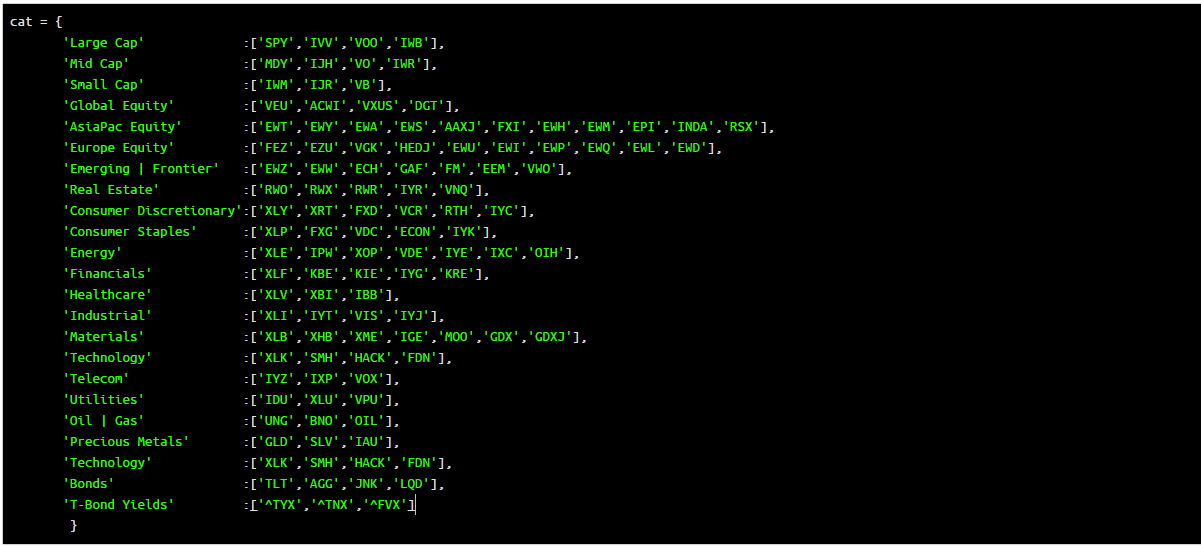
COMPOSITE ETF COMPONENTS:
LAST 252 TRADING DAYS

Click here for help understanding this chart

Click here for help understanding this chart

Click here for help understanding this chart

Click here for help understanding this chart
LAST 126 TRADING DAYS

Click here for help understanding this chart

Click here for help understanding this chart

Click here for help understanding this chart

Click here for help understanding this chart
LAST 63 TRADING DAYS

Click here for help understanding this chart

Click here for help understanding this chart

Click here for help understanding this chart

Click here for help understanding this chart
LAST 21 TRADING DAYS

Click here for help understanding this chart

Click here for help understanding this chart

Click here for help understanding this chart
LAST 10 TRADING DAYS

Click here for help understanding this chart

Click here for help understanding this chart

Click here for help understanding this chart

Click here for help understanding this chart
Cumulative Return Tables:
Notable Observations and Trends:
- Healthcare has been the strongest composite group this year (+9.96% L/252) and has recently shown positive momentum over the L/10 days gaining +5.74%.
- As noted last week the T-Bond Yield composite continues to gain momentum (top 3 positive returns L/63, L/21 and L/10 Days), indicating an increasing appetite for risk.
- 2 of the worst 3 performers L/10 days, Precious Metals and Oil + Gas, had positive cumulative returns. This is a potential indicator of a relief rally within those composites but more specifically within the Oil + Gas composites. Shorts are likely locking in gains and investors are harvesting losses given the continued double digit declines in Oil + Gas in all time frames greater than 10 days.
- AsiaPac Equity surging +5.29% could be a trend to lookout for. In my weekly Implied Cost of Capital composite ETF valuation analysis, has consistently estimated AsiaPac Equity as the composite with the highest future implied returns baked into the price.