LAYOUT (Organized by Time Period):
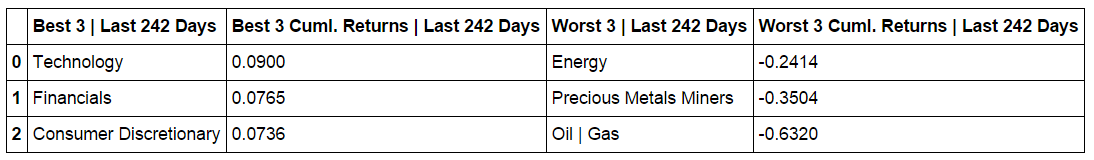
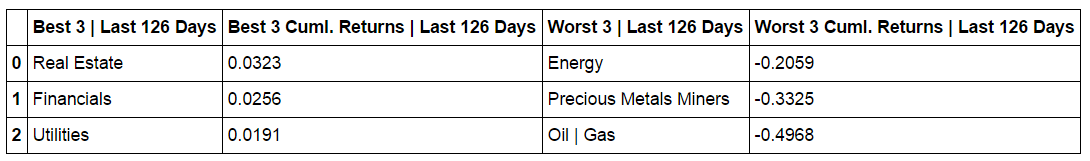
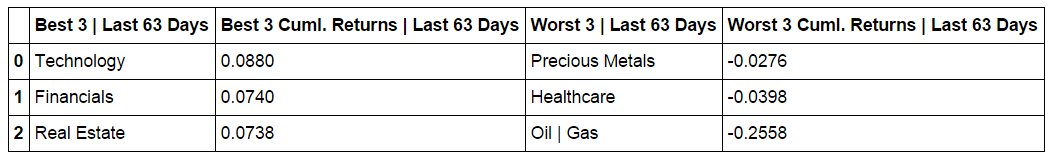
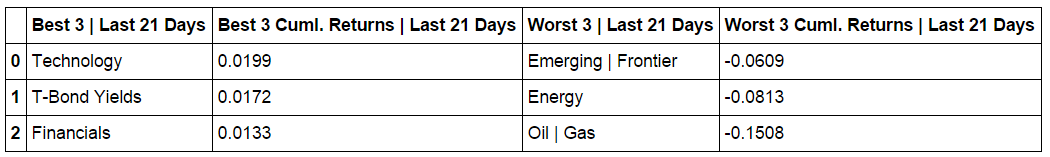
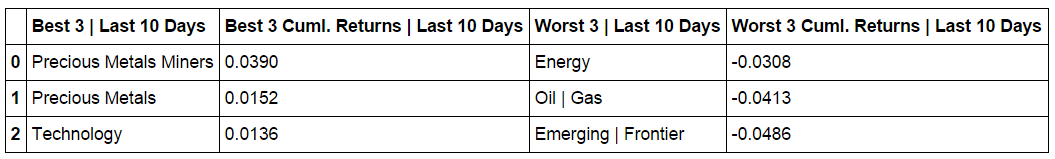
Composite ETF Cumulative Returns Momentum Bar plot and associated Tables
Composite ETF Cumulative Returns Line plot
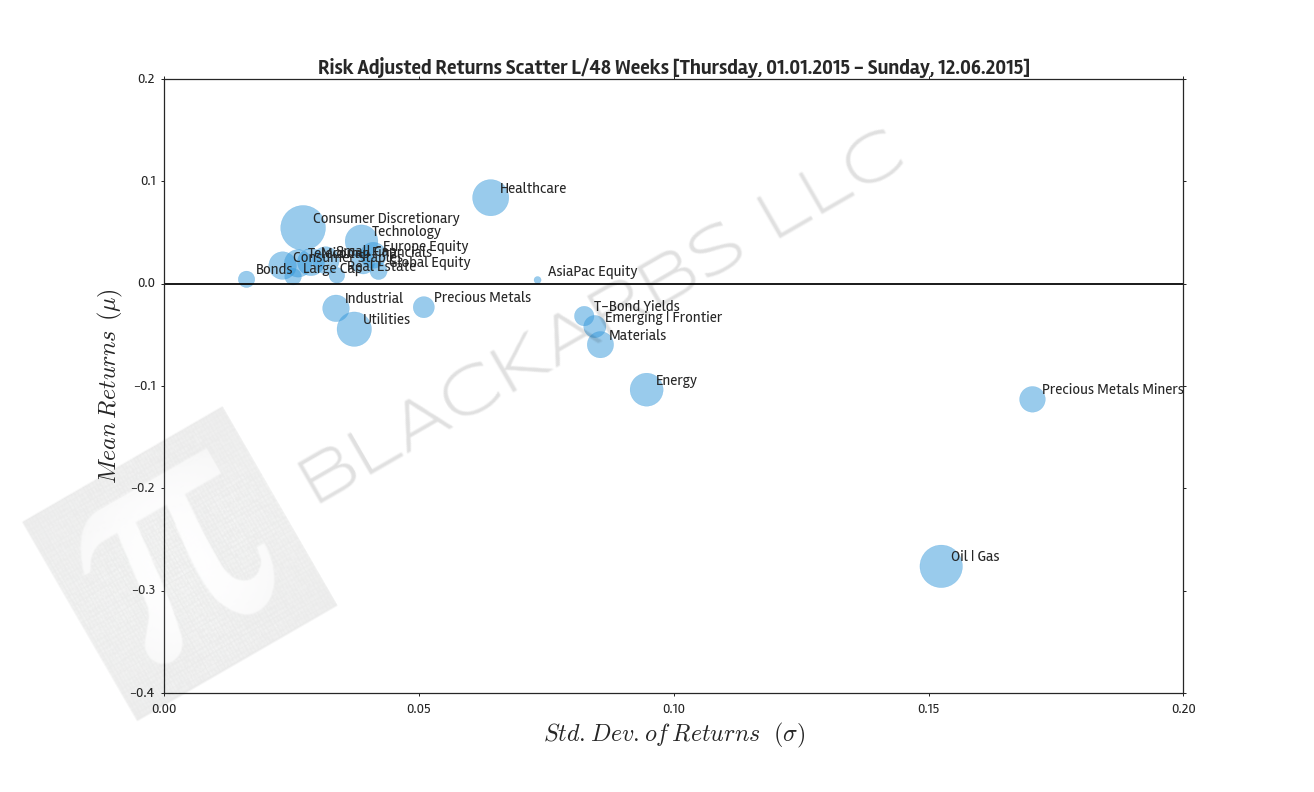
Composite ETF Risk-Adjusted Returns Scatter plot (Std vs Mean)
Composite ETF Risk-Adjusted Return Correlations Heatmap (Clusterplot)
COMPOSITE ETF COMPONENTS:

YEAR-TO-DATE LAST 242 TRADING DAYS

Click here for help understanding this Chart

Click here for help understanding this Chart

Click here for help understanding this Chart

Click here for help understanding this Chart
LAST 126 TRADING DAYS

Click here for help understanding this Chart

Click here for help understanding this Chart

Click here for help understanding this Chart

Click here for help understanding this Chart
LAST 63 TRADING DAYS

Click here for help understanding this Chart

Click here for help understanding this Chart

Click here for help understanding this Chart

Click here for help understanding this Chart
LAST 21 TRADING DAYS

Click here for help understanding this Chart

Click here for help understanding this Chart

Click here for help understanding this Chart

Click here for help understanding this Chart
LAST 10 TRADING DAYS

Click here for help understanding this Chart

Click here for help understanding this Chart

Click here for help understanding this Chart

Click here for help understanding this Chart Blog RSS