COMPOSITE MACRO ETF WEEKLY ANALYTICS (4/30/2016)

FOR A DEEPER DIVE INTO ETF PERFORMANCE AND RELATIVE VALUE SUBSCRIBE TO THE ETF INTERNAL ANALYTICS PACKAGE HERE
LAYOUT (Organized by Time Period):
Composite ETF Cumulative Returns Momentum Bar plot
Composite ETF Cumulative Returns Line plot (best vs worst vs benchmark)
Composite ETF Risk-Adjusted Returns Scatter plot (Std vs Mean)
Composite ETF Risk-Adjusted Return Correlations Heatmap (Clusterplot)
Implied Cost of Capital Estimates
Composite ETF Cumulative Return Tables
Notable Trends and Observations
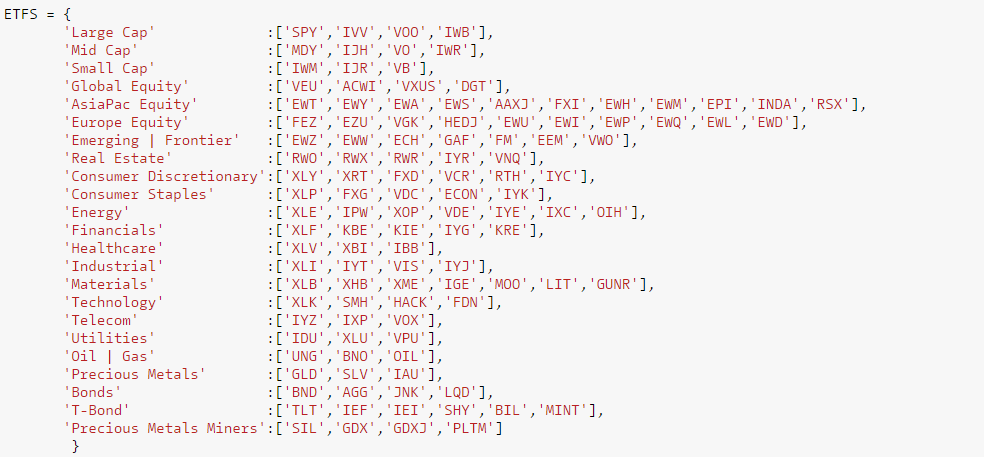
COMPOSITE ETF COMPONENTS:
LAST 252 TRADING DAYS

CLICK HERE FOR HELP UNDERSTANDING THIS CHART

CLICK HERE FOR HELP UNDERSTANDING THIS CHART

CLICK HERE FOR HELP UNDERSTANDING THIS CHART

CLICK HERE FOR HELP UNDERSTANDING THIS CHART
LAST 126 TRADING DAYS

CLICK HERE FOR HELP UNDERSTANDING THIS CHART

CLICK HERE FOR HELP UNDERSTANDING THIS CHART

CLICK HERE FOR HELP UNDERSTANDING THIS CHART

CLICK HERE FOR HELP UNDERSTANDING THIS CHART
LAST 63 TRADING DAYS

CLICK HERE FOR HELP UNDERSTANDING THIS CHART

CLICK HERE FOR HELP UNDERSTANDING THIS CHART

CLICK HERE FOR HELP UNDERSTANDING THIS CHART

CLICK HERE FOR HELP UNDERSTANDING THIS CHART
LAST 21 TRADING DAYS

CLICK HERE FOR HELP UNDERSTANDING THIS CHART

CLICK HERE FOR HELP UNDERSTANDING THIS CHART

CLICK HERE FOR HELP UNDERSTANDING THIS CHART

CLICK HERE FOR HELP UNDERSTANDING THIS CHART
LAST 10 TRADING DAYS

CLICK HERE FOR HELP UNDERSTANDING THIS CHART

CLICK HERE FOR HELP UNDERSTANDING THIS CHART

CLICK HERE FOR HELP UNDERSTANDING THIS CHART

CLICK HERE FOR HELP UNDERSTANDING THIS CHART
Implied Cost of Capital Estimates:
To learn more about the Implied Cost of Capital see here.
ALL ETF ICC ESTIMATES BY CATEGORY
CATEGORY AVERAGE ICC ESTIMATES
CUMULATIVE RETURN TABLES:
NOTABLE OBSERVATIONS AND TRENDS:
- The explosive performance of the Precious Metals Miners (PMM) and Precious Metals (PM) composites this year makes me consider that market participants are expecting "unexpected" inflation.
- The "unexpected" inflation theory is supported by the outperformance of the Oil/Gas and Energy composites over the L/63, L/21, and L/10 trading days.
- Composite performance over the L/63 trading days is intriguing. It is the only time frame in which none of the composites had negative performance.
- I still find it somewhat surprising that the Correlation Clustermap (Dendrogram) shows that T-Bonds, PMM, PM are closely correlated with each other offering diversification vs the other composites from the L/126 days onwards.
Enjoyed this post?
Subscribe for more research and trading insights.
By clicking "Subscribe," you agree to our Terms of Use and acknowledge our Privacy Policy. You can unsubscribe at any time.
No spam. Unsubscribe anytime.