
To see this weekend's prediction click here.
Overall this strategy has been impressive in its trial run over the last 4.5 weeks. I figured, given the volatility and uncertainty in the broad markets this week I'd like to see a mid-week update of the strategy using Python and the BarChart OnDemand API. To see my original article on the basics of using the BarChart OnDemand API click here.
First I import the basic modules needed to execute the script:
From there I define a couple convenience functions. The first is a one off function for querying the BarChart API for singular symbol names. The other is a bulk function to aggregate the portfolio symbol price data into a HDF5 format for easy querying later on. Remember the api key is your api key.
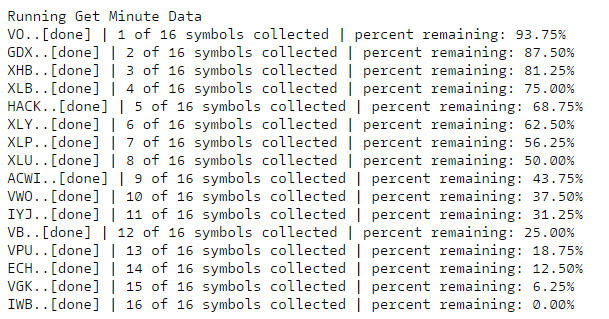
Next I run the function for aggregating the portfolio stocks prices.
After aggregating the data I perform some simple clean up operations along with calculation of the mid-prices for each minute of available data.
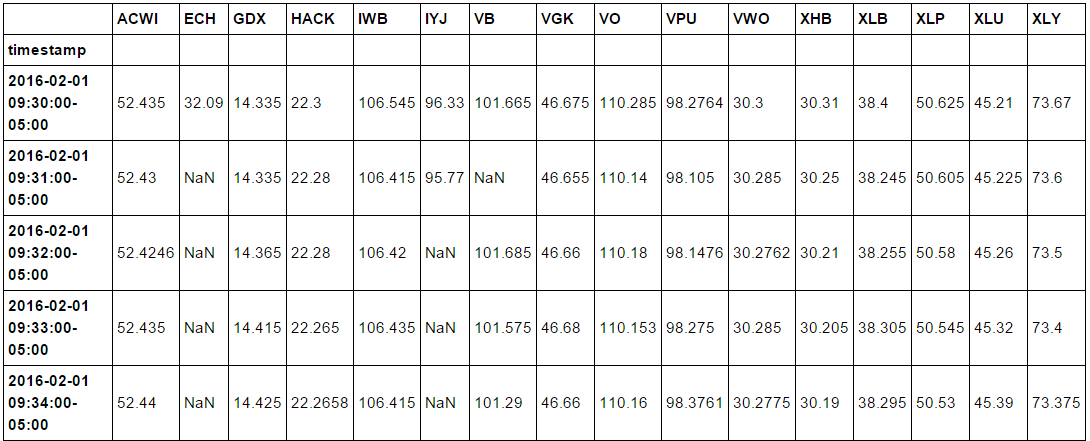
Because each ETF did not record a trade for every minute I perform a forward fill of the previous price before calculating the log returns. Then I calculate the cumulative sum of the the returns for both the long and short legs of the portfolio for comparison.
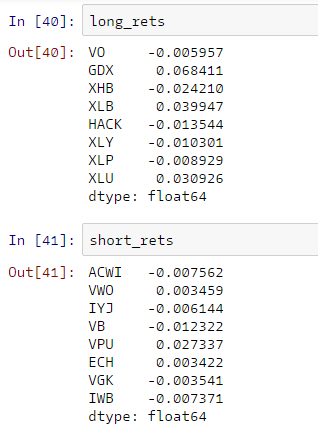
Finally, we arrive at the moment of truth. How has the strategy performed for the first 3 trading sessions of the week?
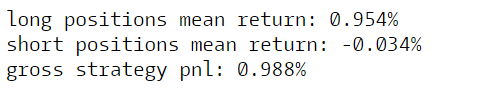
Not bad at all! How does that compare to the US Major Market Averages? I perform almost the same process for the SPY, QQQ, and DIA ETF's except I use the singular BarChart API function defined above. I also calculate the mid-price for each minute of data.
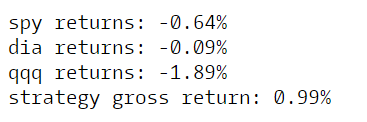
Wow! Not even close.