Blog

Can We Use Mixture Models to Predict Market Bottoms? (Part 3)
PythonQuant

Can We Use Mixture Models to Predict Market Bottoms? (Part 3)

Post Outline * Recap * Webinar Hypothesis * Anaylsis/Conclusions * Jupyter (IPython) Notebook * Github Links and Resources Recap Thus far in the series we've explored the idea of using Gaussian mixture models (GMM) to predict outlier returns. Specifically, we were measuring two things: 1. The accuracy of the strategy implementation in predicting return distributions. 2. The return pattern after an outlier event. During the exploratory phase of this project there were some interestin

READ MORE
Can We Use Mixture Models to Predict Market Bottoms? (Part 2)
PythonResearch

Can We Use Mixture Models to Predict Market Bottoms? (Part 2)

Post Outline * Recap * Model Update * Model Testing * Model Results * Conclusions * Code Recap In the previous post I gave a basic "proof" of concept, where we designed a trading strategy using Sklearn's implementation of Gaussian mixture models. The strategy attempts to predict an asset's return distribution such that returns that fall outside the predicted distribution are considered outliers and likely to mean revert. It showed some promise but had many areas in need of improvement.

READ MORE
Can We Use Mixture Models to Predict Market Bottoms?
EducationPython

Can We Use Mixture Models to Predict Market Bottoms?

Post Outline * Recap * Hypothesis * Strategy * Conclusion * Caveats and Areas of Exploration * References Recap In Part 1 we learned about Hidden Markov Models and their application using a toy example involving a lazy pet dog. In Part 2 we learned about the expectation-maximization algorithm, K-Means, and how Mixture Models improve on K-Means weaknesses. If you still have some questions or fuzzy understanding about these topics, I would recommend reviewing the prior posts. In those po

READ MORE
Intro to Expectation-Maximization, K-Means, Gaussian Mixture Models with Python, Sklearn
PythonQuant

Intro to Expectation-Maximization, K-Means, Gaussian Mixture Models with Python, Sklearn

Post Outline * Part 1 Recap * Part 2 Goals * Jupyter (IPython) Notebook * References part 1 recap In part 1 of this series we got a feel for Markov Models, Hidden Markov Models, and their applications. We went through the process of using a hidden Markov model to solve a toy problem involving a pet dog. We concluded the article by going through a high level quant finance application of Gaussian mixture models to detect historical regimes. part 2 goals In this post, my goal is to impar

READ MORE
Introduction to Hidden Markov Models with Python Networkx and Sklearn
EducationPython

Introduction to Hidden Markov Models with Python Networkx and Sklearn

Post Outline * Who is Andrey Markov? * What is the Markov Property? * What is a Markov Model? * What makes a Markov Model Hidden? * A Hidden Markov Model for Regime Detection * Conclusion * References Who is Andrey Markov? Markov was a Russian mathematician best known for his work on stochastic processes. The focus of his early work was number theory but after 1900 he focused on probability theory, so much so that he taught courses after his official retirement in 1905 until his death

READ MORE
Understanding Hidden Variables with Python - Research Roadmap
PythonQuant

Understanding Hidden Variables with Python - Research Roadmap

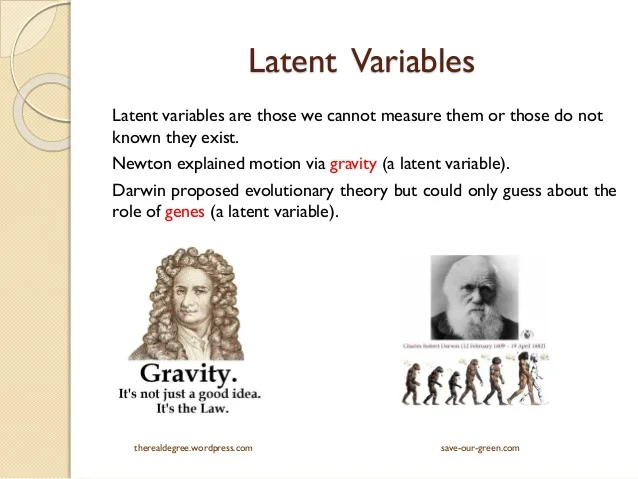
Post Outline * Motivating the Journey * Where Do Edges Come From? * The Problem with Traditional Research * The Hidden Side * A Brief Description: * Part 1 - A Visual Introduction to Hidden Markov Models with Python * Part 2 - Exploring Mixture Models with Scikit-Learn and Python * Part 3 - Predicting Market Bottoms with Scikit-Learn and Python Motivating the Journey Where do Edges Come From? Edges come from superior ability to identify and execute profitable strategies

READ MORE
Advanced Time Series Plots in Python
PythonEducation

Advanced Time Series Plots in Python

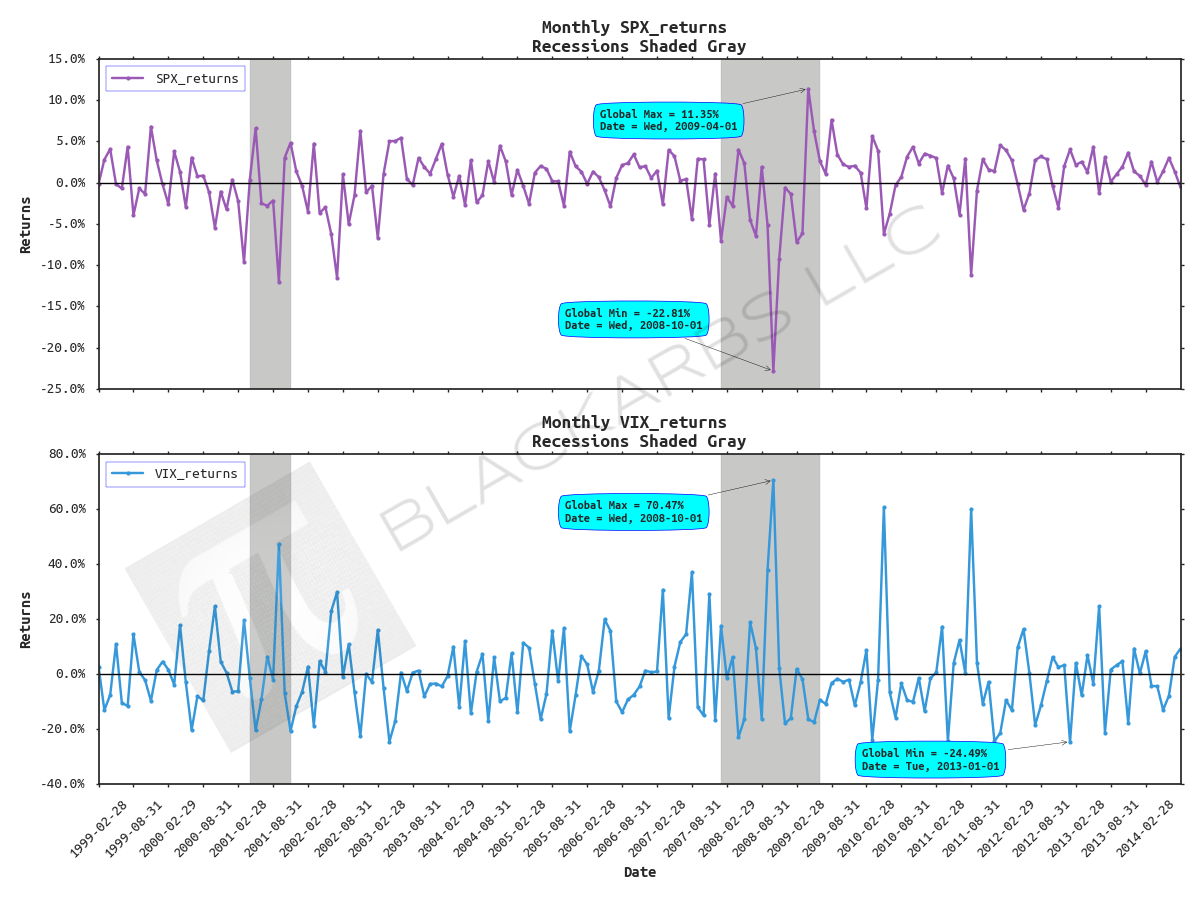
POST OUTLINE 1. Motivation 2. Get Data 3. Default Plot with Recession Shading 4. Add Chart Titles, Axis Labels, Fancy Legend, Horizontal Line 5. Format X and Y Axis Tick Labels 6. Change Font and Add Data Markers 7. Add Annotations 8. Add Logo/Watermarks MOTIVATION Since I started this blog a few years ago, one of my obsessions is creating good looking, informative plots/charts. I've spent an inordinate amount of time learning how to do this and it is still a work in a progress. Howe

READ MORE
Backtesting the Implied Volatility Long/Short Strategy (12/31/16)
QuantResearch

Backtesting the Implied Volatility Long/Short Strategy (12/31/16)

Post Outline * Strategy Summary * References * 4-Week Holding Period Strategy Update * 1-Week Holding Period Strategy Updated (Target Leverage=2) Strategy Summary This is a stylized implementation of the strategy described in the research paper titled "What Does Individual Option Volatility Smirk Tell Us About Future Equity Returns" by Yuhang Xing, Xiaoyan Zhang and Rui Zhao. The authors show that their SKEW factor predicts individual equity returns up to 6 months! ABSTRACT Stocks exhi

READ MORE
Asset Pricing using Extreme Liquidity with Python (Part-2)
PythonQuant

Asset Pricing using Extreme Liquidity with Python (Part-2)

POST OUTLINE * Part-1 Recap * Part-1 Error Corrections * Part-2 Implementation Details, Deviations, Goals * Prepare Data * Setup PYMC3 Generalized Linear Models (GLM) * Evaluate and Interprate Models * Conclusions * References part-1 recap In part 1 We discussed the theorized underpinnings of Ying Wu of Stevens Institute of Technology - School's asset pricing model. Theory links the catalyst of systemic risk events to the funding difficulties of major financial intermediaries. Thus c

READ MORE
Backtesting the Implied Volatility Long/Short Strategy (12/06/16)
PythonQuant

Backtesting the Implied Volatility Long/Short Strategy (12/06/16)

Post Outline * Strategy Summary * References * 4-Week Holding Period Strategy Update * 1-Week Holding Period Strategy Updated (Target Leverage=2) Strategy Summary This is a stylized implementation of the strategy described in the research paper titled "What Does Individual Option Volatility Smirk Tell Us About Future Equity Returns" by Yuhang Xing, Xiaoyan Zhang and Rui Zhao. The authors show that their SKEW factor predicts individual equity returns up to 6 months! ABSTRACT Stocks exhi

READ MORE
Asset Pricing using Extreme Liquidity Risk with Python (Part-1)
PythonQuant

Asset Pricing using Extreme Liquidity Risk with Python (Part-1)

Post Outline * Introduction * Get Data * Calculate Cross-Sectional Extreme Liquidity Risk * Quick and Dirty Observations * Next Steps * References iNTRODUCTION One of the primary goals of quantitative investing is effectively managing tail risk. Failure to do so can result in crushing drawdowns or a total blowup of your fund/portfolio. Commonly known tools for estimating tail risk, e.g. Value-at-Risk, often underestimate the likelihood and magnitude of risk-off events. Furthermore, tai

READ MORE
Backtesting the Implied Volatility Long/Short Strategy (11/16/16)
PythonQuant

Backtesting the Implied Volatility Long/Short Strategy (11/16/16)

Post Outline * Strategy Summary * References * 4-Week Holding Period Strategy Update * 1-Week Holding Period Strategy Updated (Target Leverage=2) Strategy Summary This is a stylized implementation of the strategy described in the research paper titled "What Does Individual Option Volatility Smirk Tell Us About Future Equity Returns" by Yuhang Xing, Xiaoyan Zhang and Rui Zhao. The authors show that their SKEW factor predicts individual equity returns up to 6 months! ABSTRACT Stocks exhi

READ MORE