While I continue to update the ICC Valuation methodology I plan to post more of the custom charts I use to gain insight into current market structure, momentum, and relative value.
Updated Composite ETF List
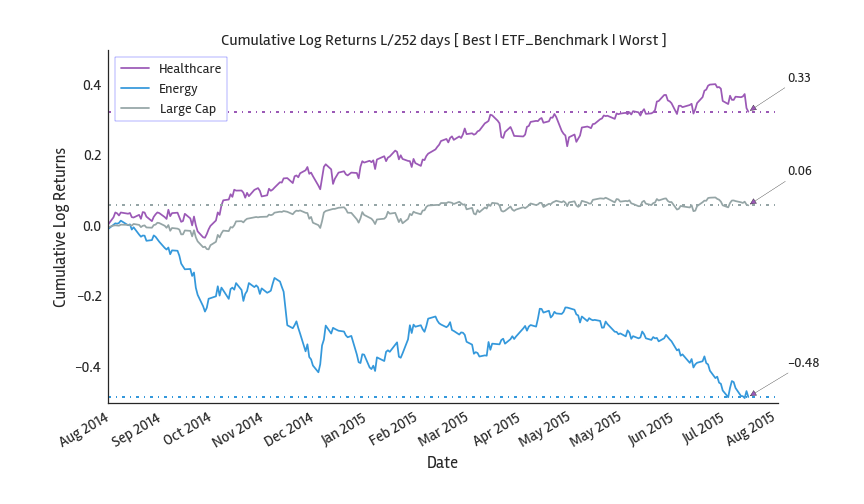
Best vs Worst Performing ETF Composite L/252 Days
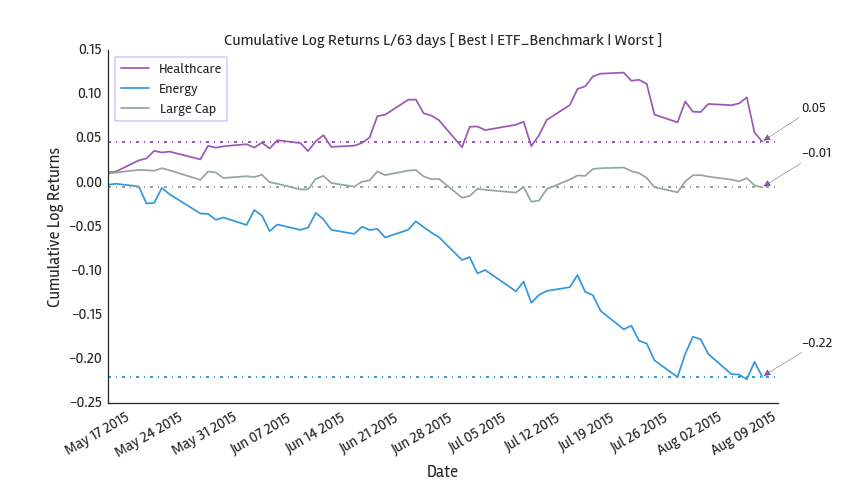
Best vs Worst Performing ETF Composite L/63 Days
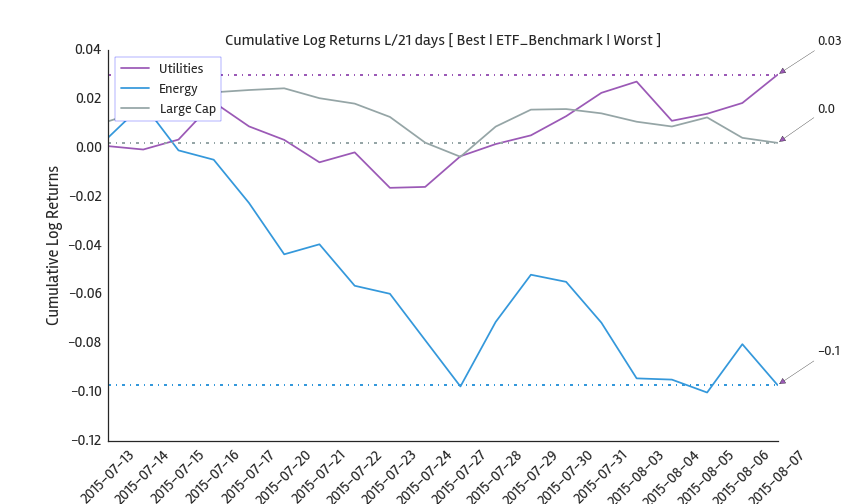
Best vs Worst Performing ETF Composite L/21 Days
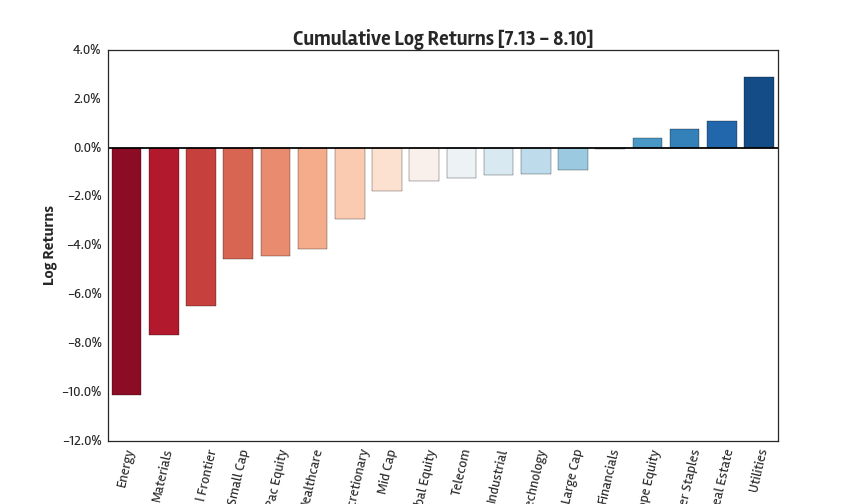
BarPlot Cumulative Returns L/4 Weeks
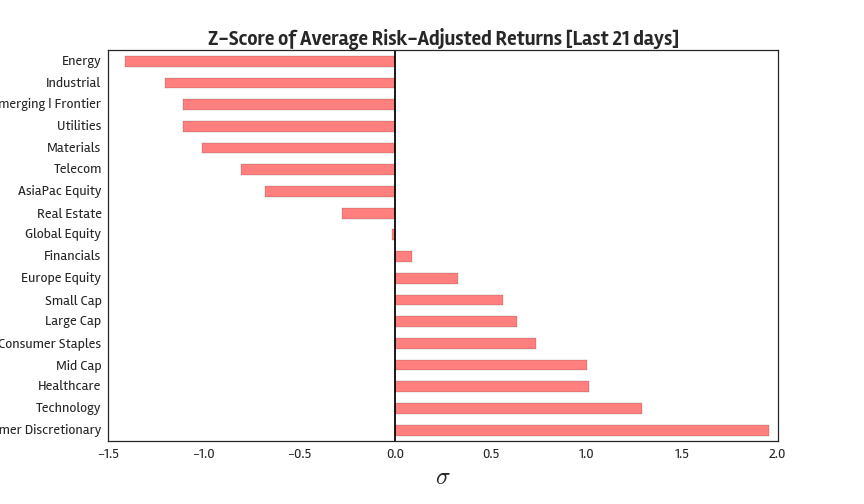
Z - Score Average Risk-Adjusted Returns L/21 Days
