Blog

How to get Free Intraday Stock Data with Python and BarCharts OnDemand API
PythonQuant

How to get Free Intraday Stock Data with Python and BarCharts OnDemand API

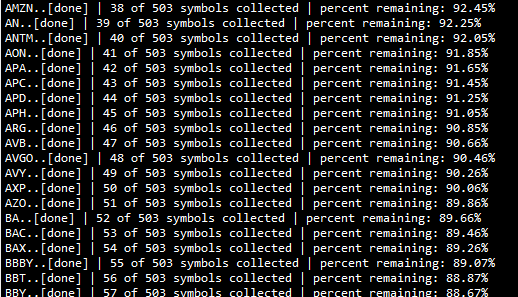
To this day the most popular article I have ever written on this blog was "How to get Free Intraday Stock Data with Netfonds". Unfortunately the Netfonds API has really declined in terms of usability, with too many popular stocks missing, and irregular trade and price quotes. Simply put, as the API went down, so did the code. However, all hope is not lost. The wonderful people at BarChart.com have created a well documented, easily accessible API for intraday stock data and even near real-time q

READ MORE →
EducationEquity Analysis

Guest Post Previously Featured on RectitudeMarket.com (09/02/2015)

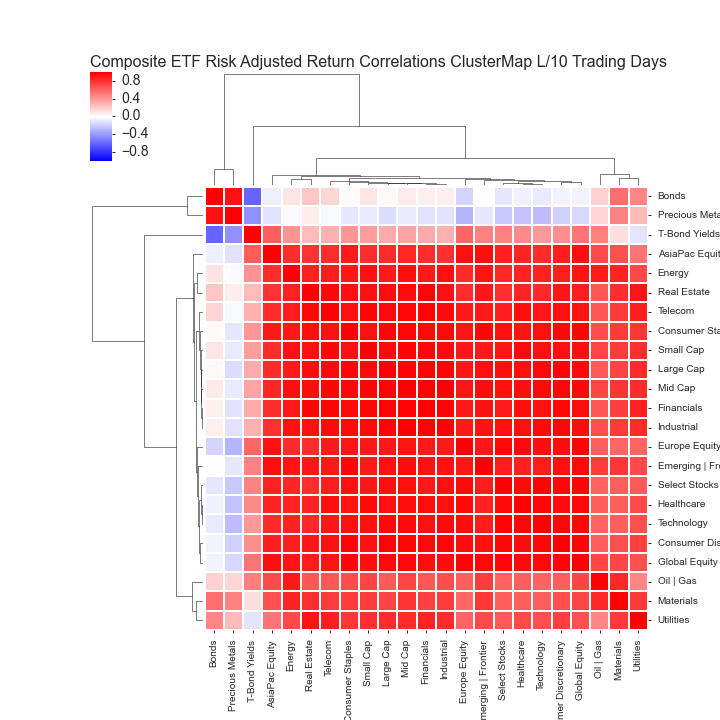
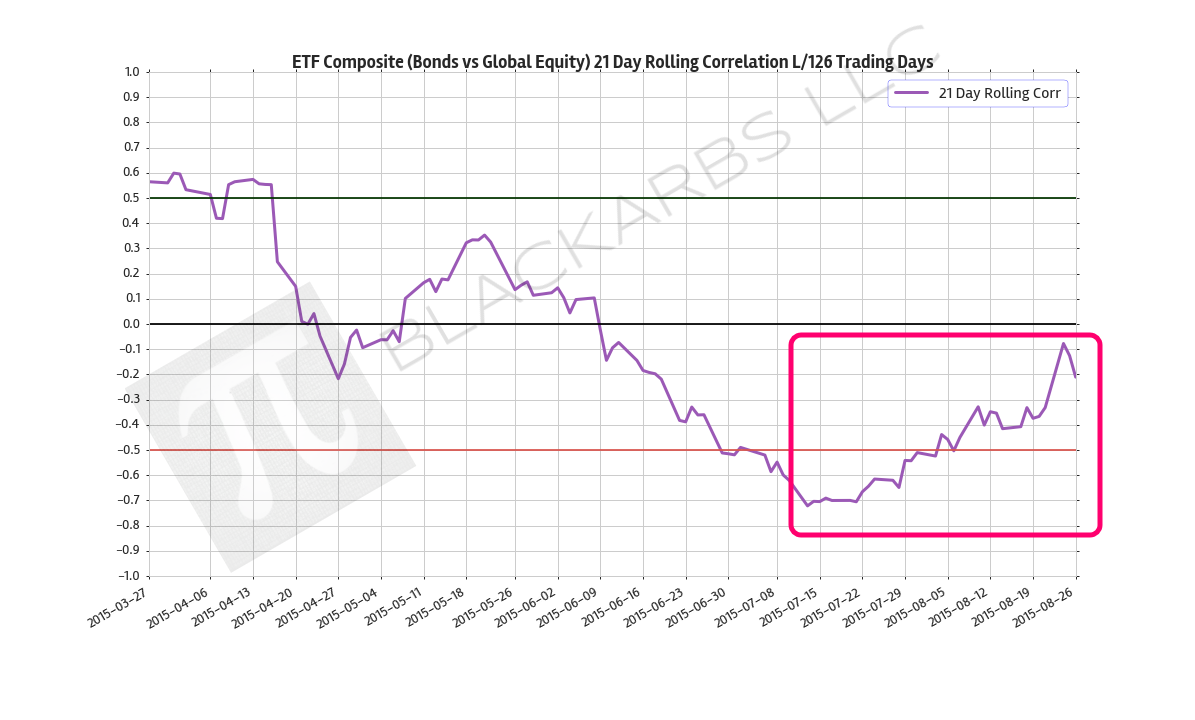
**Note: This post already appeared as a guest post on rectitudemarket.com. The reason I'm posting this article when it is 'outdated', is twofold. 1) I think it's beneficial to review previous works especially when one has the benefit of hindsight. This helps us determine the accuracy and bias of the research presented. 2) I further introduce the concept of conditional cumulative returns, which adds insight to what happens to our securities' returns given some other event occurring. In this case,

READ MORE →
Global MarketsPython

COMPOSITE MACRO ETF WEEKLY ANALYTICS (9/20/2015)

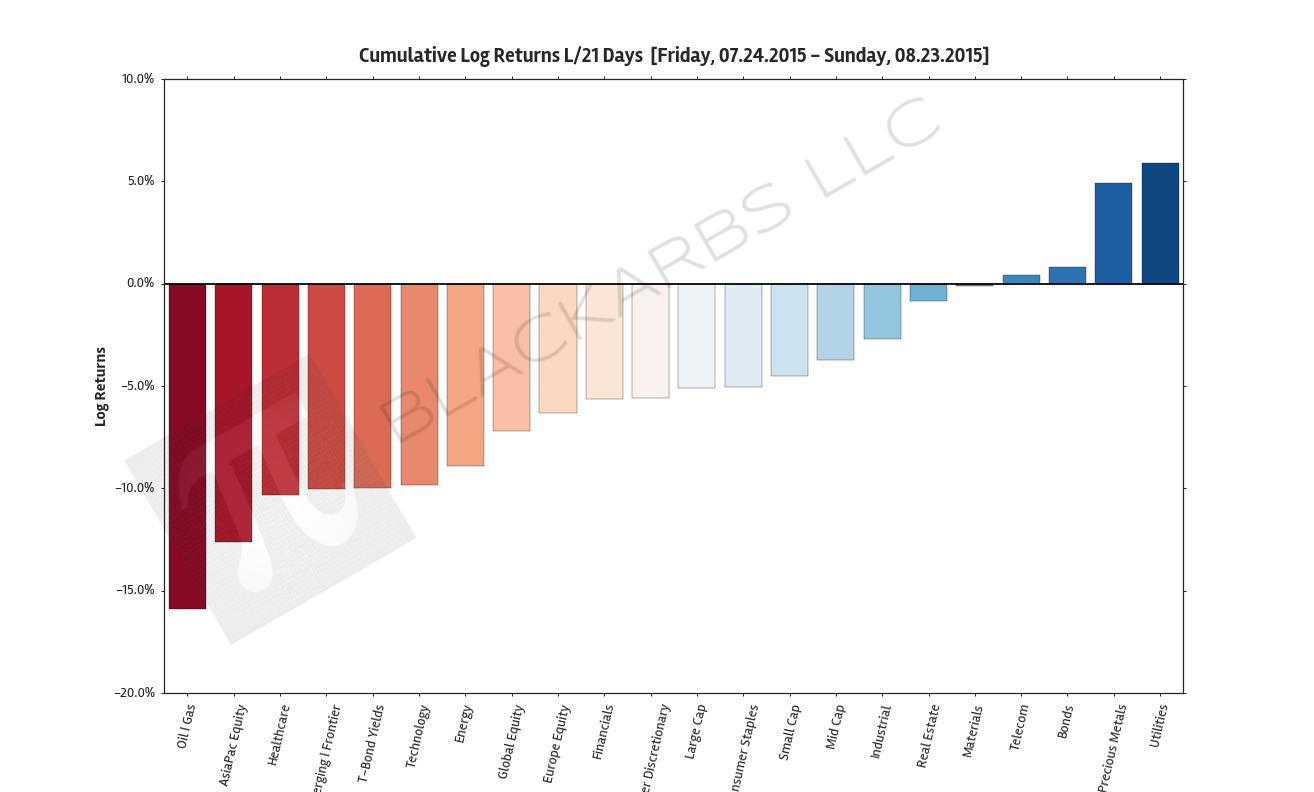
COMPOSITE ETF CUMULATIVE RETURN MOMENTUM These charts show the sum (cumulative) of the daily returns of each composite ETF over the specified period. The daily return is calculated as the log of the percent change between daily adjusted close prices. These charts help determine asset class return momentum. This is important because momentum is arguably the strongest and most persistent market anomaly. Poorly performing asset classes are likely to continue under performing while outperforming a

READ MORE →
Global MarketsPython

COMPOSITE MACRO ETF WEEKLY ANALYTICS (9/14/2015)

COMPOSITE ETF CUMULATIVE RETURN MOMENTUM These charts show the sum (cumulative) of the daily returns of each composite ETF over the specified period. The daily return is calculated as the log of the percent change between daily adjusted close prices. These charts help determine asset class return momentum. This is important because momentum is arguably the strongest and most persistent market anomaly. Poorly performing asset classes are likely to continue under performing while outperforming a

READ MORE →
Composite Macro ETF Weekly Analytics (8/30/2015)
Global MarketsQuant

Composite Macro ETF Weekly Analytics (8/30/2015)

COMPOSITE ETF CUMULATIVE RETURN MOMENTUM These charts show the sum (cumulative) of the daily returns of each composite ETF over the specified period. The daily return is calculated as the log of the percent change between daily adjusted close prices. These charts help determine asset class return momentum. This is important because momentum is arguably the strongest and most persistent market anomaly. Poorly performing asset classes are likely to continue under performing while outperforming a

READ MORE →
Was David Woo Right; Was the Selloff Exacerbated by Risk Parity Strategies?
Global MarketsFixed Income

Was David Woo Right; Was the Selloff Exacerbated by Risk Parity Strategies?

Today after the close Bloomberg TV had David Woo, Managing Director and Head of Global Rates and Currencies Research at Bank of America/Merrill Lynch, on to provide some insight regarding recent market action. More specifically, he addressed how Chinese and American markets are linked. He dropped a lot of gems during his segment but one point really struck a chord with me. He said that the recent selloff has likely been exacerbated by "Risk Parity Guys". If you're unfamiliar with 'risk parity'

READ MORE →
COMPOSITE MACRO ETF CUMULATIVE RETURN MOMENTUM (08.23.2015)
PythonQuant

COMPOSITE MACRO ETF CUMULATIVE RETURN MOMENTUM (08.23.2015)

Here is the updated list of composite ETF components. LAST 1260 TRADING DAYS (5 YEARS) Source: Yahoo Finance LAST 504 TRADING DAYS (2 YEARS) Source: Yahoo Finance LAST 252 TRADING DAYS (1 YEAR) Source: Yahoo Finance LAST 126 TRADING DAYS (6 MONTHS) Source: Yahoo Finance LAST 63 TRADING DAYS (3 MONTHS) Source: Yahoo Finance LAST 21 TRADING DAYS (1 MONTH) Source: Yahoo Finance LAST 10 TRADING DAYS Source: Yahoo Finance Blog RSS #block-yui_3_17_2_2_1440420671029_16964 .social-i

READ MORE →
PythonResearch

Get Free Financial Data w/ Python (State street ETF Holdings - SPY)

One issue I frequently encounter during my research is the need to compare an individual stock, or collection of stocks vs its ETF benchmark. To do this I need accurate ETF holdings data. Generally this information is located on the ETF provider's website. However, this information is often inconvenient to access. Most websites including the ETF provider will do something like the following, where they only show the top 10 holdings, when what we really need is accessible only by clicking the hi

READ MORE →
Equity AnalysisPython

Composite Macro ETF Cumulative Return Momentum (08.16.2015)

Here are the updated ETF components I'm using to construct the ETF composites. Last 504 Trading Days Composite ETF Cumulative Returns Last 252 Trading Days Composite ETF Cumulative Returns Last 126 Trading Days Composite ETF Cumulative Returns Last 63 Trading Days Composite ETF Cumulative Returns last 21 Trading days Composite ETF Cumulative Returns Last 10 Trading days Composite ETF Cumulative Returns Blog RSS #block-yui_3_17_2_4_1439677863749_22267

READ MORE →
Price Dispersion as a Smart Money Indicator
Equity AnalysisQuant

Price Dispersion as a Smart Money Indicator

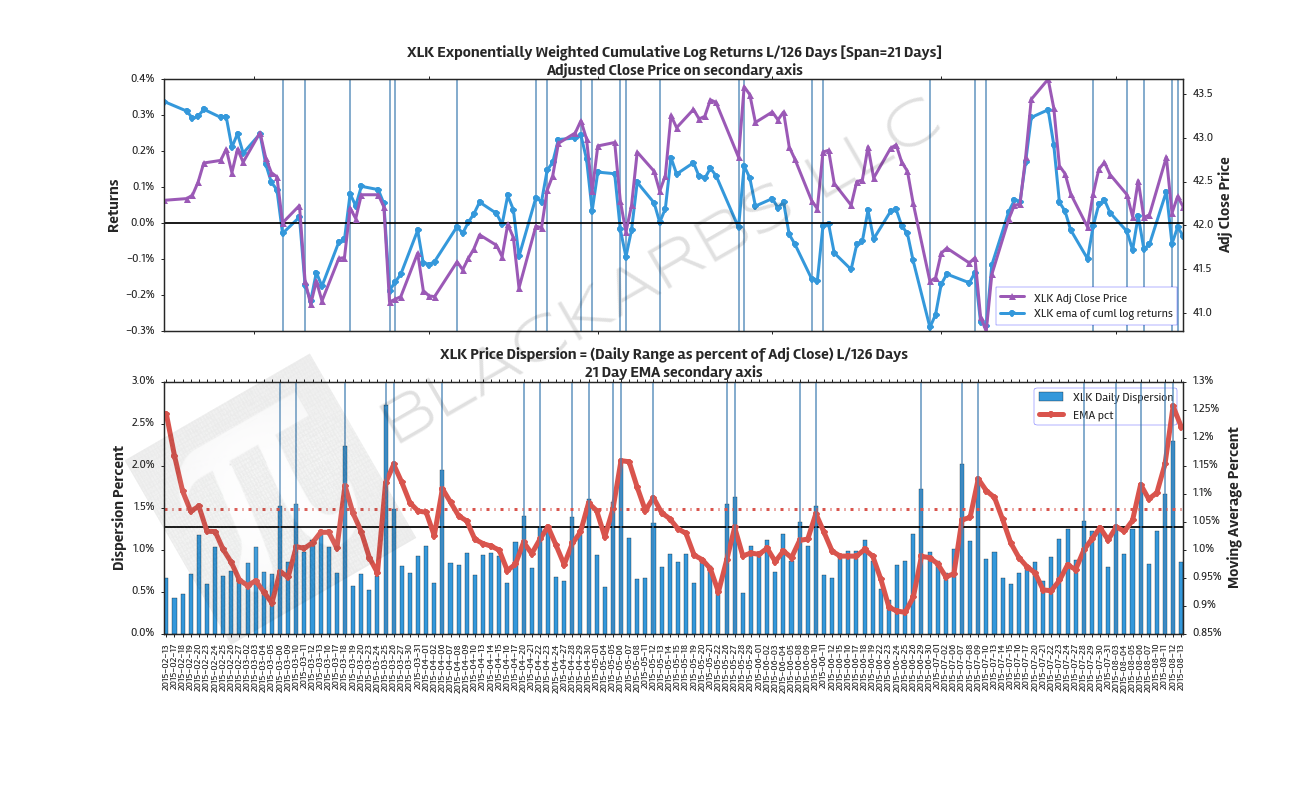
Before I get into the topic at hand, let me say I have not seen the following stock price data interpreted or studied like I am about to show you. As far as I am aware my approach is unique in that it is not overly complicated, can be generalized across a large cross section of asset class ETFs, and makes intuitive sense regarding market structure. Before I introduce the chart it is important that I clarify some definitions. What is Price Dispersion? I'm sure this may have many meanings amon

READ MORE →
Composite Equity ETF Analysis (8/10/2015)
Equity AnalysisResearch

Composite Equity ETF Analysis (8/10/2015)

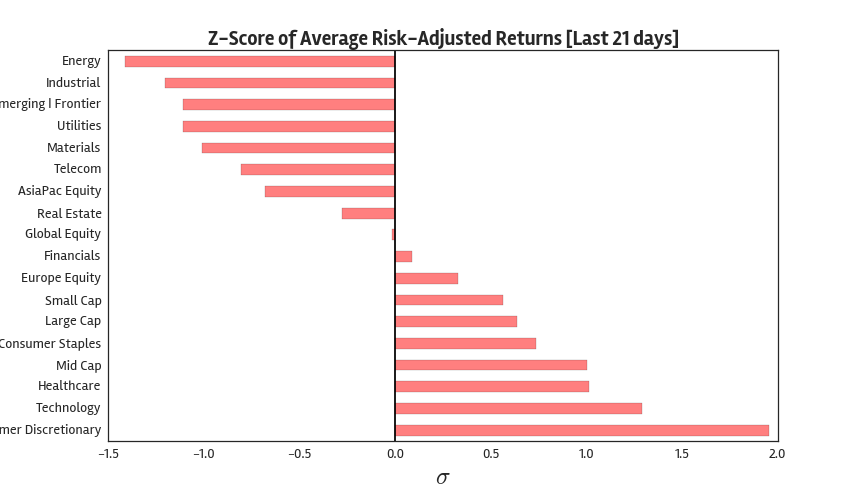
While I continue to update the ICC Valuation methodology I plan to post more of the custom charts I use to gain insight into current market structure, momentum, and relative value. Updated Composite ETF List Best vs Worst Performing ETF Composite L/252 Days Best vs Worst Performing ETF Composite L/63 Days Best vs Worst Performing ETF Composite L/21 Days BarPlot Cumulative Returns L/4 Weeks Z - Score Average Risk-Adjusted Returns L/21 Days

READ MORE →