Blog

COMPOSITE MACRO ETF IMPLIED COST OF CAPITAL ESTIMATES
PythonGlobal Markets

COMPOSITE MACRO ETF IMPLIED COST OF CAPITAL ESTIMATES

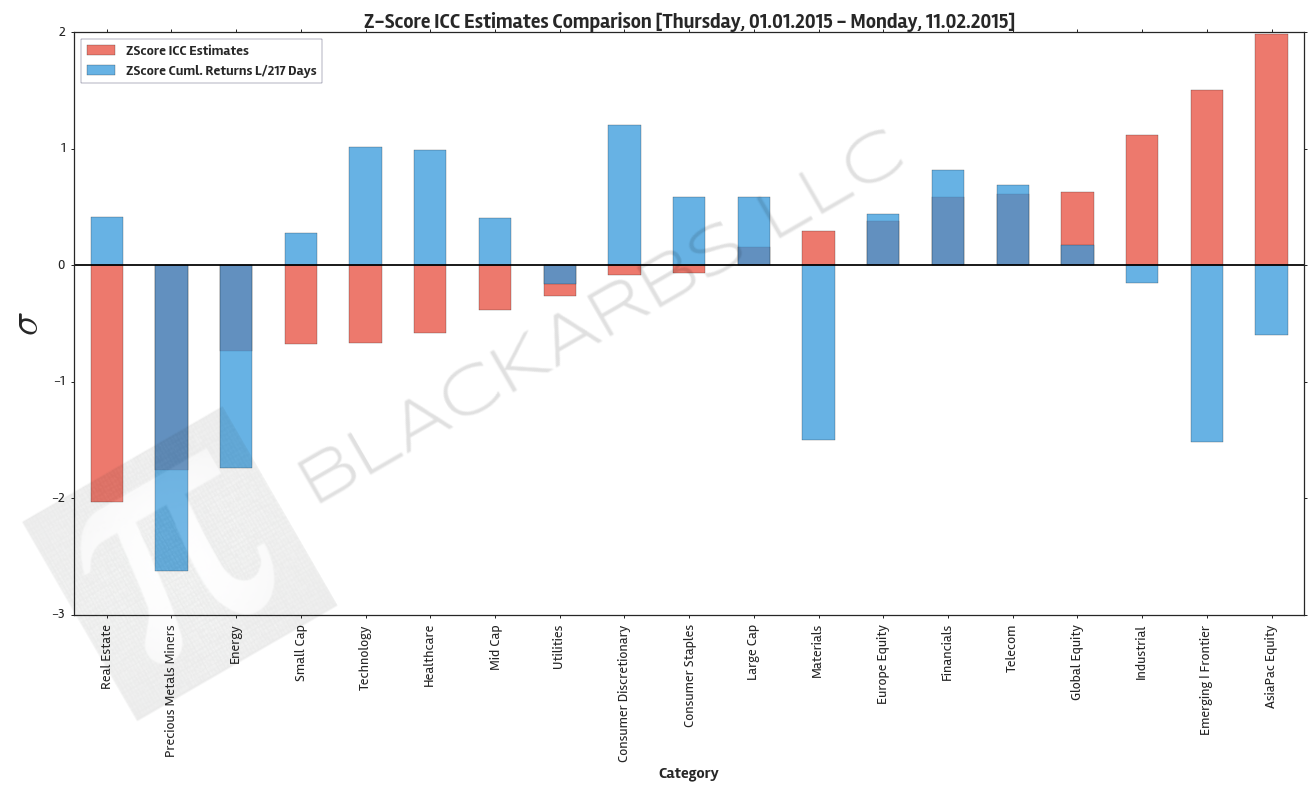
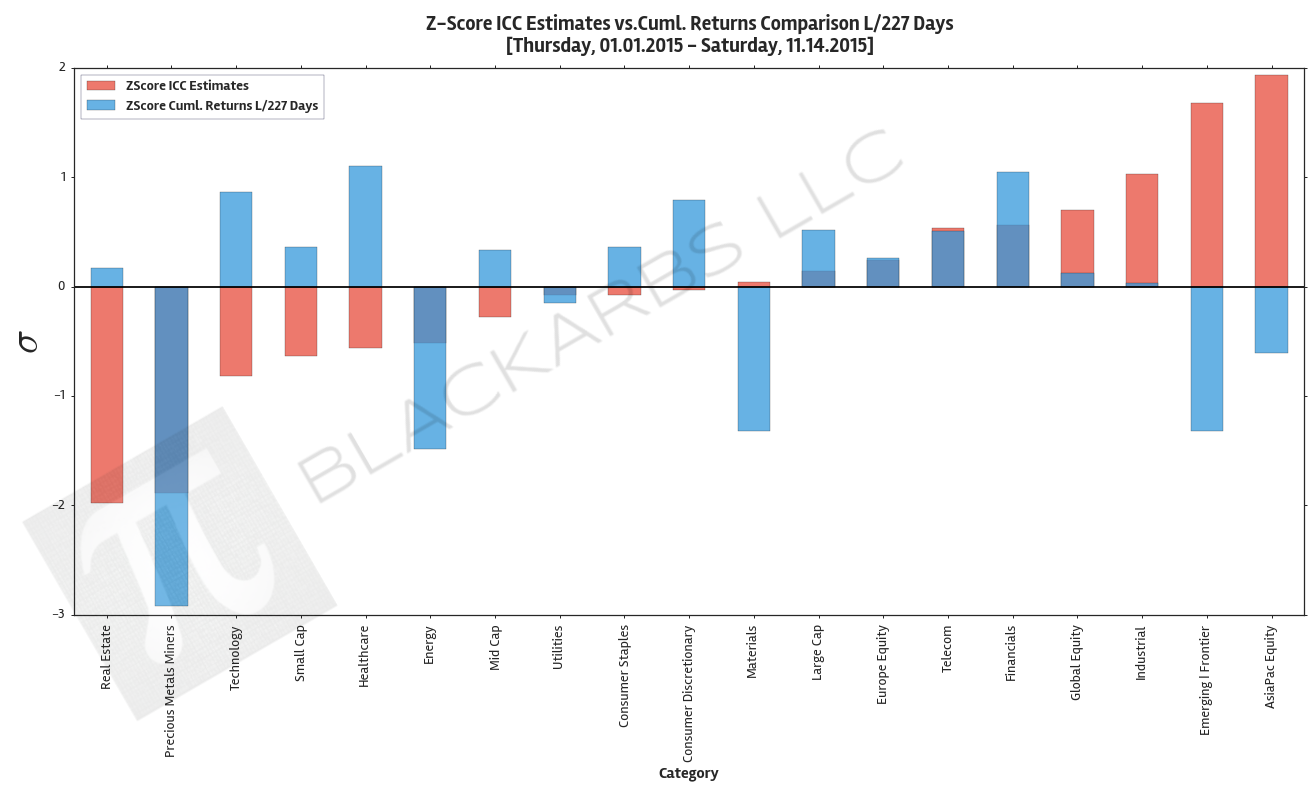
Earlier this year I used to publish a bi-weekly article using the "Implied Cost of Capital" model as an ETF relative value estimation tool. Unfortunately State Street began reporting obvious erroneous data points and eventually stopped providing certain fundamental data altogether. As a result I had to suspend publishing of my ICC estimates. Well thanks to YCharts.com and their excellent site I was able to find the requisite data needed to begin publishing my model estimates again. what is th

READ MORE
COMPOSITE MACRO ETF WEEKLY ANALYTICS (10/31/2015)
Global MarketsPython

COMPOSITE MACRO ETF WEEKLY ANALYTICS (10/31/2015)

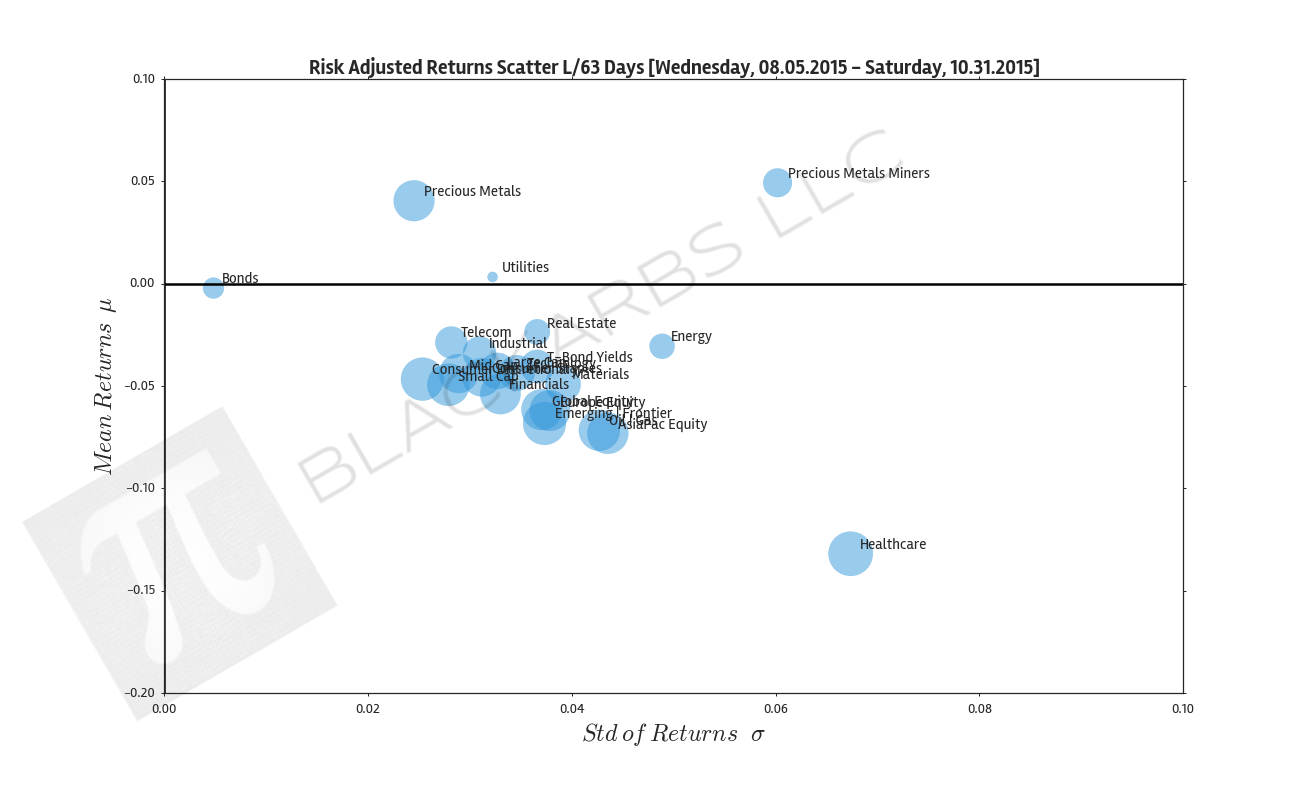
NEW LAYOUT: Going forward I will be testing a new organizational format for the charts. I have created a chart description page which details how each plot type is commonly interpreted (used). I will provide a link to the chart description page in the caption of each chart. The primary change is all the chart types will be grouped by the referenced time period. It is my hope that grouping the data this way will allow for easier analysis. Each time period grouping will display the charts in the

READ MORE
COMPOSITE MACRO ETF WEEKLY ANALYTICS (10/25/2015)
Global MarketsPython

COMPOSITE MACRO ETF WEEKLY ANALYTICS (10/25/2015)

COMPOSITE ETF CUMULATIVE RETURN MOMENTUM These charts show the sum (cumulative) of the daily returns of each composite ETF over the specified period. The daily return is calculated as the log of the percent change between daily adjusted close prices. These charts help determine asset class return momentum. This is important because momentum is arguably the strongest and most persistent market anomaly. Poorly performing asset classes are likely to continue under performing while outperforming a

READ MORE
Global MarketsPython

COMPOSITE MACRO ETF WEEKLY ANALYTICS (10/18/2015)

COMPOSITE ETF CUMULATIVE RETURN MOMENTUM These charts show the sum (cumulative) of the daily returns of each composite ETF over the specified period. The daily return is calculated as the log of the percent change between daily adjusted close prices. These charts help determine asset class return momentum. This is important because momentum is arguably the strongest and most persistent market anomaly. Poorly performing asset classes are likely to continue under performing while outperforming a

READ MORE
Global MarketsPython

COMPOSITE MACRO ETF WEEKLY ANALYTICS (10/10/2015)

COMPOSITE ETF CUMULATIVE RETURN MOMENTUM These charts show the sum (cumulative) of the daily returns of each composite ETF over the specified period. The daily return is calculated as the log of the percent change between daily adjusted close prices. These charts help determine asset class return momentum. This is important because momentum is arguably the strongest and most persistent market anomaly. Poorly performing asset classes are likely to continue under performing while outperforming a

READ MORE
Global MarketsPython

COMPOSITE MACRO ETF WEEKLY ANALYTICS (10/04/2015)

COMPOSITE ETF CUMULATIVE RETURN MOMENTUM These charts show the sum (cumulative) of the daily returns of each composite ETF over the specified period. The daily return is calculated as the log of the percent change between daily adjusted close prices. These charts help determine asset class return momentum. This is important because momentum is arguably the strongest and most persistent market anomaly. Poorly performing asset classes are likely to continue under performing while outperforming a

READ MORE
Equity AnalysisPython

Could SPY ETF Component Participation Have Alerted Us to Sell (Hedge) Prior to the Recent Market Downturn?

This is the Python Code version of a guest post presented here on RectitudeMarket.com. If you would like to read the analysis without the Python code please click the link above. To market pundits and casual observers the recent correction in equity markets appeared as a surprise. Overall headline economic data was positive at best and mixed at worst. Domestically, capital markets had been looking ‘ok’ while most of the major volatility was taking place abroad in emerging markets, and commodity

READ MORE
Global MarketsPython

COMPOSITE MACRO ETF WEEKLY ANALYTICS (9/28/2015)

COMPOSITE ETF CUMULATIVE RETURN MOMENTUM These charts show the sum (cumulative) of the daily returns of each composite ETF over the specified period. The daily return is calculated as the log of the percent change between daily adjusted close prices. These charts help determine asset class return momentum. This is important because momentum is arguably the strongest and most persistent market anomaly. Poorly performing asset classes are likely to continue under performing while outperforming a

READ MORE
How to get Free Intraday Stock Data with Python and BarCharts OnDemand API
PythonQuant

How to get Free Intraday Stock Data with Python and BarCharts OnDemand API

To this day the most popular article I have ever written on this blog was "How to get Free Intraday Stock Data with Netfonds". Unfortunately the Netfonds API has really declined in terms of usability, with too many popular stocks missing, and irregular trade and price quotes. Simply put, as the API went down, so did the code. However, all hope is not lost. The wonderful people at BarChart.com have created a well documented, easily accessible API for intraday stock data and even near real-time q

READ MORE
EducationEquity Analysis

Guest Post Previously Featured on RectitudeMarket.com (09/02/2015)

**Note: This post already appeared as a guest post on rectitudemarket.com. The reason I'm posting this article when it is 'outdated', is twofold. 1) I think it's beneficial to review previous works especially when one has the benefit of hindsight. This helps us determine the accuracy and bias of the research presented. 2) I further introduce the concept of conditional cumulative returns, which adds insight to what happens to our securities' returns given some other event occurring. In this case,

READ MORE
Global MarketsPython

COMPOSITE MACRO ETF WEEKLY ANALYTICS (9/20/2015)

COMPOSITE ETF CUMULATIVE RETURN MOMENTUM These charts show the sum (cumulative) of the daily returns of each composite ETF over the specified period. The daily return is calculated as the log of the percent change between daily adjusted close prices. These charts help determine asset class return momentum. This is important because momentum is arguably the strongest and most persistent market anomaly. Poorly performing asset classes are likely to continue under performing while outperforming a

READ MORE
Global MarketsPython

COMPOSITE MACRO ETF WEEKLY ANALYTICS (9/14/2015)

COMPOSITE ETF CUMULATIVE RETURN MOMENTUM These charts show the sum (cumulative) of the daily returns of each composite ETF over the specified period. The daily return is calculated as the log of the percent change between daily adjusted close prices. These charts help determine asset class return momentum. This is important because momentum is arguably the strongest and most persistent market anomaly. Poorly performing asset classes are likely to continue under performing while outperforming a

READ MORE