PythonGlobal Markets
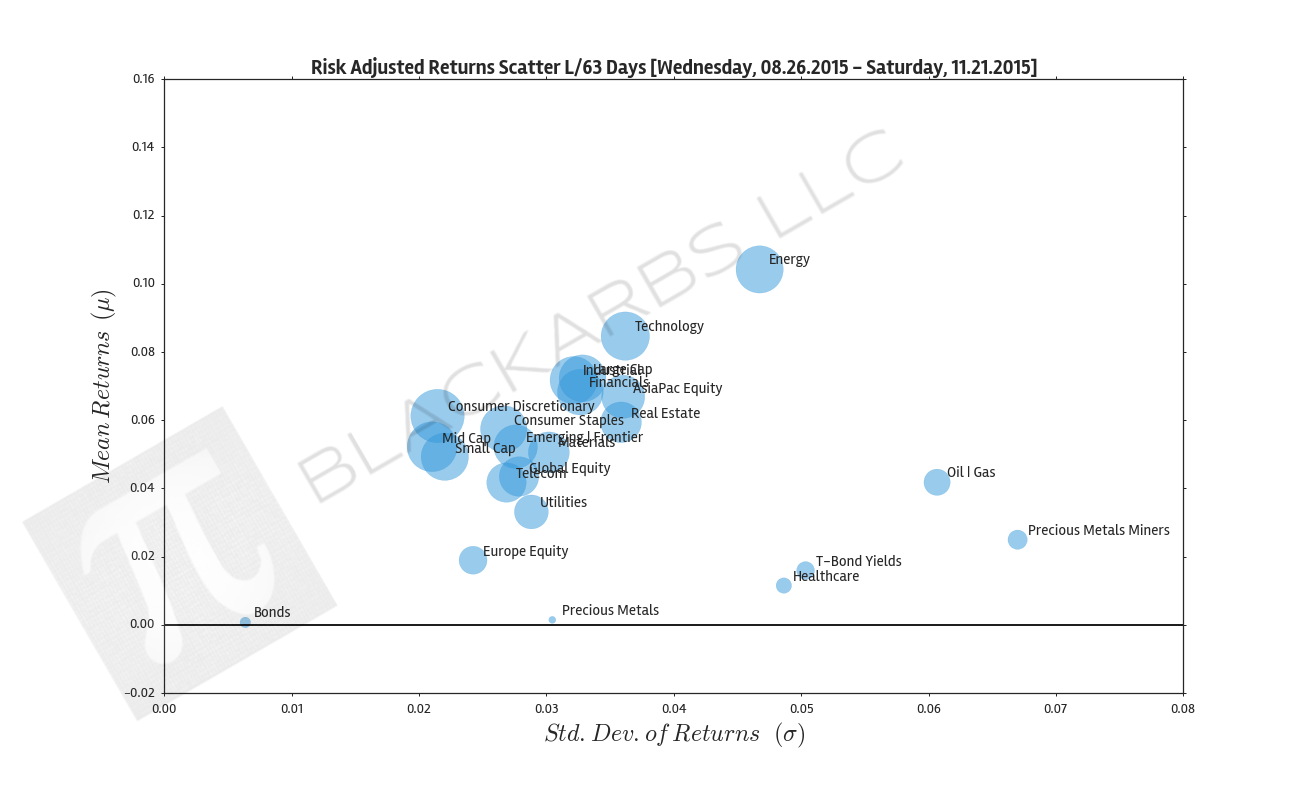
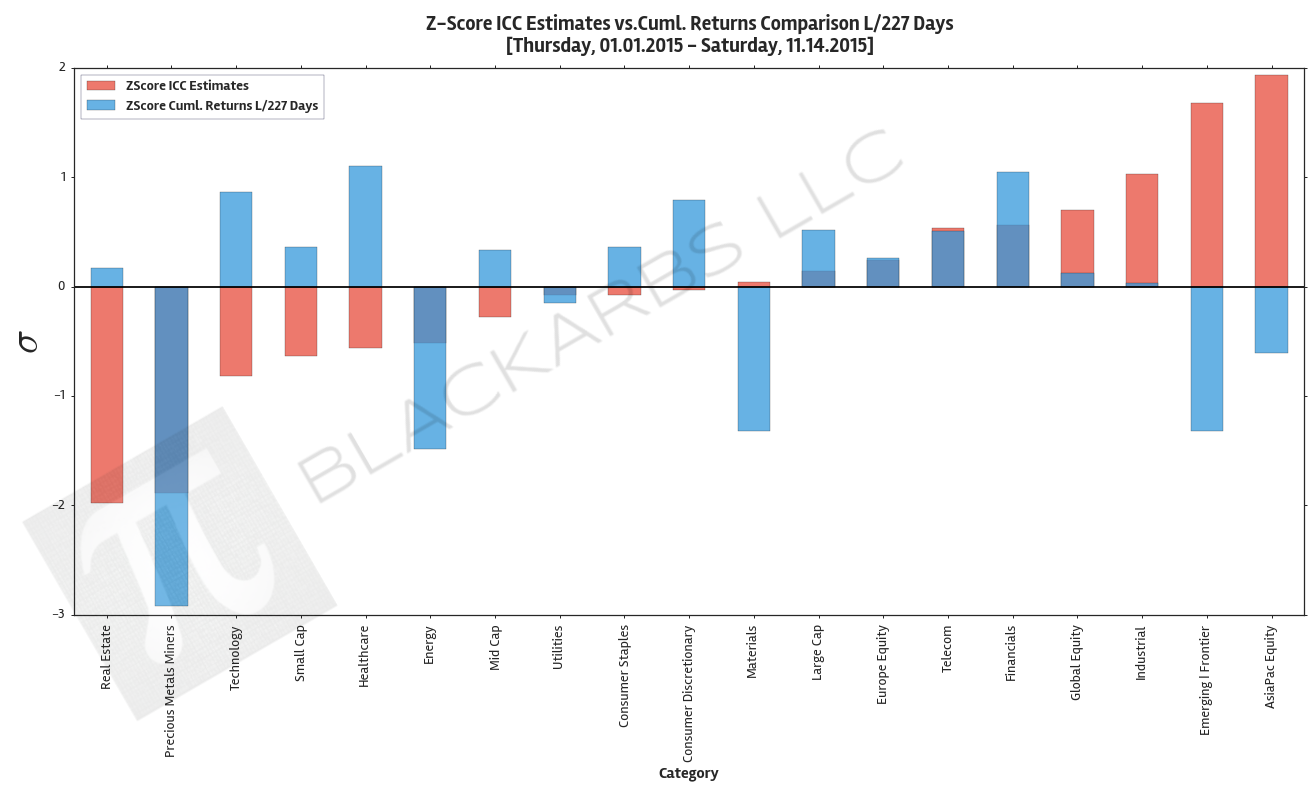
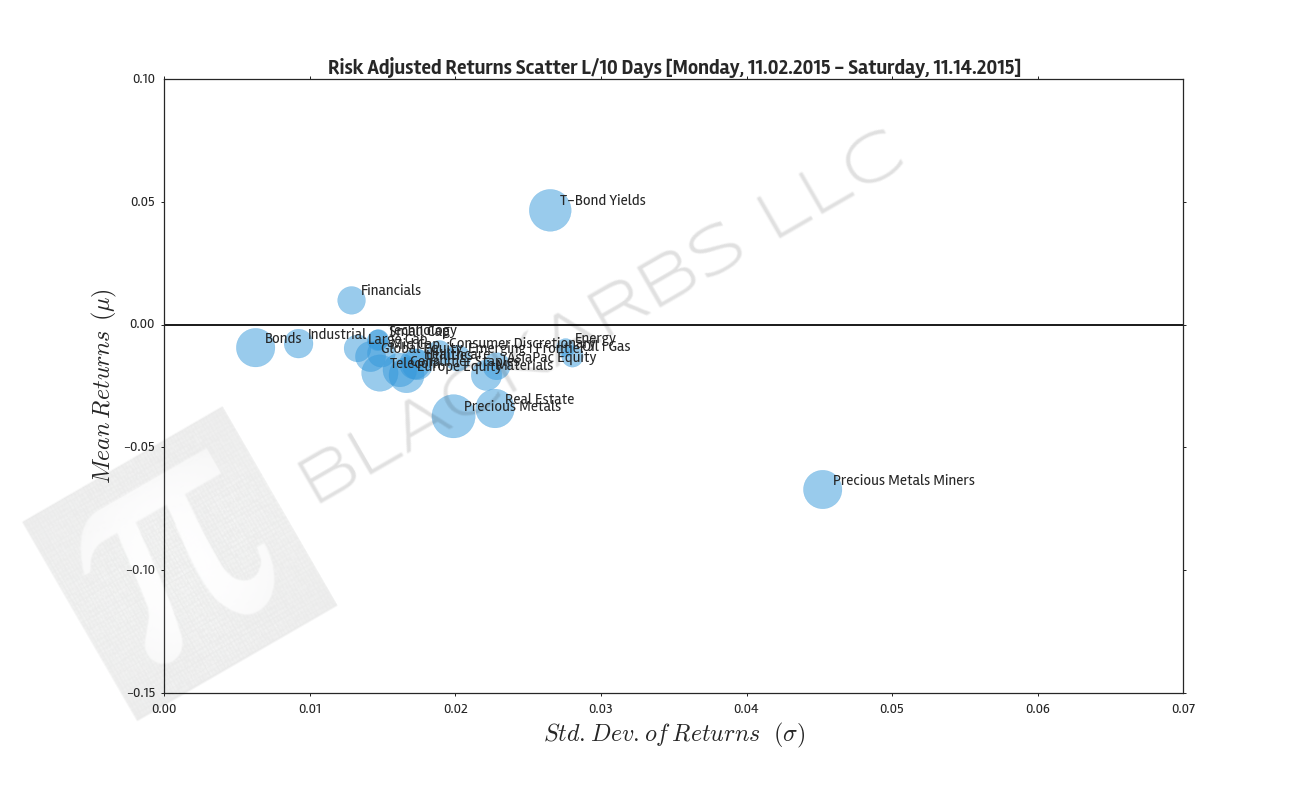
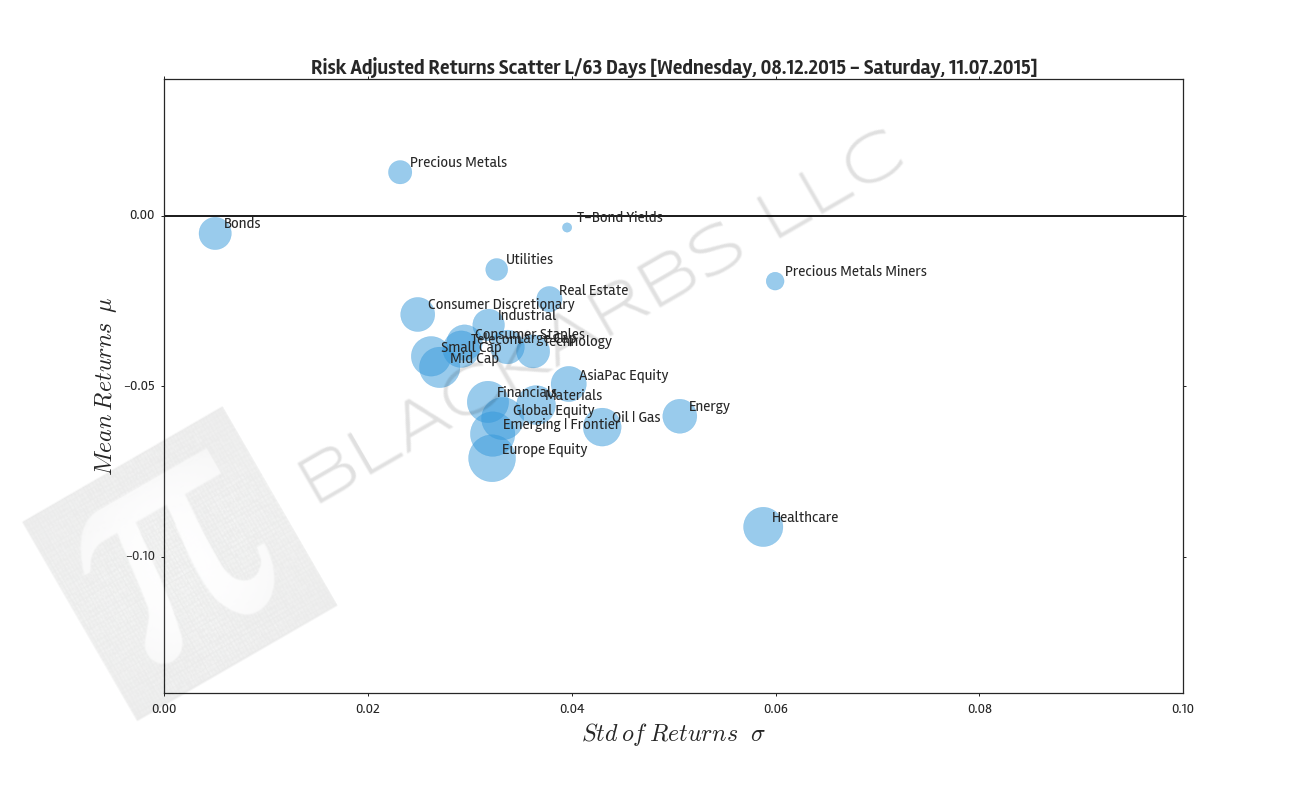
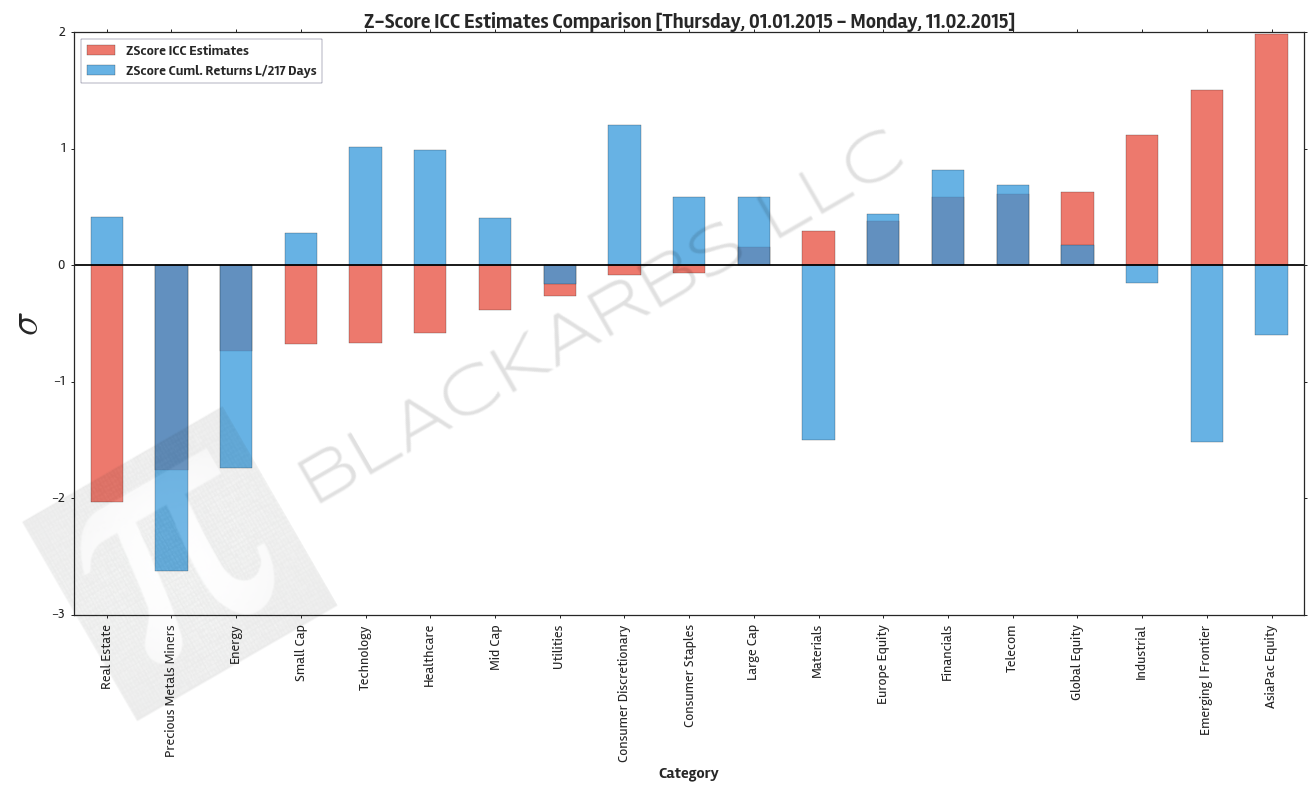
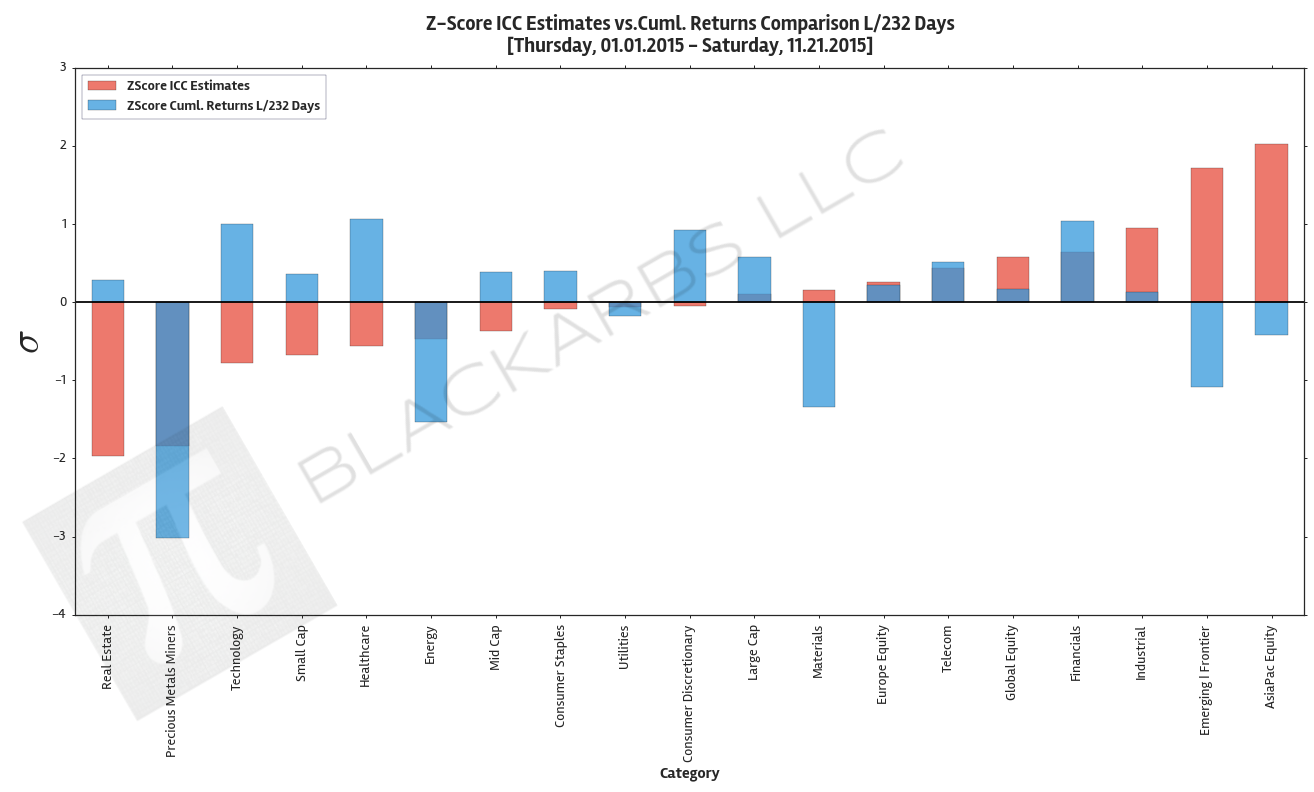
COMPOSITE MACRO ETF WEEKLY IMPLIED COST-OF-CAPITAL ESTIMATES VS. CUMULATIVE RETURNS (11/21/15)
WHAT IS THE "IMPLIED COST OF CAPITAL (ICC)" MODEL? “In accounting and finance the implied cost of equity capital (ICC)—defined as the internal rate of return that equates the current stock price to discounted expected future dividends—is an increasingly popular class of proxies for the expected rate of equity returns. ” — CHARLES C. Y. WANG; an assistant professor of business administration in the Accounting and Management Unit at Harvard Business School The basic concept of the ICC model is
READ MORE →