Now that Alpha Lab is mostly operational, I can finally start answering my research questions methodically.
Using my default leveraged ETF long-only strategy as the base case, the first question I wanted to answer was simple:
What objective metric should the optimizer actually optimize?
Alpha Lab has built-in walkforward optimization. Under the hood, Optuna samples a parameter space and needs an objective score to maximize or minimize. As I built out the system, I added the usual suspects: Sharpe, Calmar, max drawdown, gain-to-pain, omega, total return, and VI composite.
But adding them raised a more important question: which objective has the best empirical support?
That question is more subtle than it sounds. Before deciding which objective is "best," I needed to define what "best" means for this strategy. Leveraged ETF strategies are highly path-dependent. Endpoint return alone can hide a lot of pain, and drawdown alone can punish a strategy without telling you whether the recovery path was worth it.
So I wanted the judging metric to reward compounding while penalizing path-dependent risk.
For this experiment, I used geometric Martin ratio as the out-of-sample judging rule:
Geometric Martin ratio = geometric growth per unit of ulcer/path pain.
In plain English: how much future compounding did the strategy produce for each unit of painful path behavior?
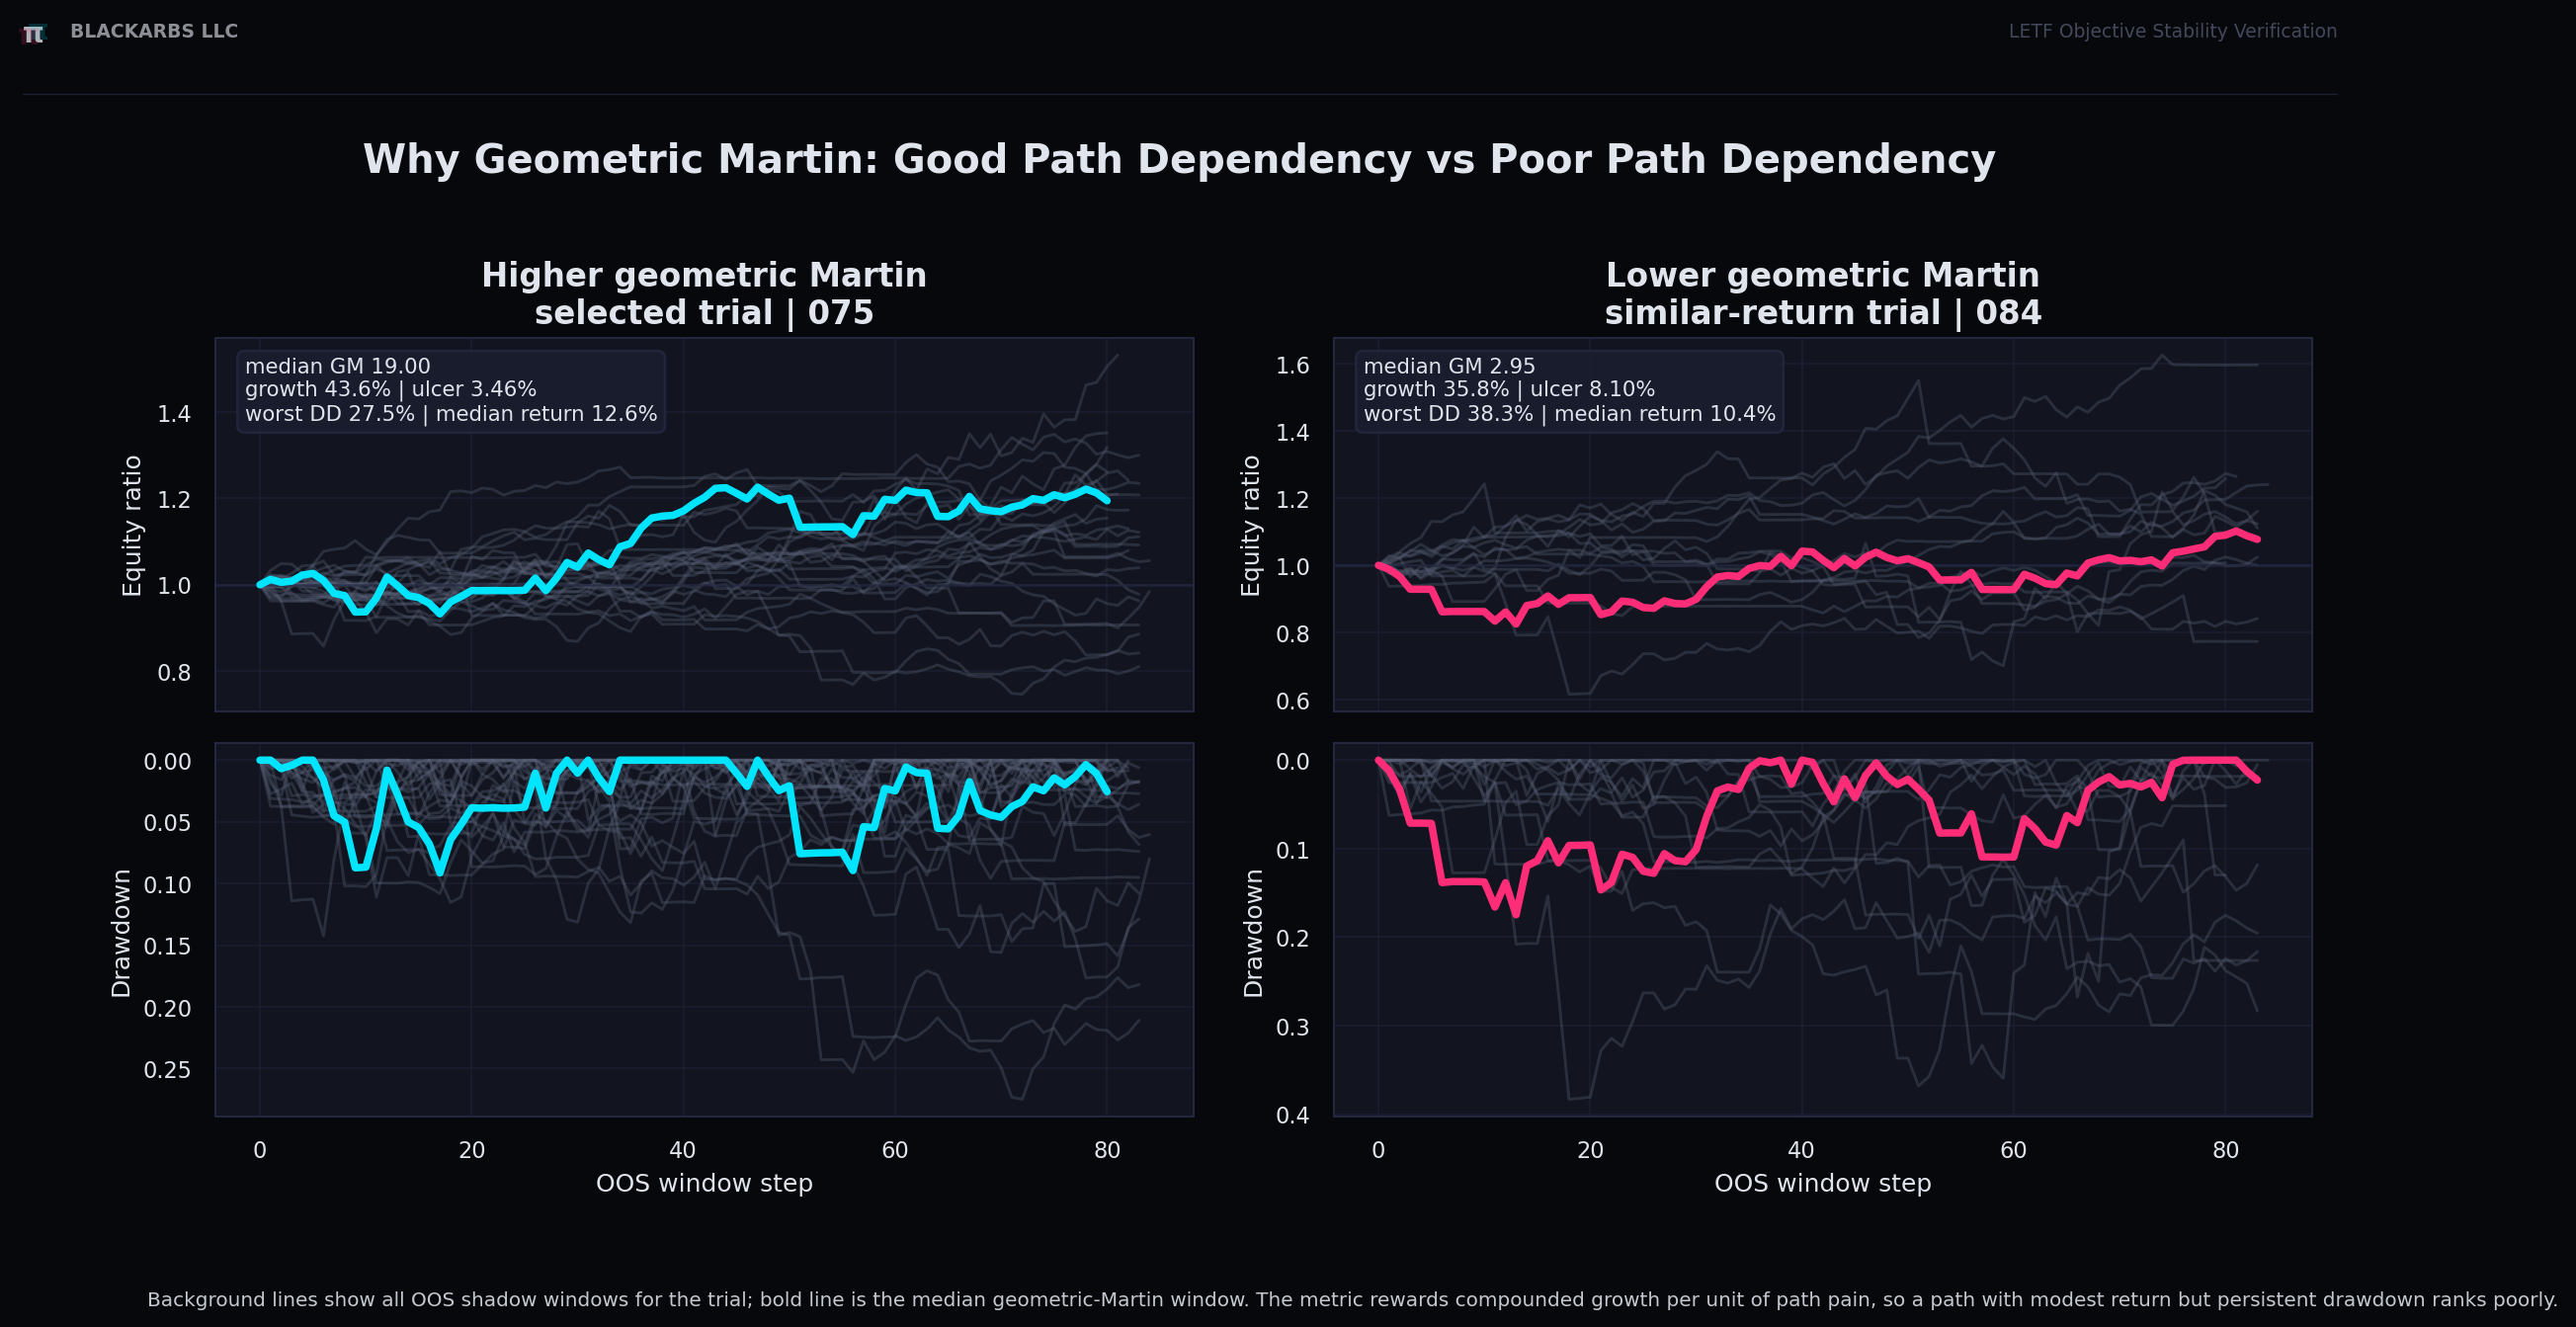
Figure 1: Endpoint return is not enough. The path matters because capital has to survive the ride.
The Experiment
The first version of the test looked at a recent out-of-sample period from 2018 through 2021. After the experimental design looked coherent, I ran a longer, non-overlapping holdout from 2012 through 2018 and compared the results.
The goal was not to find the best-looking backtest. The goal was to identify which optimizer objective remained useful across different out-of-sample windows.
I tested eight optimizer targets:
sharpe_ratiocalmar_ratiomax_drawdowngain_to_pain_ratioomega_ratiototal_returnvi_composite_v1geometric_martin_ratio
The important detail is that geometric_martin_ratio was not only the judging rule. I also tested it directly as an optimizer objective.
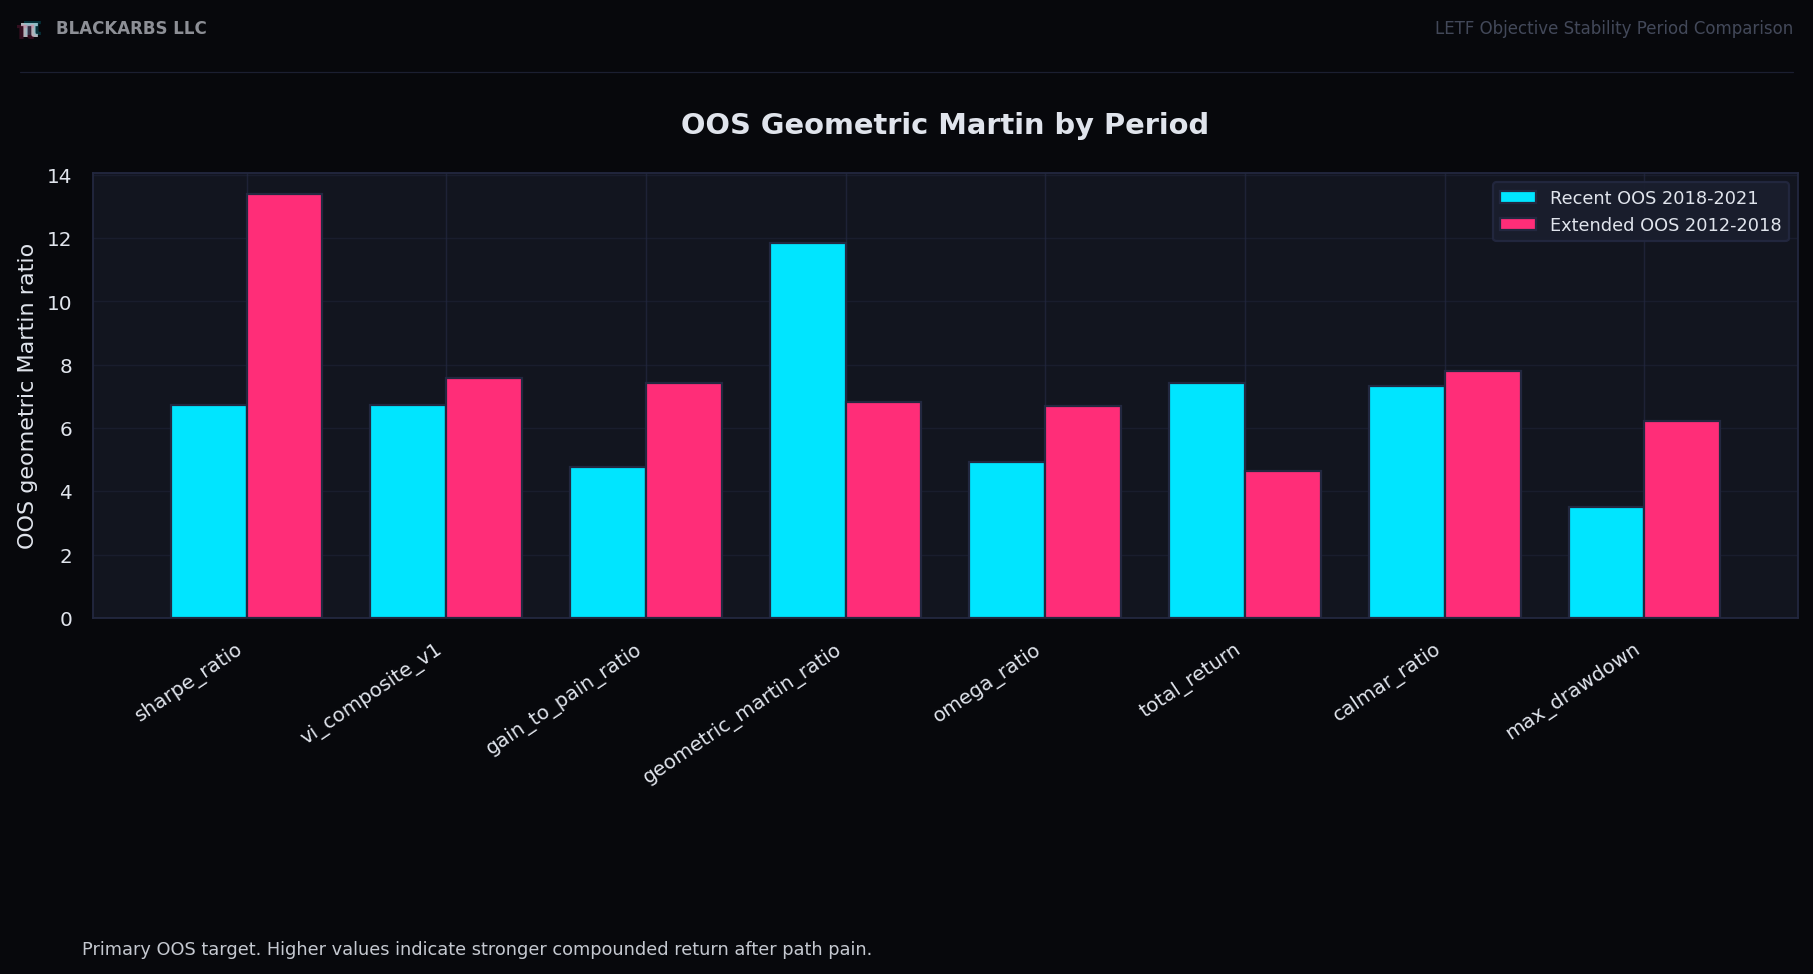
Figure 2: Geometric Martin was the OOS judging rule across both periods. The direct geometric-Martin optimizer performed well, but did not dominate.
What Stability Means Here
Once I knew what I wanted to judge out of sample, I still needed to define stability.
I used three equally weighted components:
- OOS geometric Martin rank
Which optimizer target produced the best future path quality? - IS/OOS geometric Martin information coefficient
Did the in-sample optimizer score predict out-of-sample geometric Martin across trials? - Window consistency rank
Was the selected trial's objective score stable across walkforward windows?
The third component uses the coefficient of variation:
window consistency CV = std(per-window score_value) / abs(mean(per-window score_value))Lower CV is better. One nuance: this is the CV of each objective arm's native per-window optimizer score, not the CV of geometric Martin for every arm. For example, the Sharpe arm uses per-window Sharpe-like score_value; the geometric-Martin arm uses per-window geometric-Martin score_value.
The three rank components are averaged into a final stability score:
stability score =
  average(
    OOS geometric Martin rank,
    IS/OOS geometric Martin IC rank,
    window consistency rank
  )
Lower stability score is better.
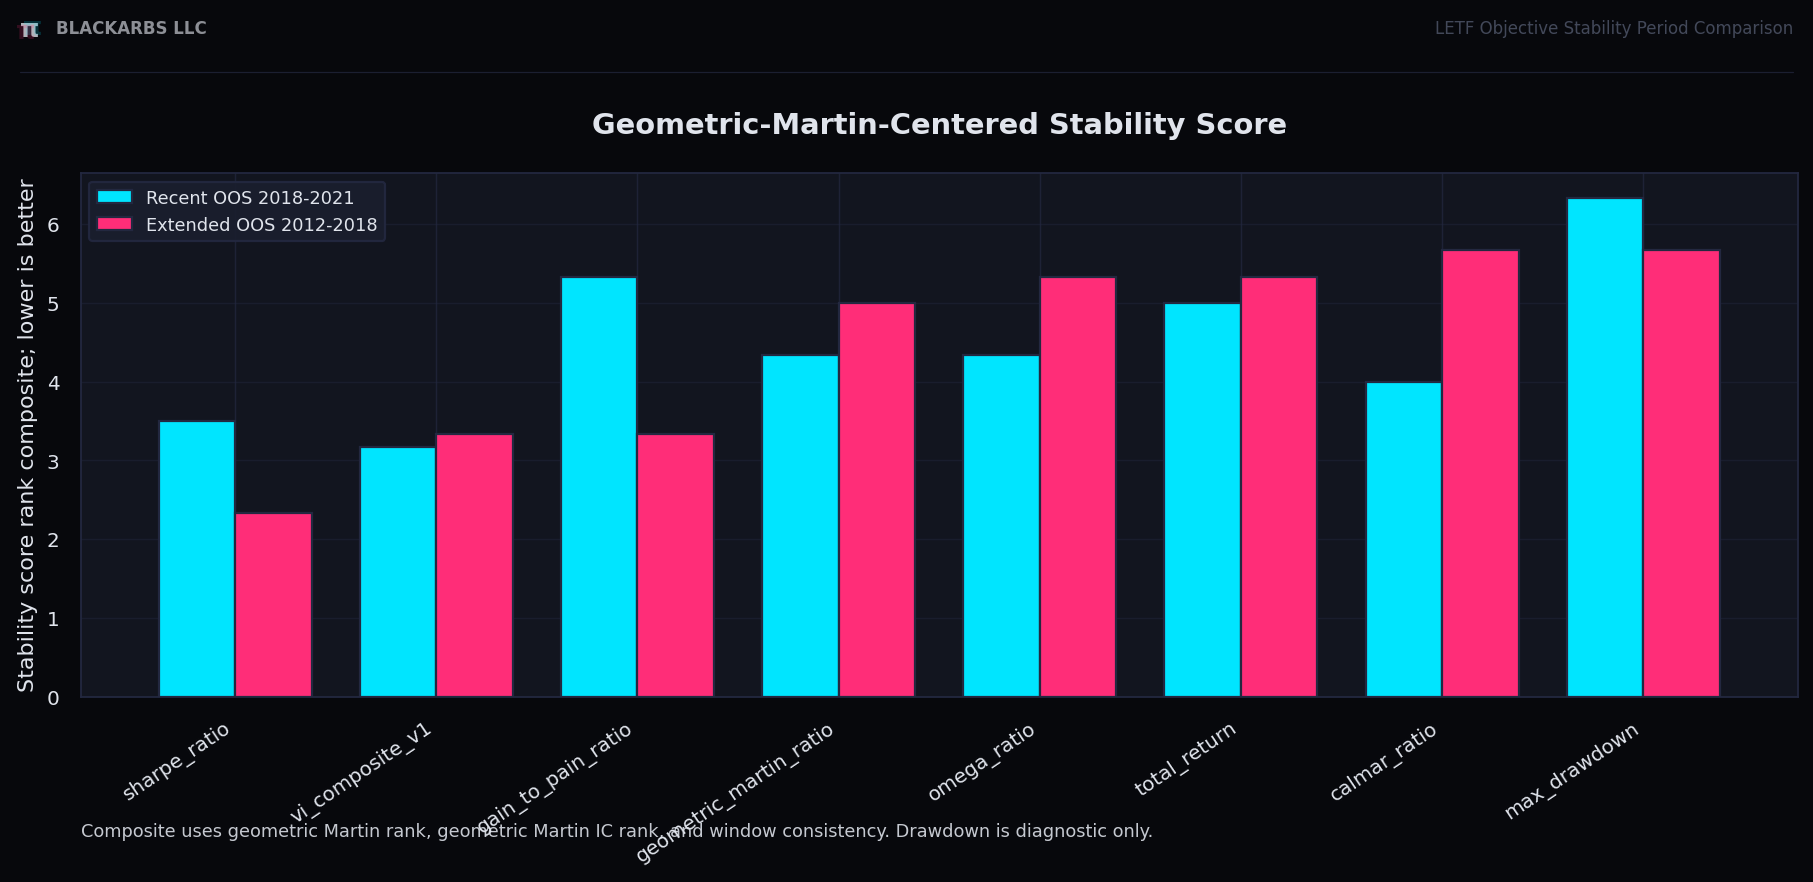
Figure 3: The final stability score combines path quality, predictiveness, and window consistency.
Predictiveness Matters
A strategy can look good out of sample by accident. That is why the information coefficient matters.
The question is not only: "Which objective produced a high OOS geometric Martin score?"
The harder question is:
Did the in-sample objective score contain useful information about future geometric Martin?
If the in-sample score has low or negative rank correlation with out-of-sample geometric Martin, then the optimizer is not really guiding us. It is just selecting something that happened to work later.
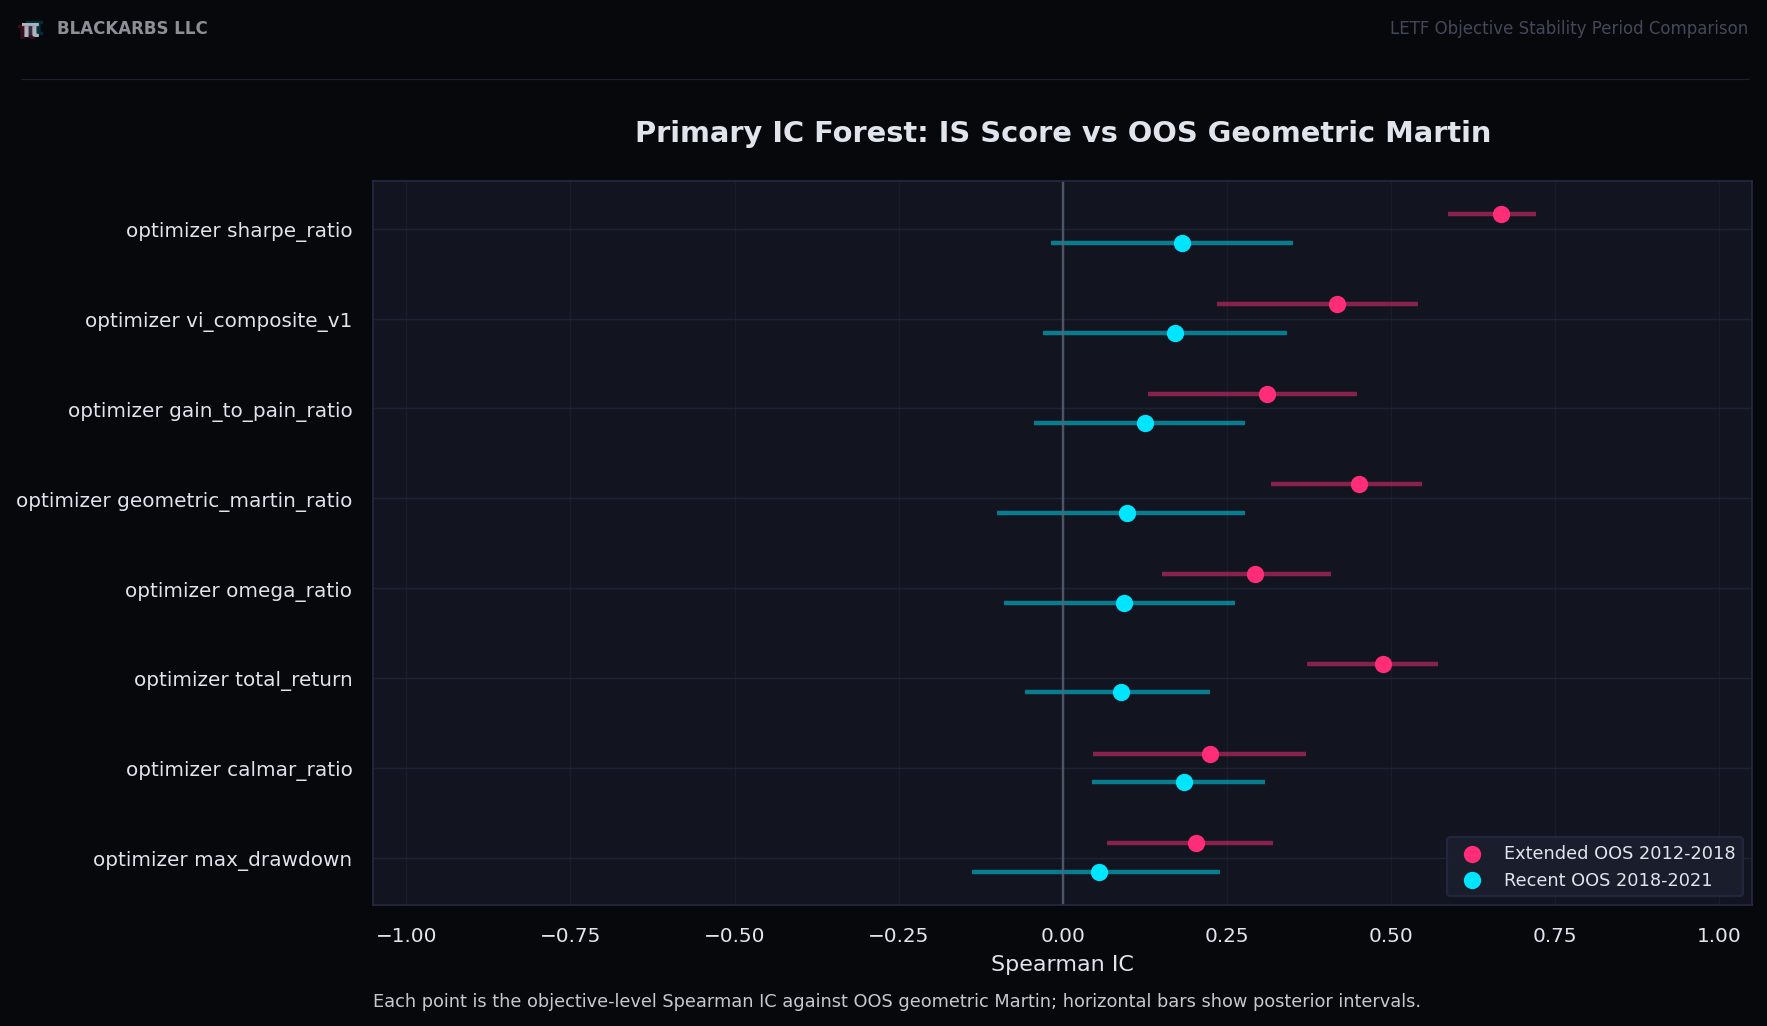
Figure 4: The IC chart shows whether an optimizer target's in-sample ranking was actually predictive of future geometric Martin.
The Result
The result was more interesting than I expected.
Optimizing directly for geometric_martin_ratio did not become the best stability target.
It did well in some places. In the recent period, it produced the strongest OOS geometric-Martin level. But once I included predictiveness and stability across periods, it did not beat Sharpe or VI composite.
The longer holdout was especially important:
| Target | Recent stability rank | Longer stability rank | Longer OOS GM | Longer GM IC | Read |
|---|---|---|---|---|---|
| Sharpe | 2 | 1 | 13.388 | 0.668 | Best longer-period path score and strongest longer-period predictiveness. |
| VI composite | 1 | 2 | 7.579 | 0.418 | Best recent stability rank; still competitive in the longer test. |
| Gain-to-pain | 7 | 2 | 7.435 | 0.311 | Improved sharply in the longer test, but weaker recent stability. |
| Geometric Martin | 4 | 4 | 6.816 | 0.451 | Optimizing the judging metric directly did not beat Sharpe or VI on stability. |
| Max drawdown | 8 | 7 | 6.221 | 0.202 | Better as a veto or diagnostic than the primary optimizer objective. |
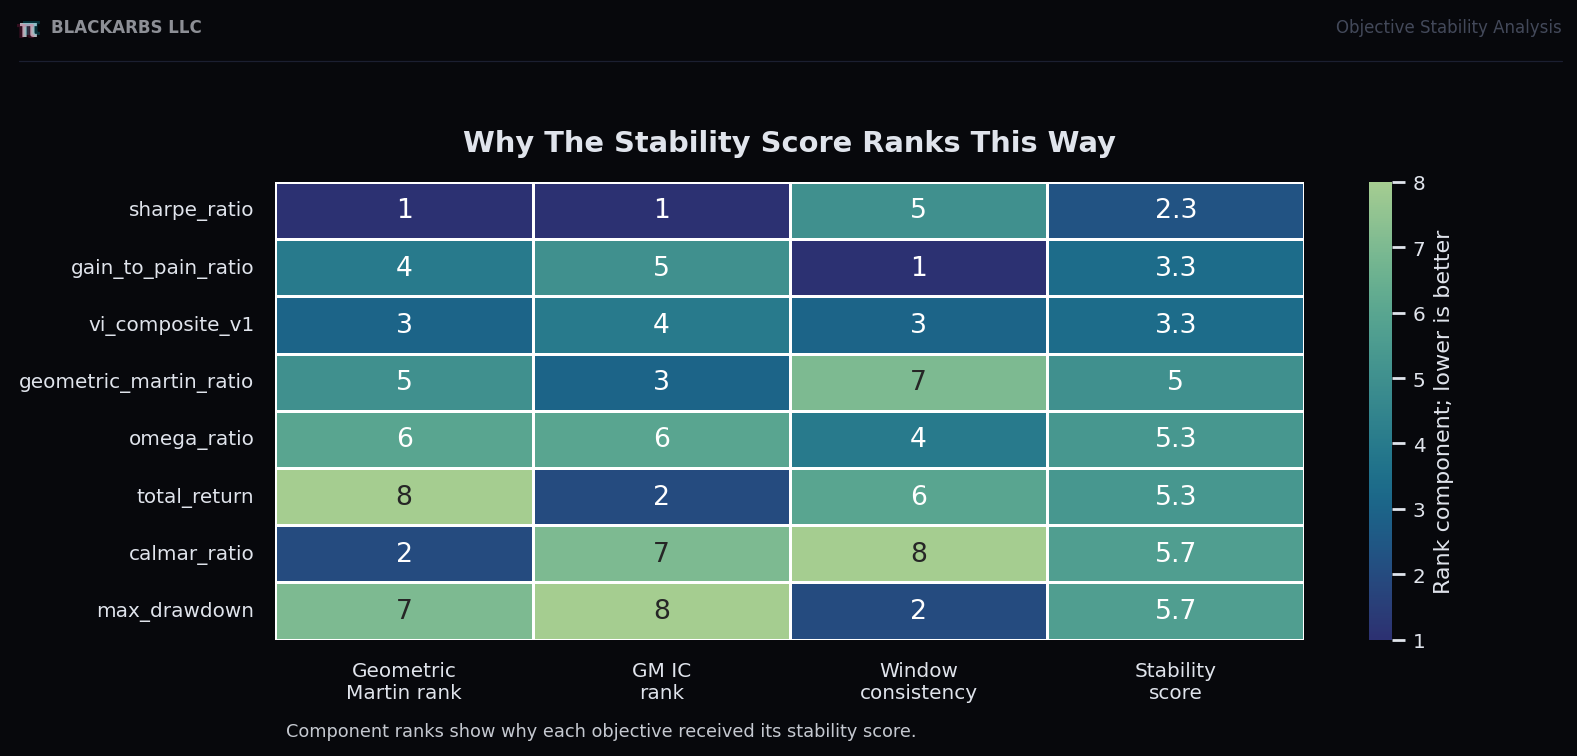
Figure 5: The final ranking is not one metric. It is the average of OOS geometric Martin rank, geometric-Martin IC rank, and window-consistency rank.
The Main Lesson
The metric you use to judge an optimizer does not automatically have to be the metric you optimize directly.
That was the biggest takeaway from this experiment.
Geometric Martin still makes sense as the out-of-sample judging rule because it captures what I care about: compounding adjusted for path pain. But the optimizer objective that best finds good future geometric Martin can be something else.
In this run, Sharpe and VI composite remain the current finalists.
Sharpe looked best in the longer holdout. VI composite looked strongest in the recent period and remained competitive in the longer test. Geometric Martin remains useful as the OOS evaluation rule, but the direct geometric-Martin optimizer did not become the best stability target.
Max drawdown also remains useful, but not as the primary objective. I view it more as a veto, guardrail, or diagnostic.
Why This Matters
Most optimization workflows quietly assume that the objective with the best historical score is the objective worth trusting.
I do not think that is enough.
For this kind of strategy, I want an objective that does three things:
- produces strong future path quality,
- has an in-sample score that predicts out-of-sample behavior,
- and does not depend on one or two lucky walkforward windows.
That is a much stricter bar than "best backtest."
The practical lesson is simple:
Optimization is not just about finding the highest historical score. It is about selecting objectives that remain predictive out of sample.
Disclosure: This is educational research-process review only. It is not personalized investment, trading, legal, tax, or financial advice.
Interactive Slide Report
The full slide report is embedded below. It is easier to inspect in a wider view, so I also recommend opening it in a separate tab.