Part 3 of 3
Two parts of this series called it the wallet. It has a handle, and the handle names the thing we had been failing to model. It is also the reason we still cannot trade it.
The handle is vega7. Vega was a clue.
In options pricing, the sensitivities have names. Delta is sensitivity to the price of the underlying. Theta is sensitivity to time passing. Vega is sensitivity to volatility: how much the option's value moves when the expected size of future moves changes. It is also the odd one in the set, because it is not a Greek letter. It is a name traders adopted, and it stayed.
In a five-minute Bitcoin contract the question looks directional. Up or down. But the price of a cheap ticket is not really a statement about direction. It is a statement about whether the remaining move can cross the distance to the strike before the window closes. The strike here is the window's opening reference, TWAP60 at the open. The distance is how far the current price sits from that reference.
What the ticket actually prices
A one-cent ticket says the far side, the side the price gives the smaller chance, is about one percent likely. That price can be wrong in two ways. The move can be larger than the market expects, in which case a side that looked far away is not far away at all. Or the move can be smaller, which is what usually happens, and the ticket expires worthless. The first case is what vega measures: how the ticket's value responds to the size of the remaining move, rather than to its direction.
The reframe is simpler than it looks. The wallet does not guess up or down. It bets that the market has priced the volatility wrong. The chance that a move is big enough to cross the strike is higher than the ticket price implies. You pay one cent as a taker for the side the market has priced as a long shot. If the real odds are better than one cent, that is the trade. Small distance to the strike, larger expected move, cheap ticket. That is a vega bet in the only instrument the venue offers: a five-minute binary.
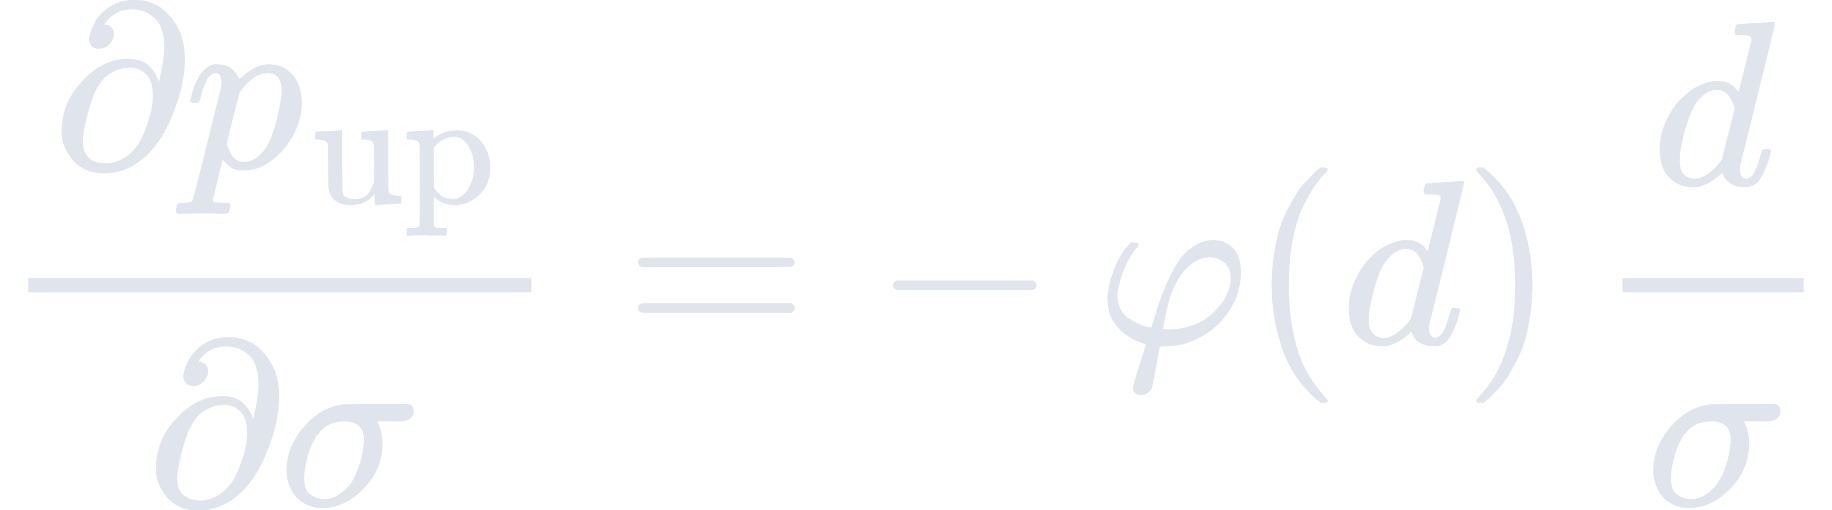
Read this as a sensitivity, not as a formula. The symbol φ is the height of the normal curve at d. Turn volatility up and the distance d gets smaller. Both sides then move toward even money. The long shot gets a better chance and the favourite gets a worse one. Nothing about direction changed. Only the size of the move you expect changed, and the ticket pays for that size.
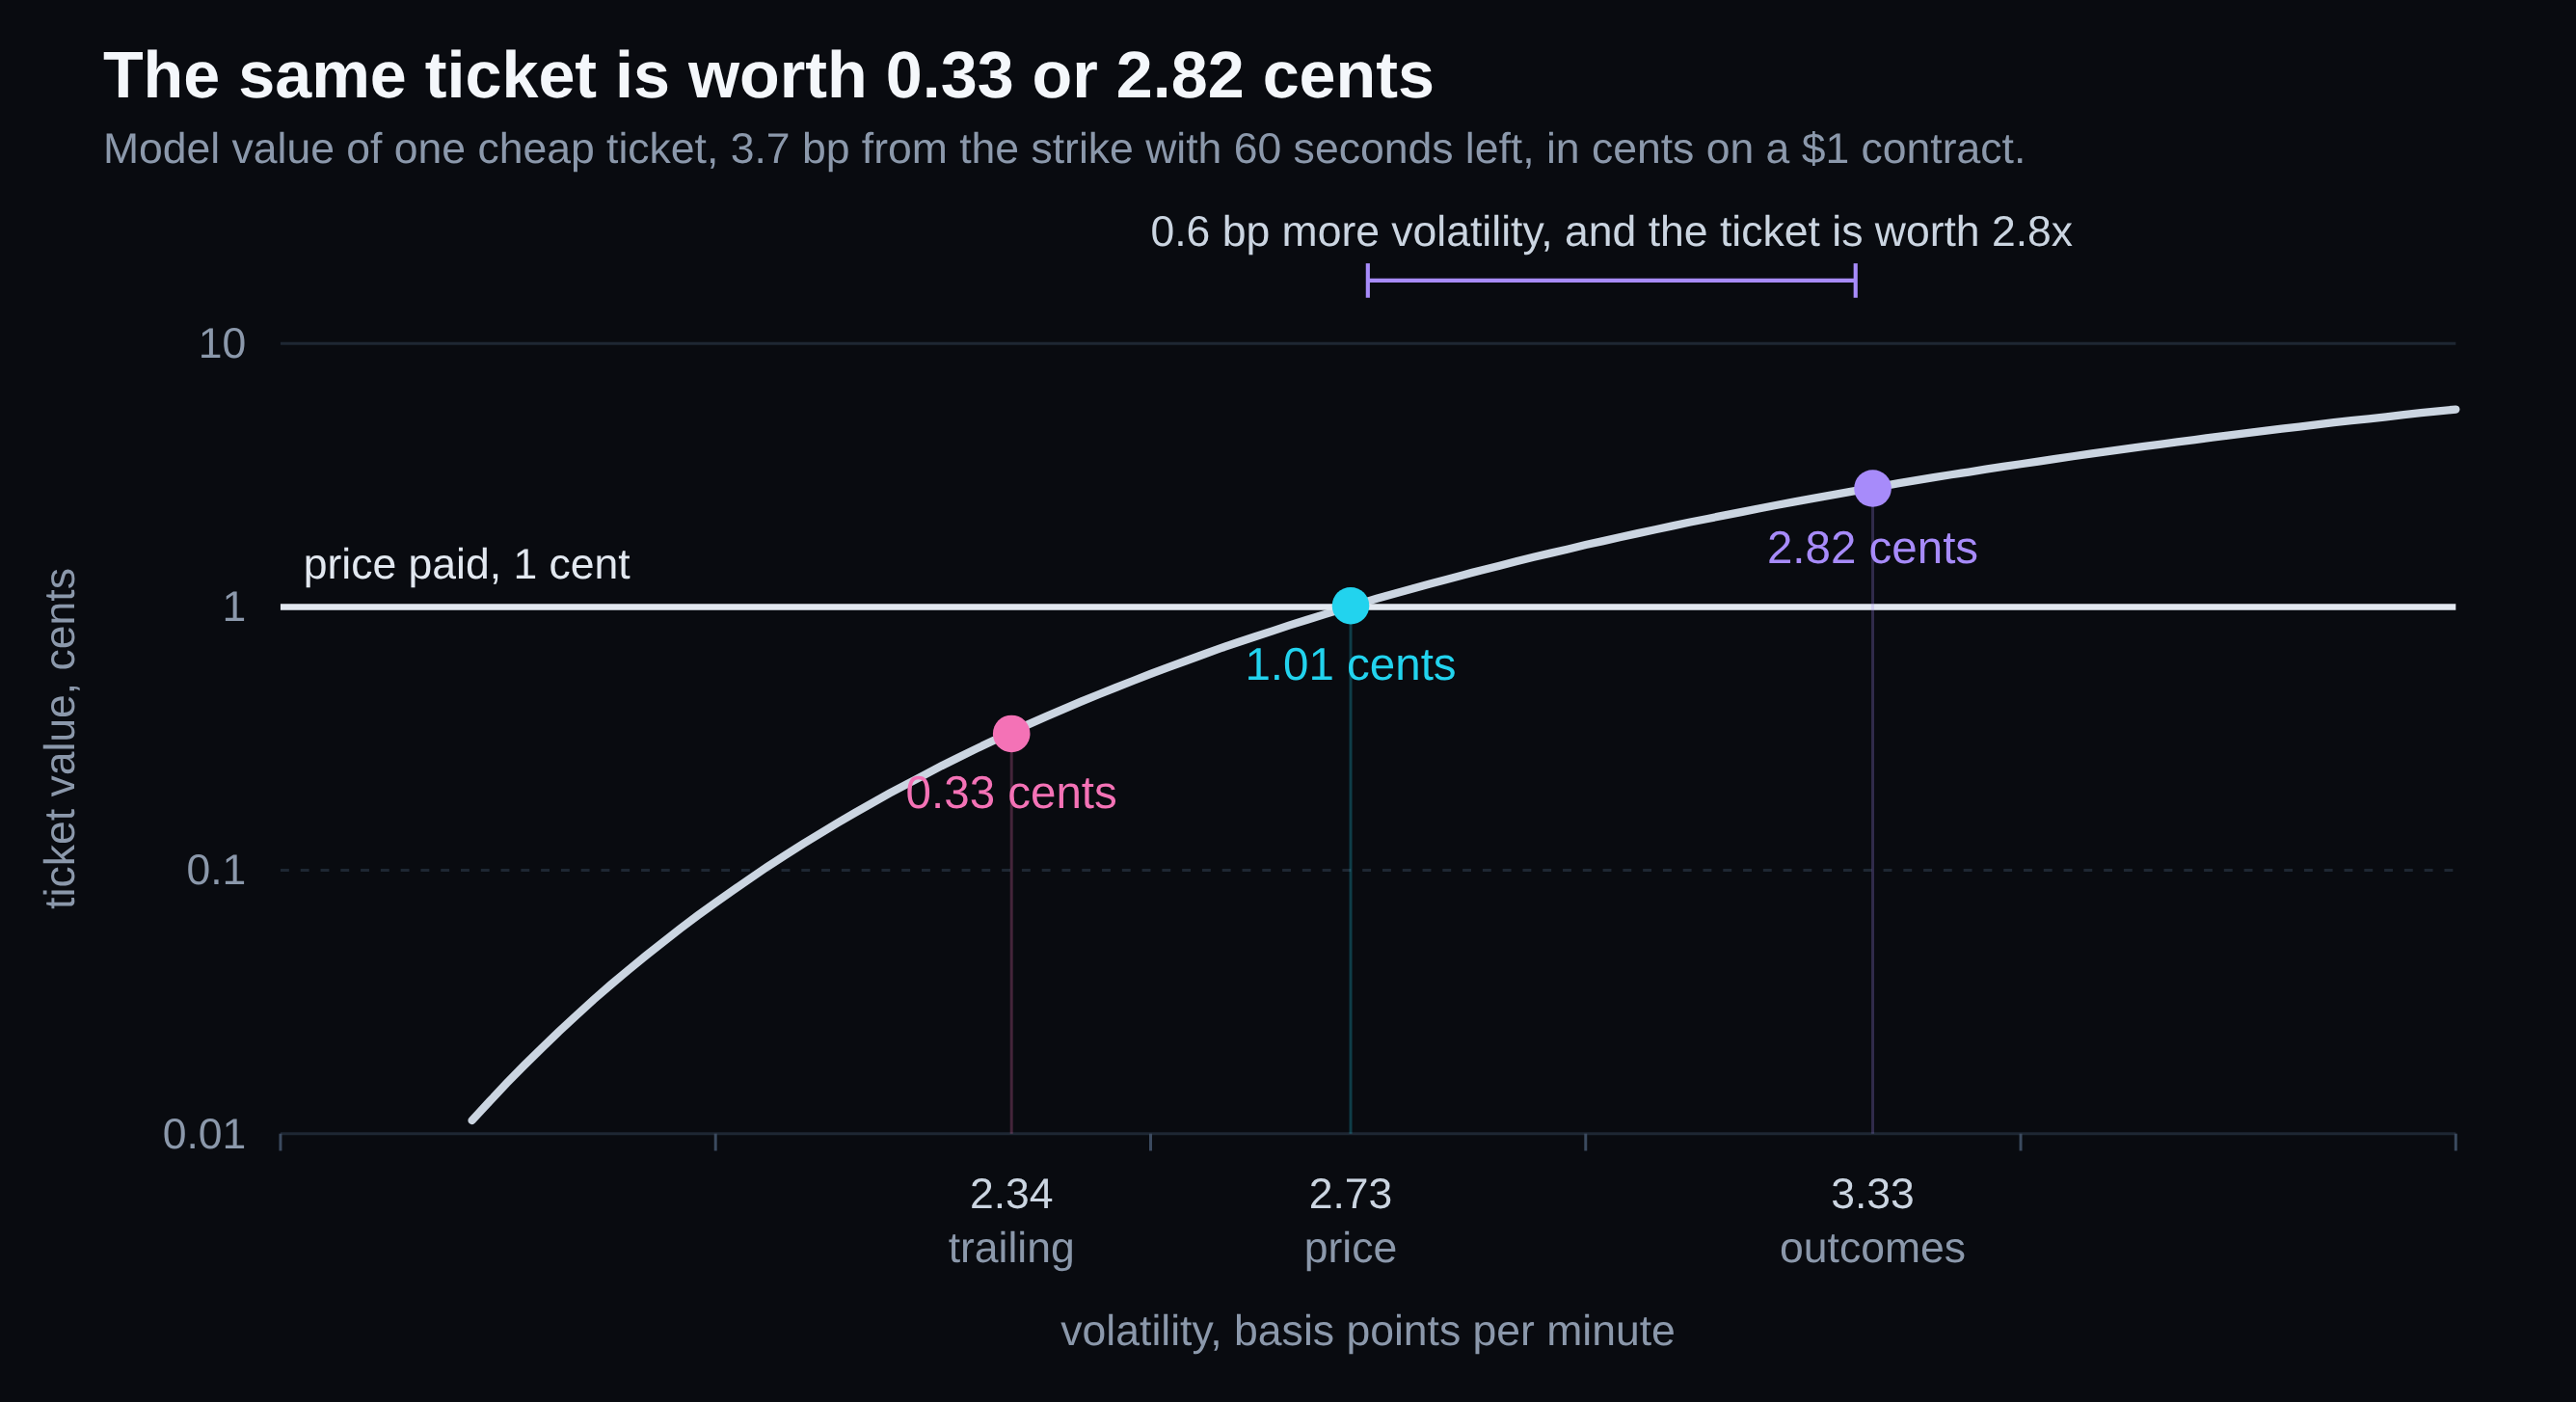
It fits. It is not a proof.
Testing it without the name
Here is how to test it without appealing to the name. Build a path model that knows only public information: the strike, the remaining time, the observed path, the recent volatility. Ask it for the probability of the side the wallet bought, at the moment it bought. Then ask the same question of matched controls, other people's cheap entries at the same price and the same offset into the window.
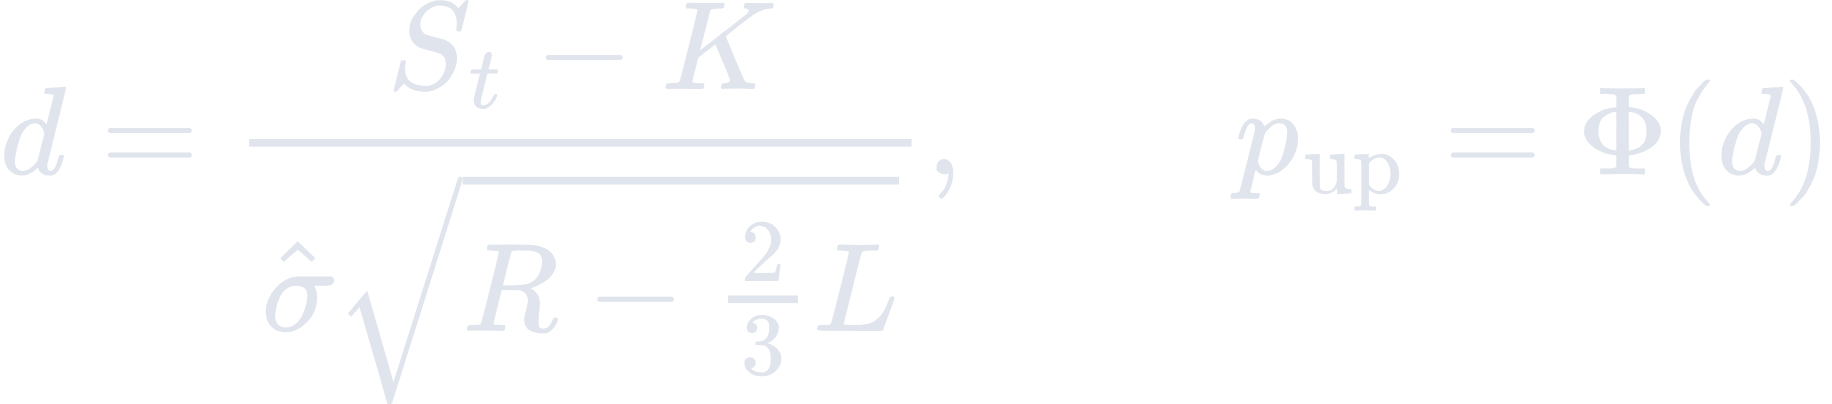
K is the strike, the 60-second average at the window's open. St is the price now. σ̂ is recent realised volatility, a measure of how much the price has been moving. R is the number of seconds left in the window. L is the length of the settlement average, 60 seconds. Φ turns a distance into a probability. The model uses public inputs only: the strike, the time left, the path so far, and recent volatility.
L needs one more sentence. Settlement does not read one price at the close. It reads an average of the last 60 seconds. An average cancels some of the noise at both ends of that minute, so the average moves less than a single price does. The term R − 2L/3 is that smoothing. With no averaging window it becomes plain R, which is the textbook answer.
In the matched 240 to 270 second band, the wallet's cheap sides carry about 2.7 times the model probability of the controls, and they win about 9 times as often. Regressing the log of that probability on a wallet indicator, the log price and an offset control gives a coefficient of +0.983, with a standard error of 0.096. Ten standard errors from zero is not a rounding error.

β is the wallet indicator on a log scale, so the coefficient is a multiplier: exp(0.983) is about 2.7. The offset control holds the position inside the window fixed, and the price control holds the ticket price fixed, so the wallet coefficient is not a re-statement of either.
Part 2 ran a smaller version of this test and found nothing: 4 wins in 103 wallet entries against 3 in 142 controls, p = 0.46. That sample was 245 forward prints. At those counts a difference this size is invisible, so the null there is not evidence of no effect. The panel used here draws 5,220 matched controls at the same price and offset, which is why the question is answerable now and was not then.
Jumps, not direction
The path model does one thing well. It can tell when a large move is coming. It cannot tell which side of the strike that move will land on. A big move is about as likely to go against the cheap side as for it. What the model detects is a volatility state, and inside that state the direction is still close to a coin flip.
That is exactly the shape of the wallet's bet. A directional trader has to be right about up or down. A volatility trader buying cheap tails does not. He needs the move to be large, and he needs to have bought the side the large move happens to favour. If the state is right, the far side stops being a lottery ticket and becomes a mispriced one.
Why the rule does not transfer
Then we tried to use it. If the state is the edge, a mechanical threshold that detects the state should reproduce the result. We tested it in the band he actually trades, 1 to 2 cents, with a rule that buys every cheap side the state flags.
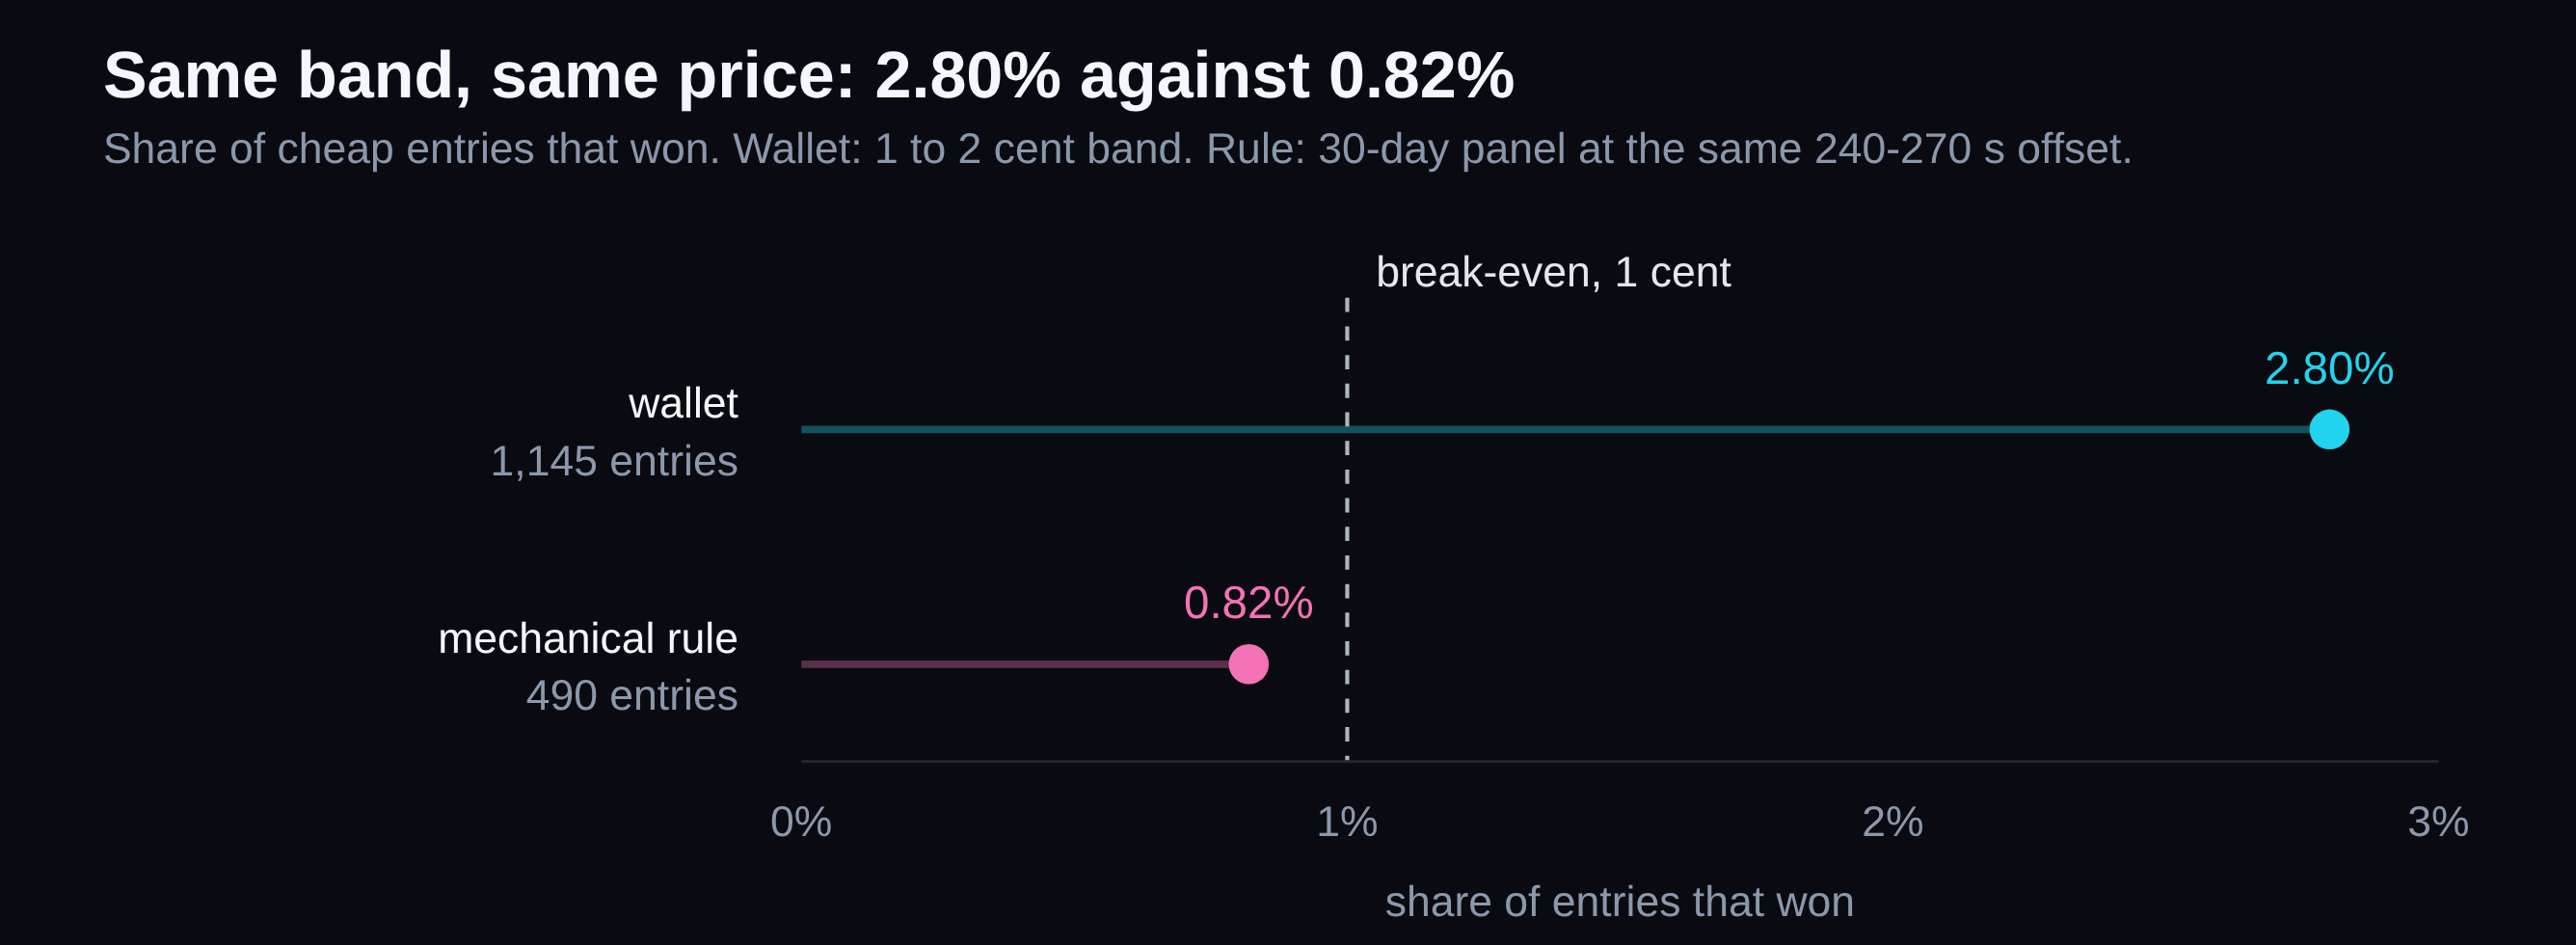
The ranking score says the same thing from another angle. The area under the curve was 0.64 on his own entries, meaning the model puts a winner above a loser 64 times in 100 against a coin flip's 50. On the mechanical population it fell to 0.52, which is no sorting at all. The signal describes his selection. It does not transfer to the market.
The state explains the winners. A threshold on the state does not produce the trade.
What the record still says
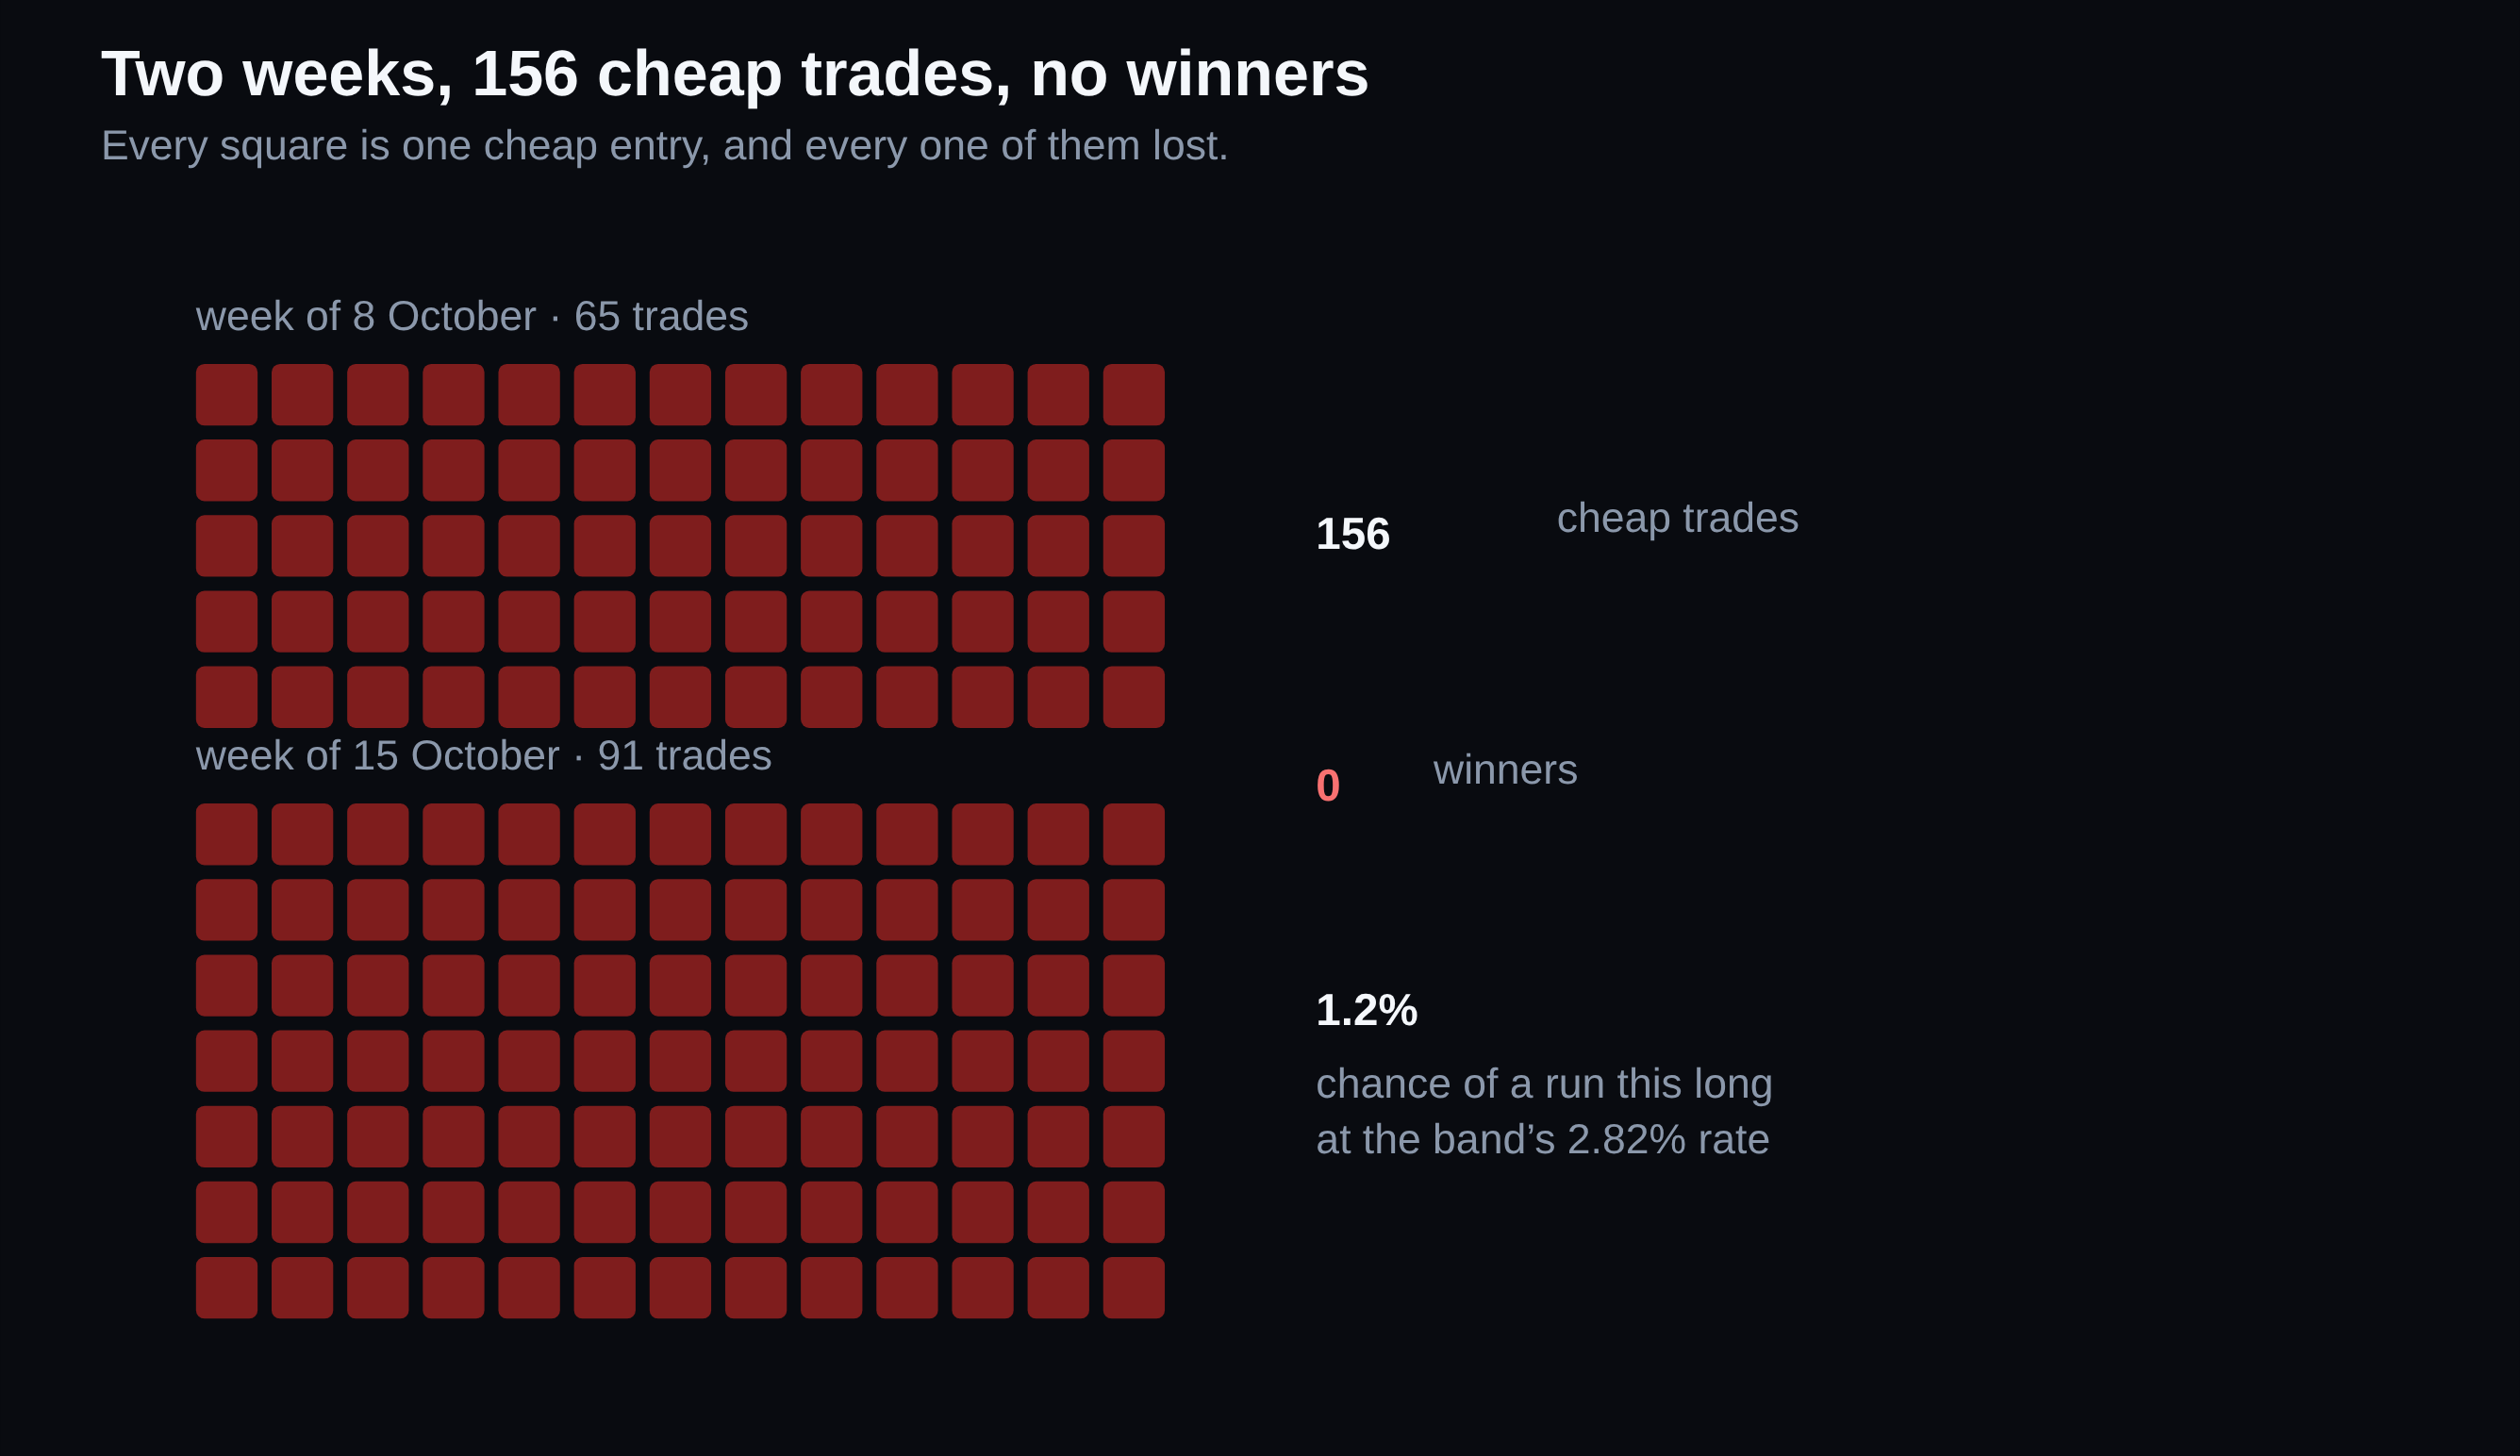
Even inside the band window, the result is not a line. Two consecutive weeks in October lost all 156 of the cheap trades placed in them, at a 2.82% base rate that carries about a 1.2% chance. That is not zero. But a lane whose whole payoff is a 2.82% event has to survive two weeks of zeros before anyone sizes it.
The best-looking slice makes the same point from the other side. The strongest seven-day stretch earned $4,538. Remove its three best contracts and the same week is minus $139.17. Three settlements carried the week.
What survived
| Test | Window | Result |
|---|---|---|
| Model probability vs matched controls | 240-270 s | 2.7x the controls |
| Realised win rate, same comparison | 240-270 s | about 9x the controls |
| Regression on log model probability | 240-270 s | +0.983 (se 0.096, t 10.28) |
| Wallet vs a mechanical rule | 1-2c, 30-day | 2.80% vs 0.82%, p = 0.0099 |
| Two consecutive October weeks | two weeks | 156 trades, 0 wins (1.2%) |
| Best seven-day slice, minus its top three | seven days | −$139.17 |
Every row carries its own window, because the window is part of the claim. No row is a projection of another.
Four things, and only four.
- Cheap bets in this wallet's hands are profitable at the lifetime sample.
- The mechanical cheap tail has no executable edge. The same band bought without the selection loses $23,579 across 2,407 contracts, and $4,267 across 1,000 under the stricter entry rule.
- The book mid is the best predictor of the outcome anyone here has built, including us.
- We could not identify the selector from the public data we hold.
What we are still exploring is how to translate this finding into a trading rule. The description is precise: cheap side, small distance to the strike, large expected move, late in the window. It is measurable in aggregate, against matched controls, at the same prices and offsets. It does not yet say which minute to act on, and we have not found a rule in the public record. To that end we started collecting real order-book data this month. A missing rule says more about the data we hold than about what exists.
So the name is a good description and a weak proof. Whether vega is the whole mechanism, or one visible shadow of one we never found, this data cannot settle.
Part 1 asked how a wallet that loses nine bets in ten comes out ahead. Part of the answer is the shape above. The rest is the payoff: the few winners pay for the many losers. The handle promised sensitivity to volatility, and volatility is what the evidence shows.
Part 3 of 3. The wallet is named here for the first time: the handle is vega7. The address is not published. The wallet figures come from the band window, 23 July to 29 October 2026, which covers 4,332 contracts. The matched-panel numbers come from the 240 to 270 second offset inside that window, and the mechanical-rule control is built on the 30-day panel at the same offset. Correction carried from Part 1: the lifetime cheap-tail ratio is 2.36x over 1,337 positions from 19 April to 3 November. The 2.95x belongs to the three-month window Part 1 prints, and that window is measured correctly.
The series: Part 1, the wallet that wins 8% of the time, and Part 2, five things the tape taught us.
I am taking on new work through BlackOps. Premium trading infrastructure automation. If you already have a strategy running on your own machine and you want it automated and deployed properly, with the data certification, scheduling and monitoring that make it survive contact with a live account, start a consultation.
Or build the skill yourself. If you would rather learn to build systems you can trust than hire someone to prove them, that is Forge Learn: one strategy taken from raw data through data certification, walk-forward validation, paper execution, scheduling and monitoring. Eleven units, self-paced, no live capital required.
Write me directly at bcr@blackarbs.com.
This is independent, historical research on public prediction market records. It is not financial, investment or trading advice, and it is not a recommendation to buy or sell any contract on any venue. Prediction market contracts can expire worthless. The profit and loss figures are reconstructions from public trade records; they exclude fees, queue position, partial fills and available depth, and they are not statements of withdrawable profit. The account is public; its handle is named in this piece and its address is withheld. We are not affiliated with, endorsed by, or compensated by Polymarket. Past results do not predict future results.