COMPOSITE MACRO ETF WEEKLY ANALYTICS (2/20/2016)
/FOR A DEEPER DIVE INTO ETF PERFORMANCE AND RELATIVE VALUE SUBSCRIBE TO THE ETF INTERNAL ANALYTICS PACKAGE HERE
LAYOUT (Organized by Time Period):
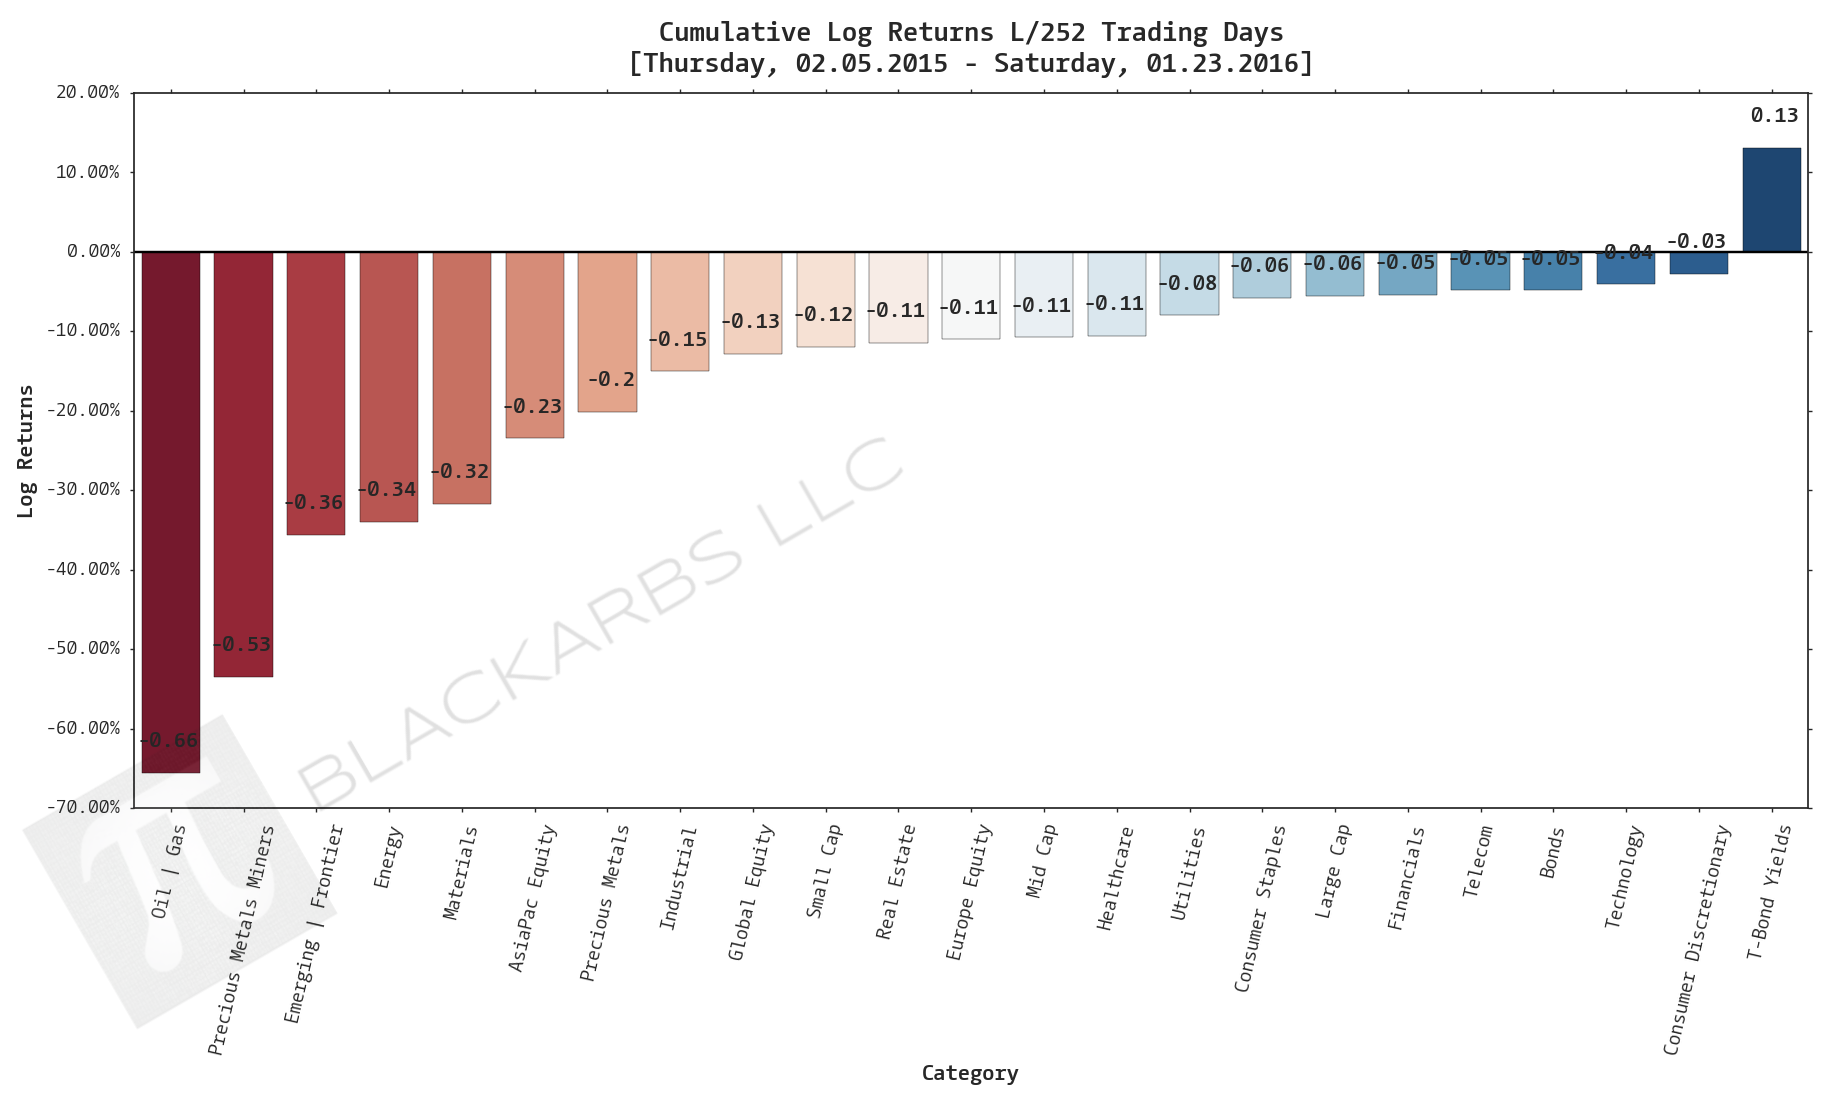
Composite ETF Cumulative Returns Momentum Bar plot
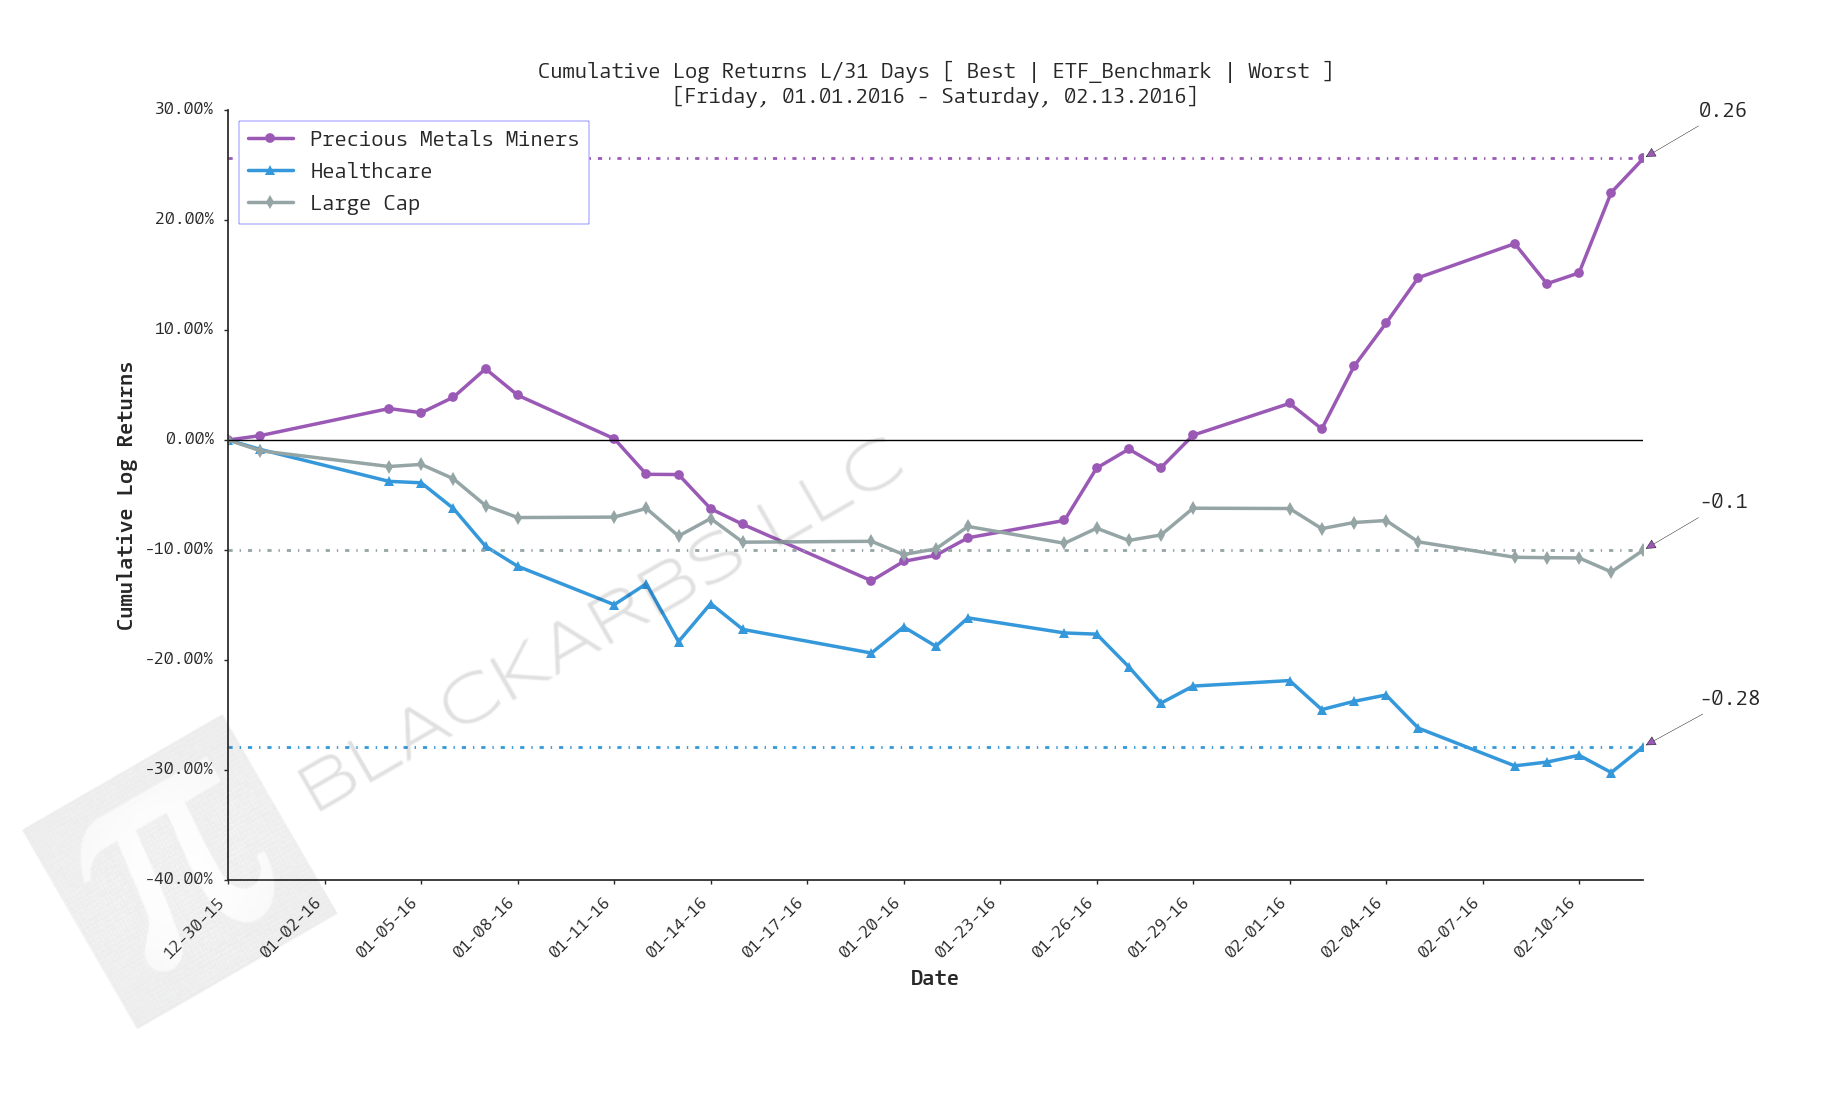
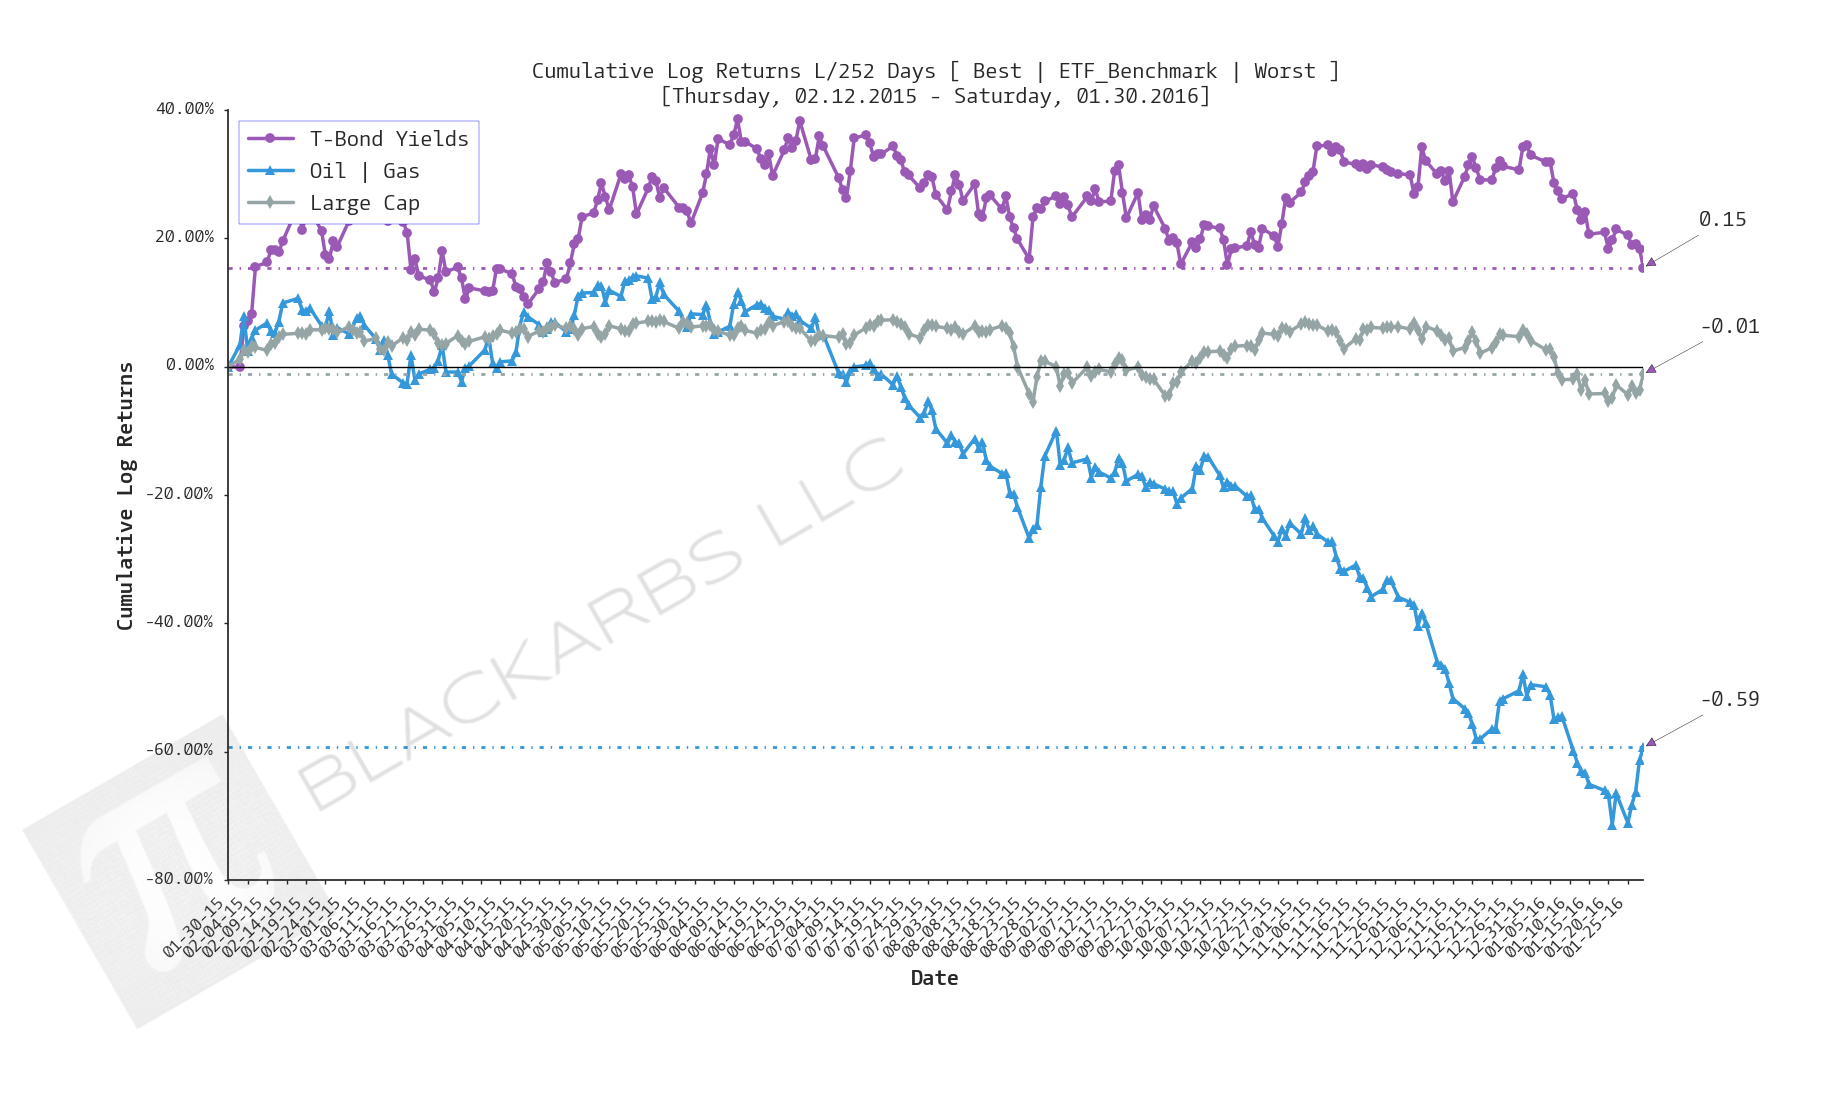
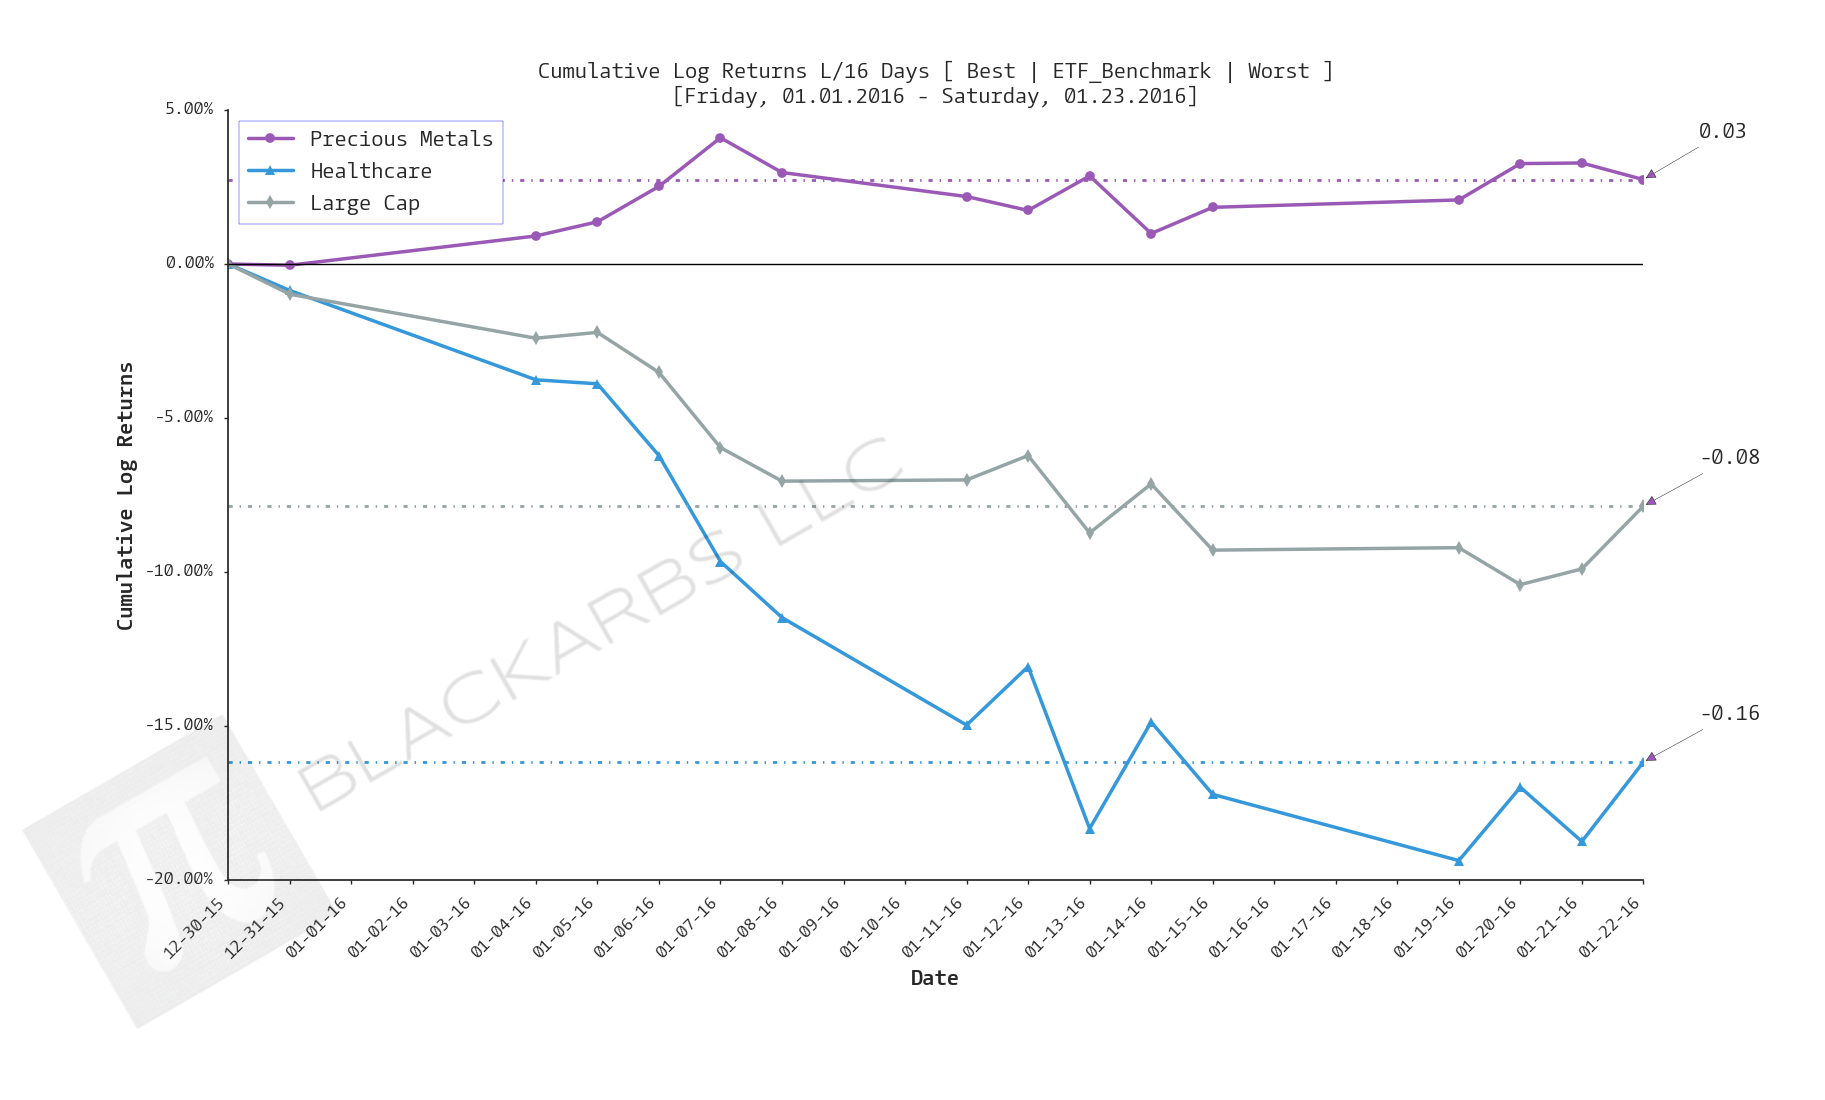
Composite ETF Cumulative Returns Line plot
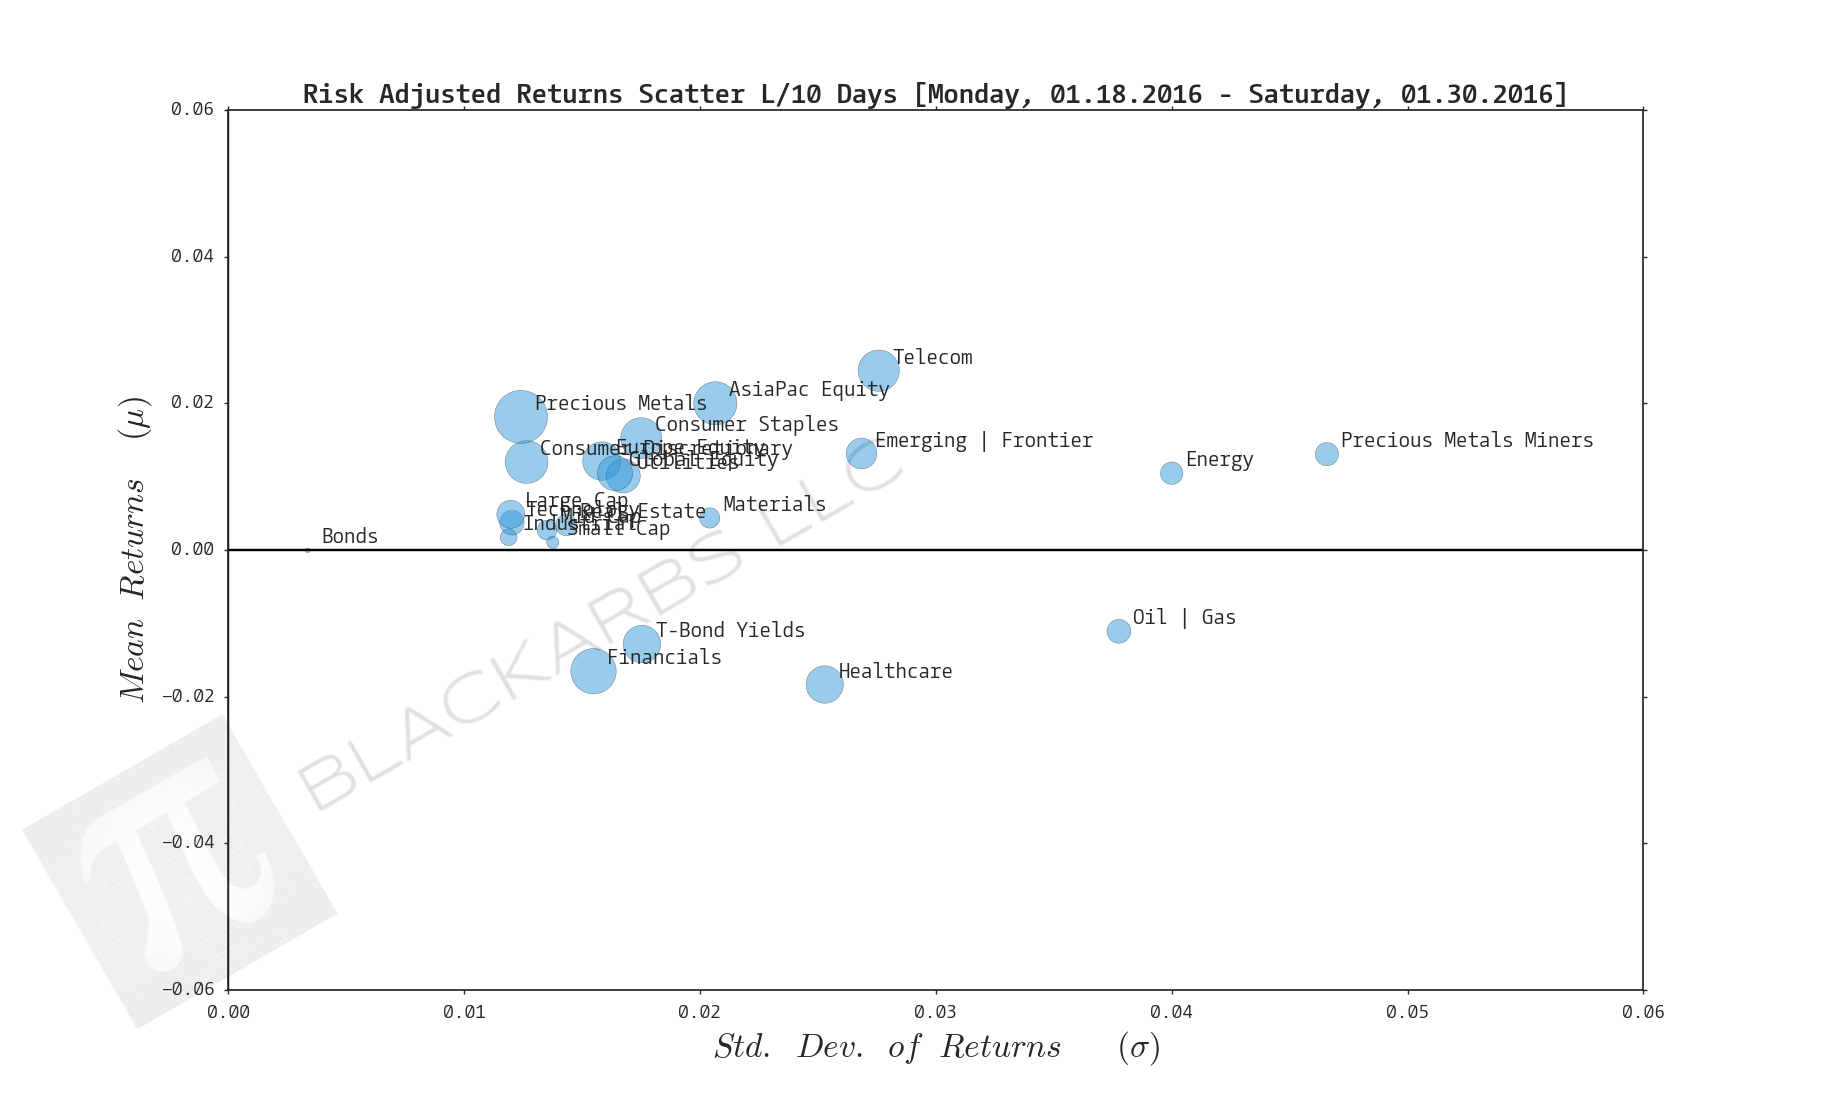
Composite ETF Risk-Adjusted Returns Scatter plot (Std vs Mean)
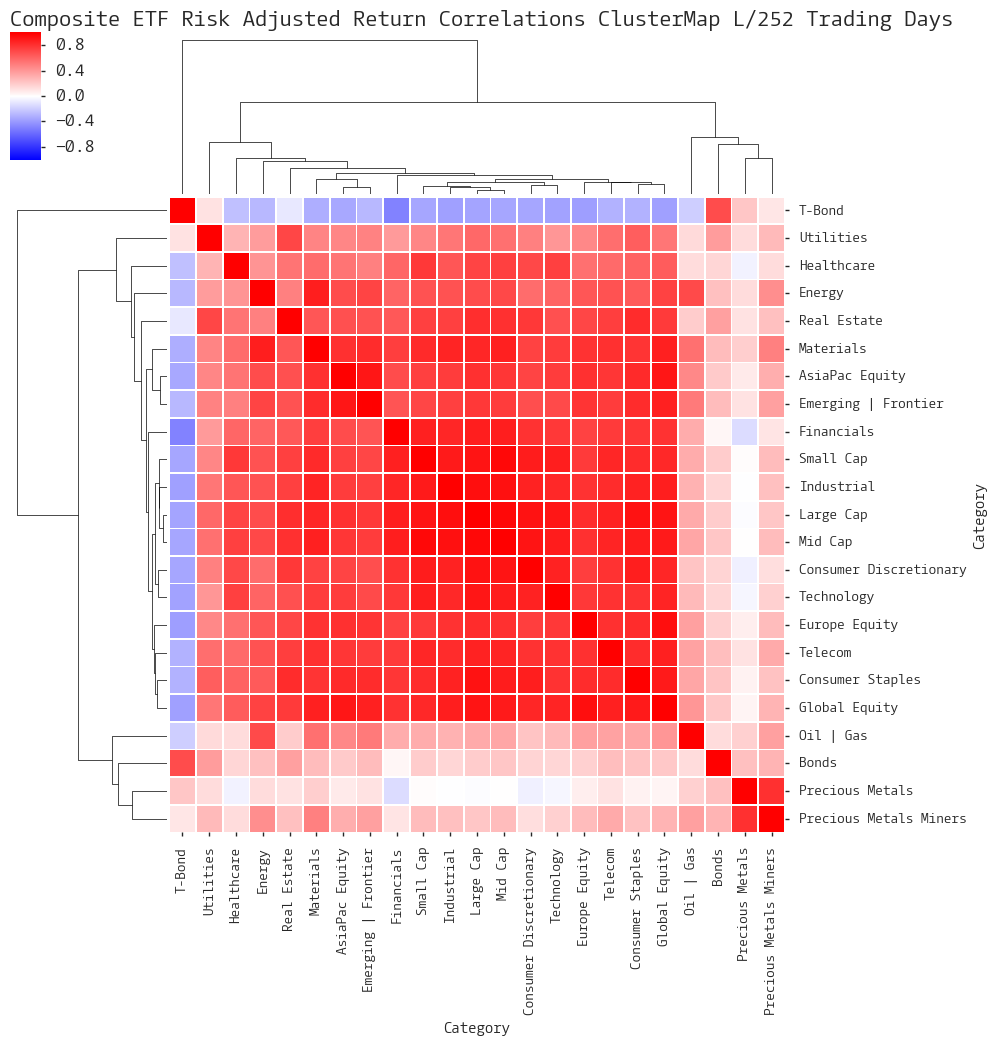
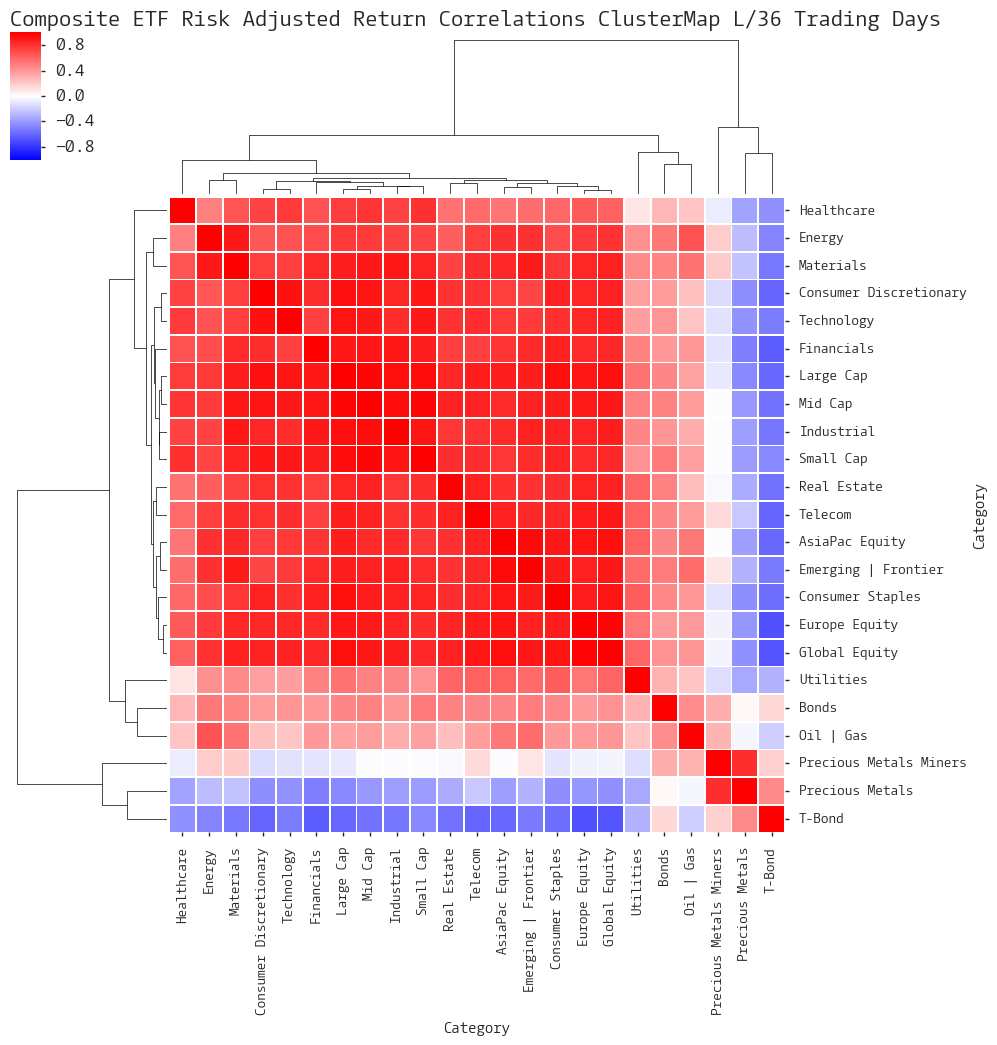
Composite ETF Risk-Adjusted Return Correlations Heatmap (Clusterplot)
Implied Cost of Capital Estimates
Composite ETF Cumulative Return Tables
Notable Trends and Observations
COMPOSITE ETF COMPONENTS:
LAST 252 TRADING DAYS


LAST 126 TRADING DAYS


LAST 63 TRADING DAYS


Year-to-date LAST 36 TRADING DAYS


LAST 21 TRADING DAYS


LAST 10 TRADING DAYS


Implied Cost of Capital Estimates:
To learn more about the Implied Cost of Capital see here.
CATEGORY AVERAGE ICC ESTIMATES
ALL ETF ICC ESTIMATES BY CATEGORY
Cumulative Return Tables:
Notable Observations and Trends:
- Unfortunately not much has changed this week. Many of the themes I identified last week appear to be ongoing.
- Defensive positioning is still prevalent as Precious Metals Miners and Precious Metals have continued to outperform.
- The relative strength of the Emerging/Frontier and Consumer Discretionary composites over the last 21 and 10 days respectively is somewhat interesting. This gives the appearance of "Risk-On" but the other evidence implies investors should tread carefully.
- My current working theory is that T-Bonds provide a safe yield for global investors given the increasing popularity of NIRP. The corollary to that thesis is that the Precious Metals complex acts like a put on runaway Central Bank policy. It is likely that Precious Metals will continue to show relative strength until NIRP is removed from the Federal Reserve's policy discussion.