BACKTESTING THE IMPLIED VOLATILITY STRATEGY WITH QUANTOPIAN (5/20/16)

BACKTESTING THE IMPLIED VOLATILITY STRATEGY WITH QUANTOPIAN (5/20/16)

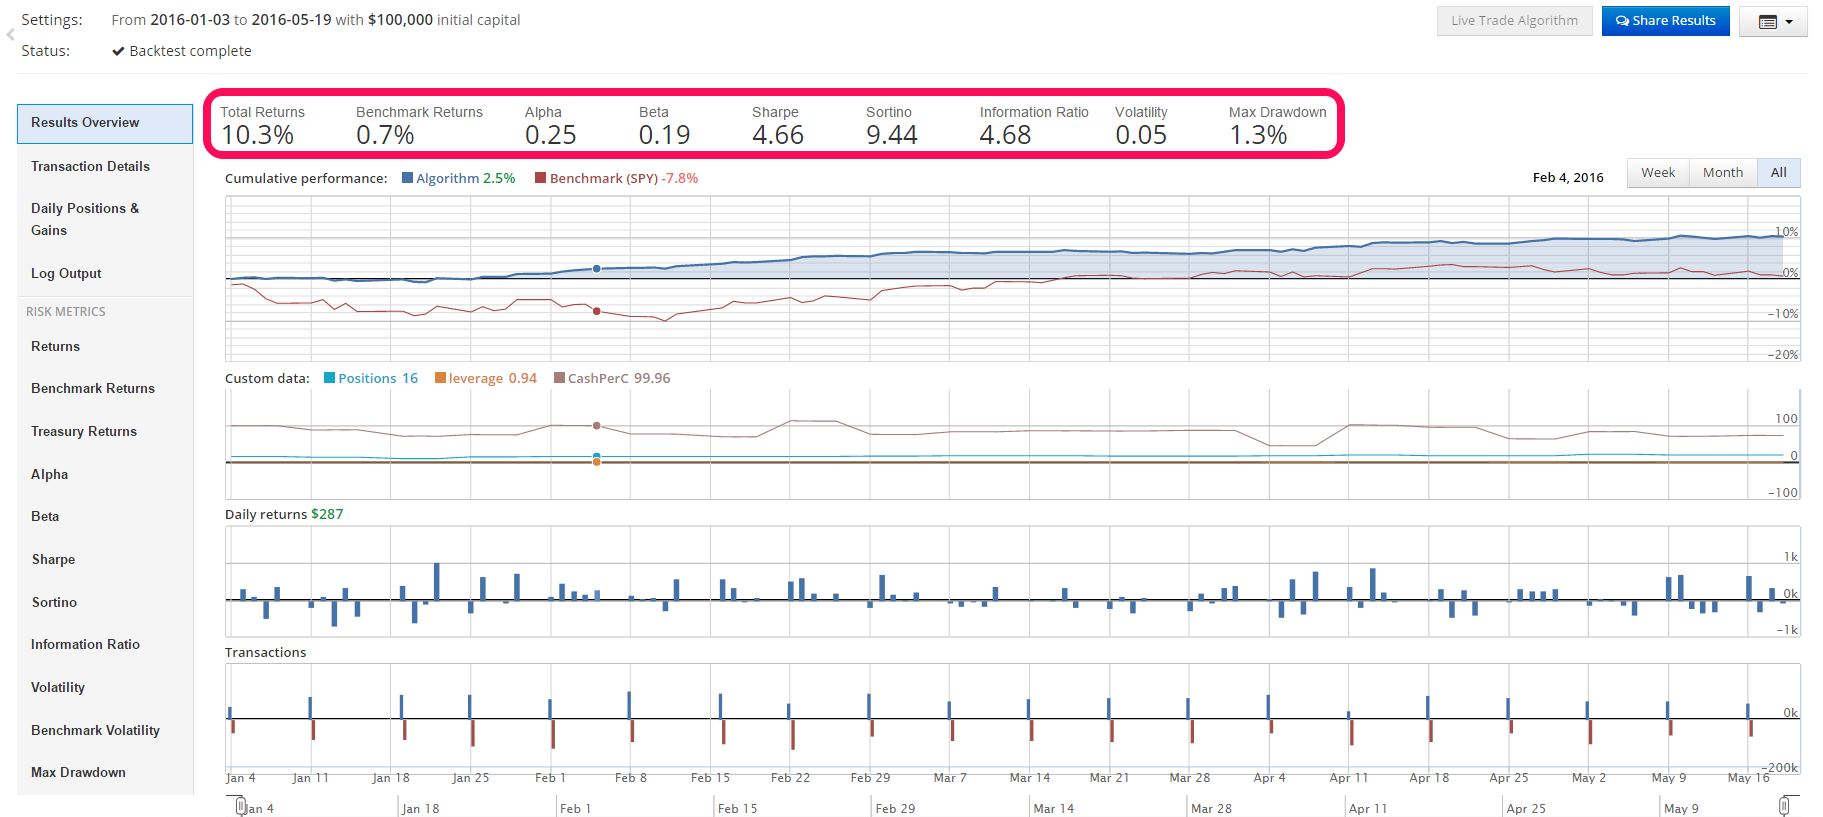
We are now 19 weeks into testing this strategy and the results are strong. Since the last published backtest, the volatility of the strategy has declined from 6% to 5%, beta has declined from 0.20 to 0.19. Alpha has increased from 19% to 25%. The Sortino and Information Ratios have increased from 6.41, and 1.63 to 9.44 and 4.68 respectively.  On an absolute return basis the strategy is crushing the SPY benchmark, 10.3% to 0.7%. 

Read More

USING IMPLIED VOLATILITY TO PREDICT ETF RETURNS (5/14/16)

USING IMPLIED VOLATILITY TO PREDICT ETF RETURNS (5/14/16)

To see the origin of this series click here

In the paper that inspired this series "What Does Individual Option Volatility Smirk Tell Us About Future Equity Returns?" the authors' research shows that their calculation of the Option Volatility Smirk is predictive of equity returns up to 4 weeks. Therefore, each week, I will calculate the Long/Short legs of a portfolio constructed by following their criteria as closely as possible. However this study will focus on ETF's as opposed to single name equities. I will track the results of the Long/Short portfolio, in equity returns, cumulatively for 4 weeks before rotating out of that portfolio. 

Read More

COMPOSITE MACRO ETF WEEKLY ANALYTICS (5/14/2016)

COMPOSITE MACRO ETF WEEKLY ANALYTICS (5/14/2016)

NOTABLE OBSERVATIONS AND TRENDS:

  • The healthcare composite has been a bottom 3 performer across all time frames. 
  • The Oil+Gas composite has been strong recently as a top 3 performer L/63, L/21, and L/10 days.
  • The Large Cap composite is essentially unchanged over the L/252 and L/126 days.
  • PMM has continued to outperform. The long gold and gold producers trade has been the trade of the year.
  • PMM is up 60% (log returns) over L/126 days!
  • An anecdotal observation: When every composite is all positive(negative) returns over the L/63 days or less, there has been a tendency for the markets to mean revert. Notice the return range compression for both best/worst performers over L/10 days. Seems like there is either a lack of catalysts or indecision among market participants. 
Read More

USING IMPLIED VOLATILITY TO PREDICT ETF RETURNS (5/08/16)

USING IMPLIED VOLATILITY TO PREDICT ETF RETURNS (5/08/16)

To see the origin of this series click here

In the paper that inspired this series "What Does Individual Option Volatility Smirk Tell Us About Future Equity Returns?" the authors' research shows that their calculation of the Option Volatility Smirk is predictive of equity returns up to 4 weeks. Therefore, each week, I will calculate the Long/Short legs of a portfolio constructed by following their criteria as closely as possible. However this study will focus on ETF's as opposed to single name equities. I will track the results of the Long/Short portfolio, in equity returns, cumulatively for 4 weeks before rotating out of that portfolio.

Read More