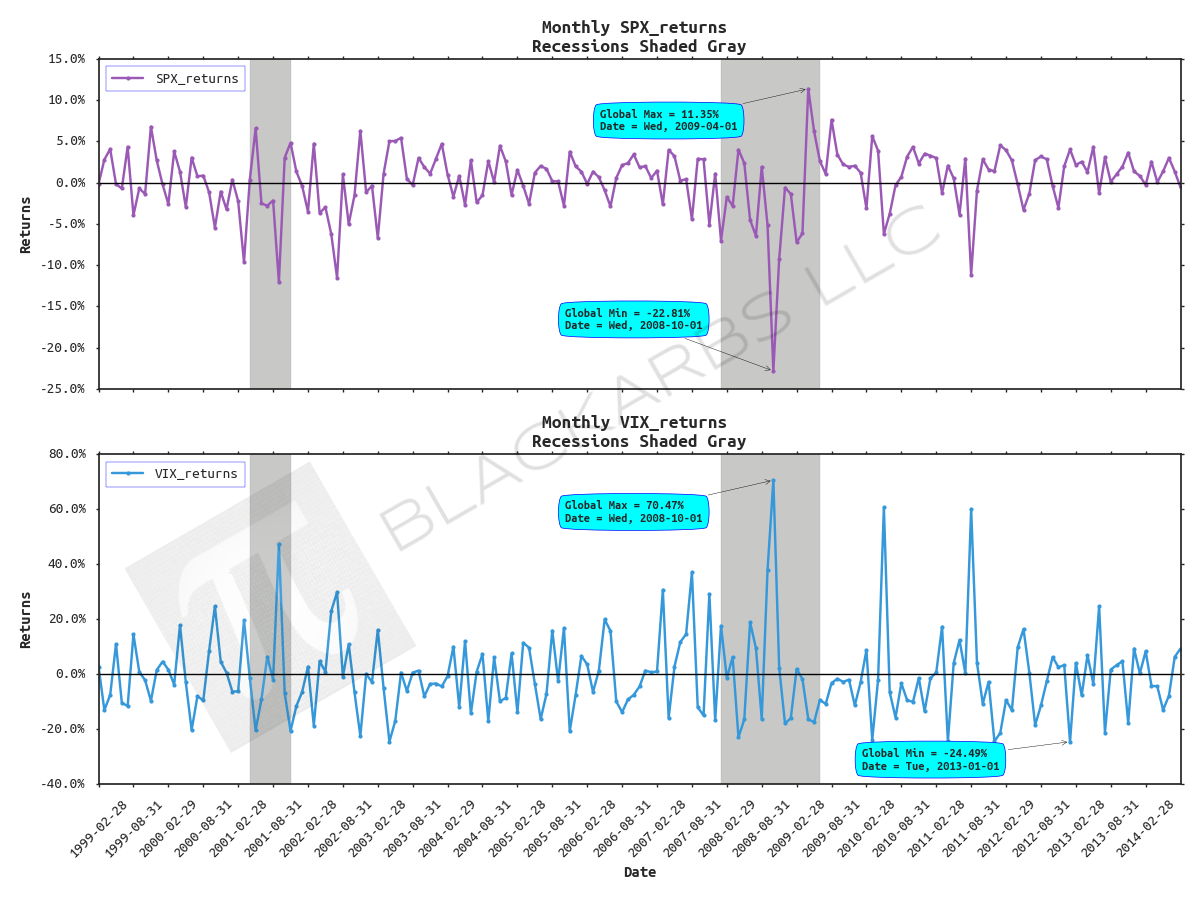
Advanced Time Series Plots in Python
/POST OUTLINE
- Motivation
- Get Data
- Default Plot with Recession Shading
- Add Chart Titles, Axis Labels, Fancy Legend, Horizontal Line
- Format X and Y Axis Tick Labels
- Change Font and Add Data Markers
- Add Annotations
- Add Logo/Watermarks


