1. The claim, and the fire
What we published in August 2026. One model family, two sportsbooks, 2022 to 2025:
- FanDuel +4.13% on 425 settled bets.
- DraftKings +7.17% on 537 settled bets.
- Add one rule, bet only when both models choose the same side: +10.05% at FanDuel, +10.40% at DraftKings, +10.23% combined across 588 book-bets on 294 games. That agreement rule was positive in every season in the published August report.
- The footnote in the same report was honest: the 95% confidence interval still included zero. Plainly: the range of outcomes we could not rule out included breaking even, so the result was consistent with luck.
- The two books were chosen before we had data on any other book. Plainly: we did not pick the winner after the fact, which is the most common way a backtest fools its author.
Then we lost the ability to check it. In October 2026 a destructive command wiped the local research data store. The incident is recorded, in full, in the investigation log. Git could not restore it, because the store was never tracked; the research lake is deliberately kept outside version control. The artifacts behind those numbers were not archived, not reproducible and not auditable.
So we could not investigate our own claim. We could only rebuild the inputs from raw sources and measure again, which is what the rest of this report is about.
That order matters, and it is the reason this piece exists. The interesting part of a result is not whether it was positive. It is whether you can still explain it a month later, and whether the person reading your number could repeat the work without you in the room.
2. The rebuild, and the numbers after it
The rebuild also surfaced two genuine bugs. Kickoff times had been converted from the wrong time zone, and the snapshot we treated as "72 hours before kickoff" was sometimes taken at the wrong moment, occasionally after the game had started. Everything built on the old data was invalid.
So here is the honest sequence, and the numbers on both sides of it:
| original (Aug 2026) | rebuilt on corrected data | |
|---|---|---|
| FanDuel | +4.13% on 425 bets | +3.37% on 637 bets |
| DraftKings | +7.17% on 537 bets | +4.88% on 609 bets |
| Cross-book agreement | +10.23% on 588 book-bets | +6.30% on 436 pairs |
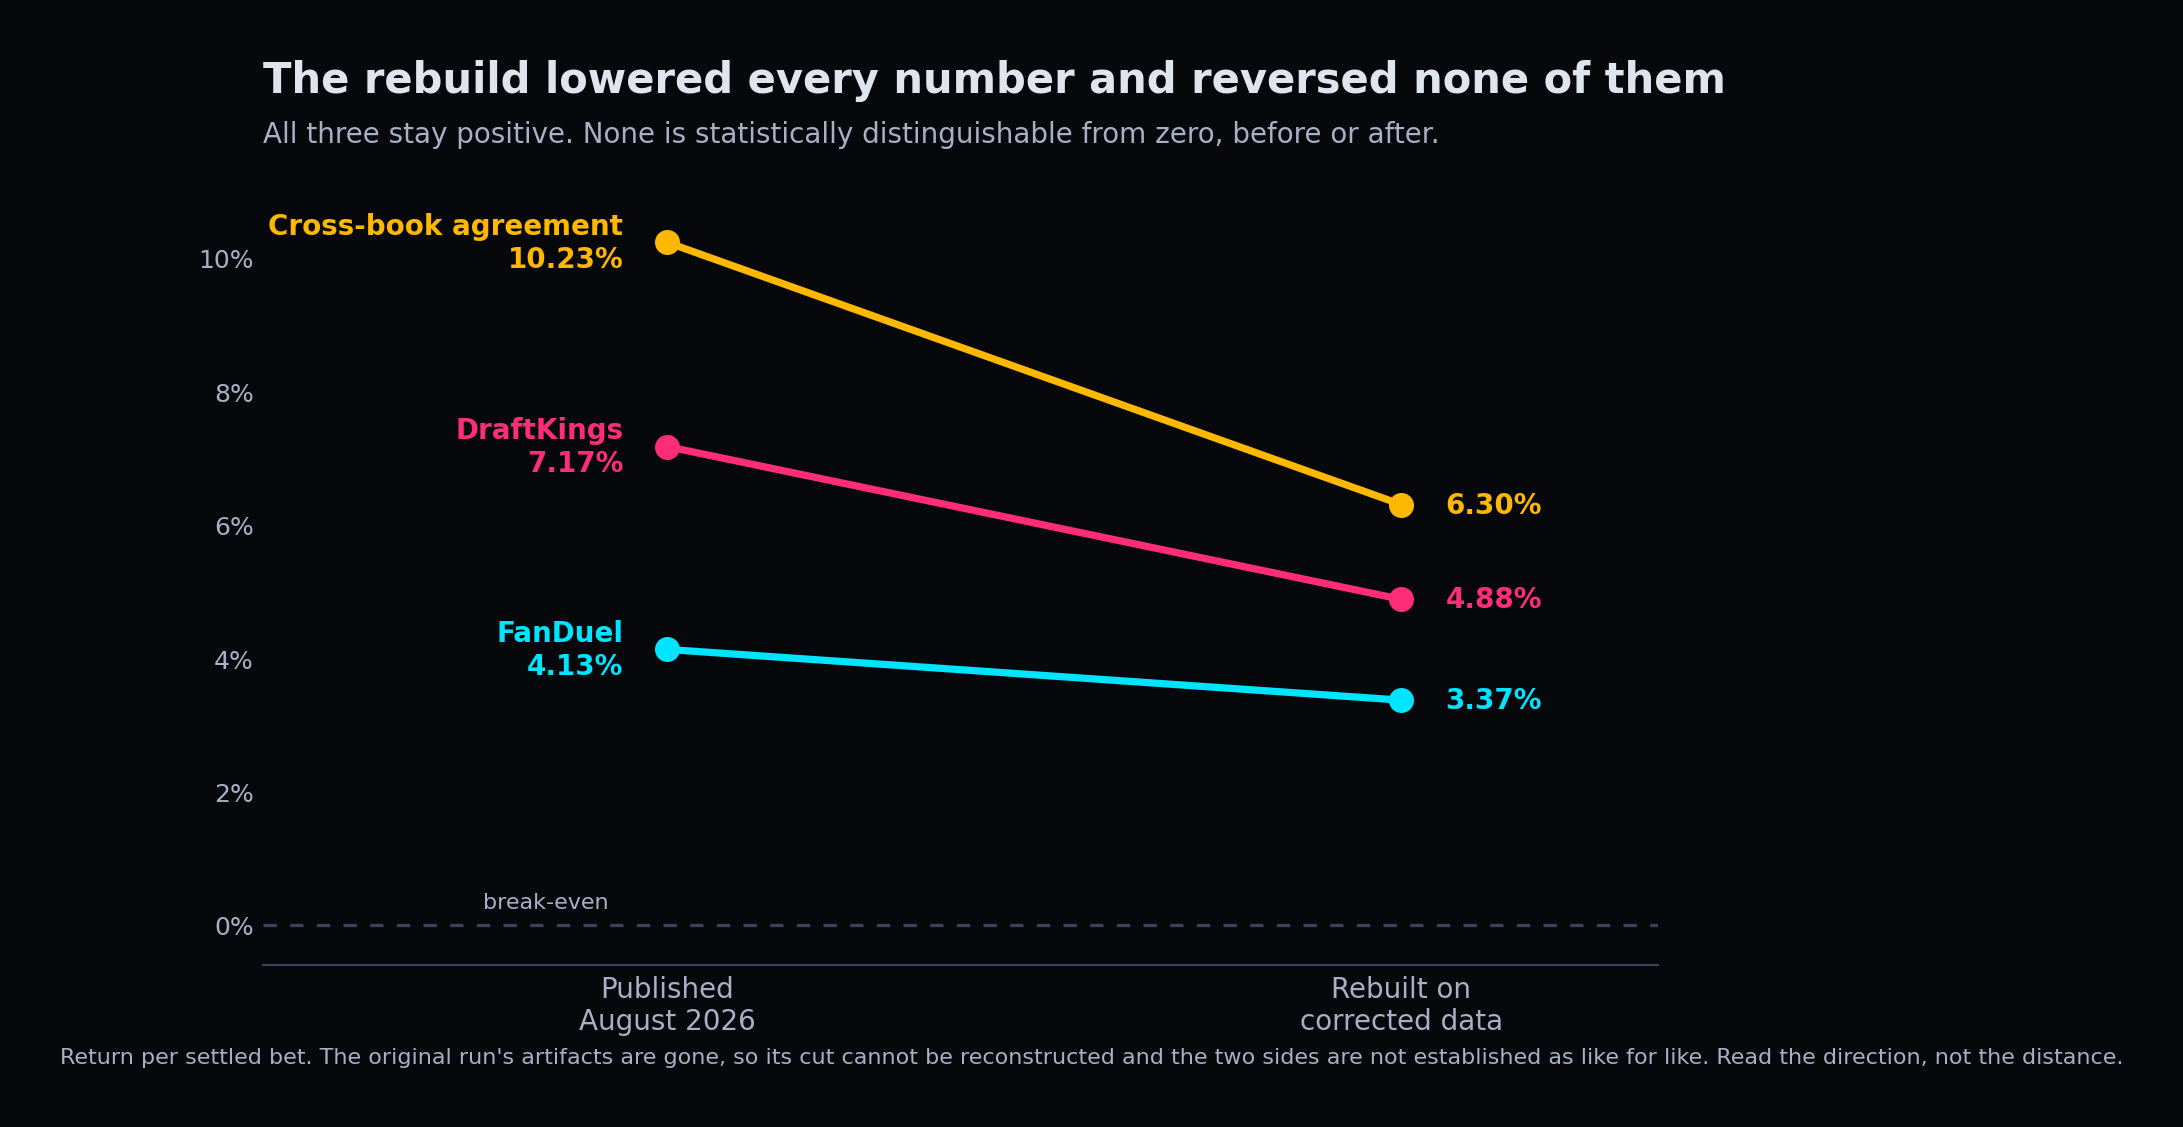
The rebuilt FanDuel and DraftKings figures remained positive in the same general direction, but the rebuilt agreement cell came in at +6.30% on 436 pairs. With the original artifacts destroyed we cannot prove the two measurements used the same cut, so we do not claim season-by-season parity between the August and rebuilt results. What is verifiable is that for the two original books (FanDuel and DraftKings), the measured results stayed positive in that rebuilt cut, while certainty dropped below conventional significance.
One qualification, and it is not a small one. Because the original run's artifacts were destroyed, we cannot establish that the two sides of that table measure the same thing. The rebuilt figures are the lead-72, 56-unit cut. What the original figures' cut was, nobody can now check. So the table is evidence of direction, not of magnitude, and a reader should not treat the drop from 4.13 to 3.37 as a measured correction, or the drop from 10.23 to 6.30 as a measured shrinkage. It may be either, or neither. That is what losing the data actually costs: not the numbers, but the ability to explain them.
This is the part newsletters usually skip: the first measurement was not wrong, it was unverified, and the verified version is smaller and less certain. That is also the only reason the rest of this is worth reading.
3. The hunt for why
We asked three questions.
Can the model predict football? No, and we can measure it. Its Brier score was 0.2622 against 0.2500 for always saying 50/50. Plainly: Brier is a grading system for probability forecasts, lower is better, and 0.25 is the score you get for free by predicting a coin flip every week. The model scored worse than guessing.
Is it just good at choosing which games to bet? We found a promising pattern: bets where it disagreed most with the market returned +4.35% in the data we already had. We wrote the test down before running it, twice. Both versions lost money on data the rule had never seen: -15.5% and -19.1%. Plainly: that figure was in-sample, measured on the same data that suggested it. It did not survive being tested out-of-sample, on fresh data. Out-of-sample is the only test that counts.
Then where does the money come from? From how the model was built. Its prediction is anchored to the betting line, so what actually varies is a small adjustment around that line, and that adjustment drifted by season. Plainly: the model was not reading individual games. It was leaning one way all season.
The lean was right in 2024 and 2025 and wrong in 2026. At the two original books (FanDuel and DraftKings), the 2026 weeks we measured lost money, and across the pooled books we measured 16.4% across 192 bets (43.3% win). We do not treat those weeks as evidence, because they are the lean behaving exactly as a lean does. We treat them as the warning.
4. What survived
One thing, and it is real: the model gets a better price than the market does by kickoff.
- Measured as closing line value (CLV), the gap between the price taken and the price at kickoff: +0.17 points, where a point is about 1% of stake. Plainly: it is buying at a slightly better number than the last price available before the game starts.
- Seven of eight books show it, and the t-statistic is +3.18. Plainly: this is the most statistically solid number in the whole study. It is not noise.
- The mechanism is mundane. The rule says "take the side where this book is out of line with its rivals." That sentence sounds like a forecast; it describes a price even better. It keeps buying the odd quote, and the market then moves toward it.
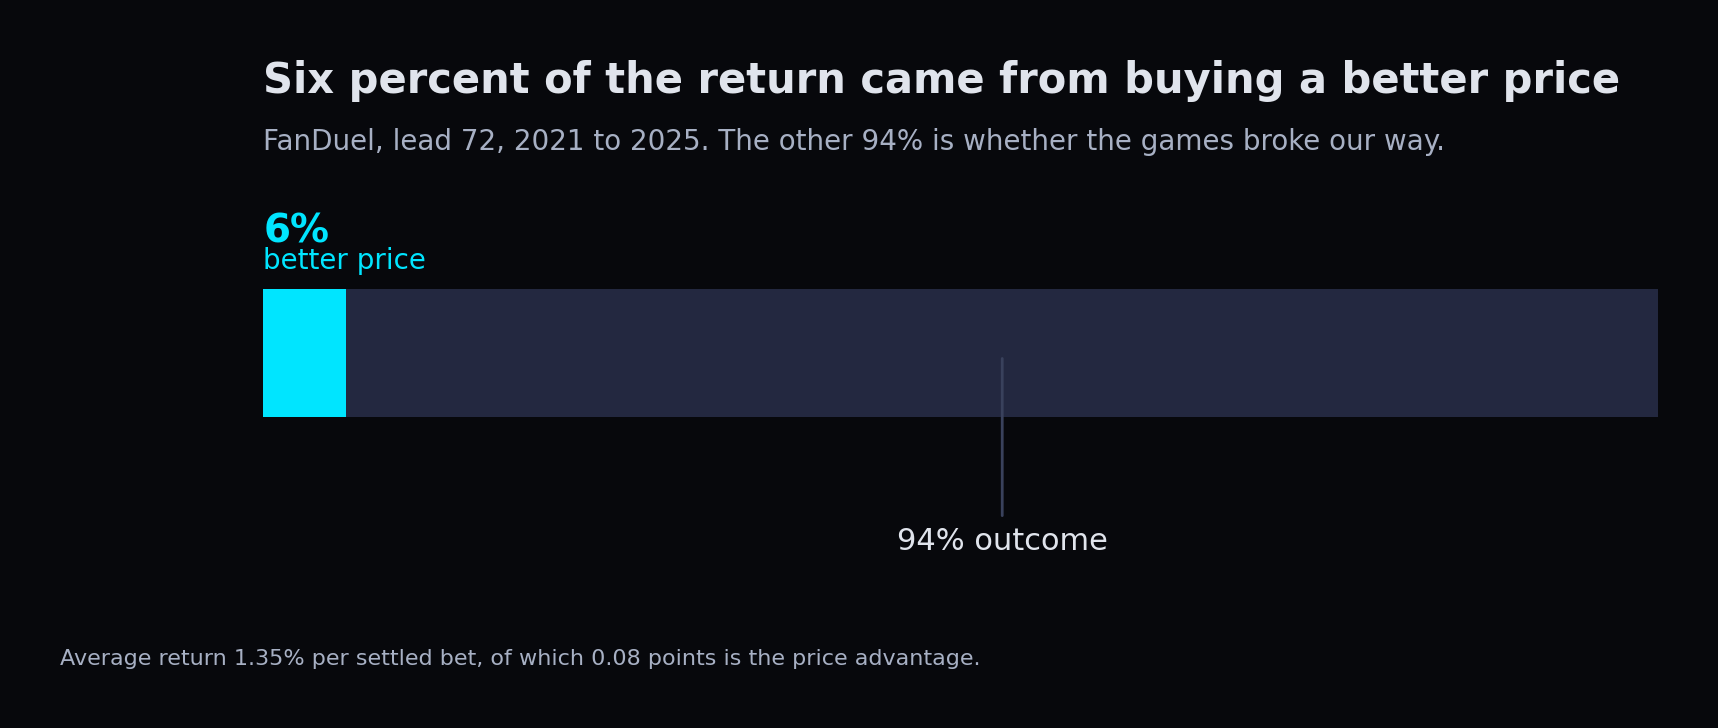
- But it is small. Resettle the identical bets at the closing price and the return falls from 1.35% to 1.27%. The better price is worth 8 hundredths of a point, about 6% of the result.
- One book makes the split visible in a single row: it beat the closing price by +0.14 points and still lost 1.1% of its bets. Plainly: you can buy well and still lose, because the games still have to break your way.
5. The discovery
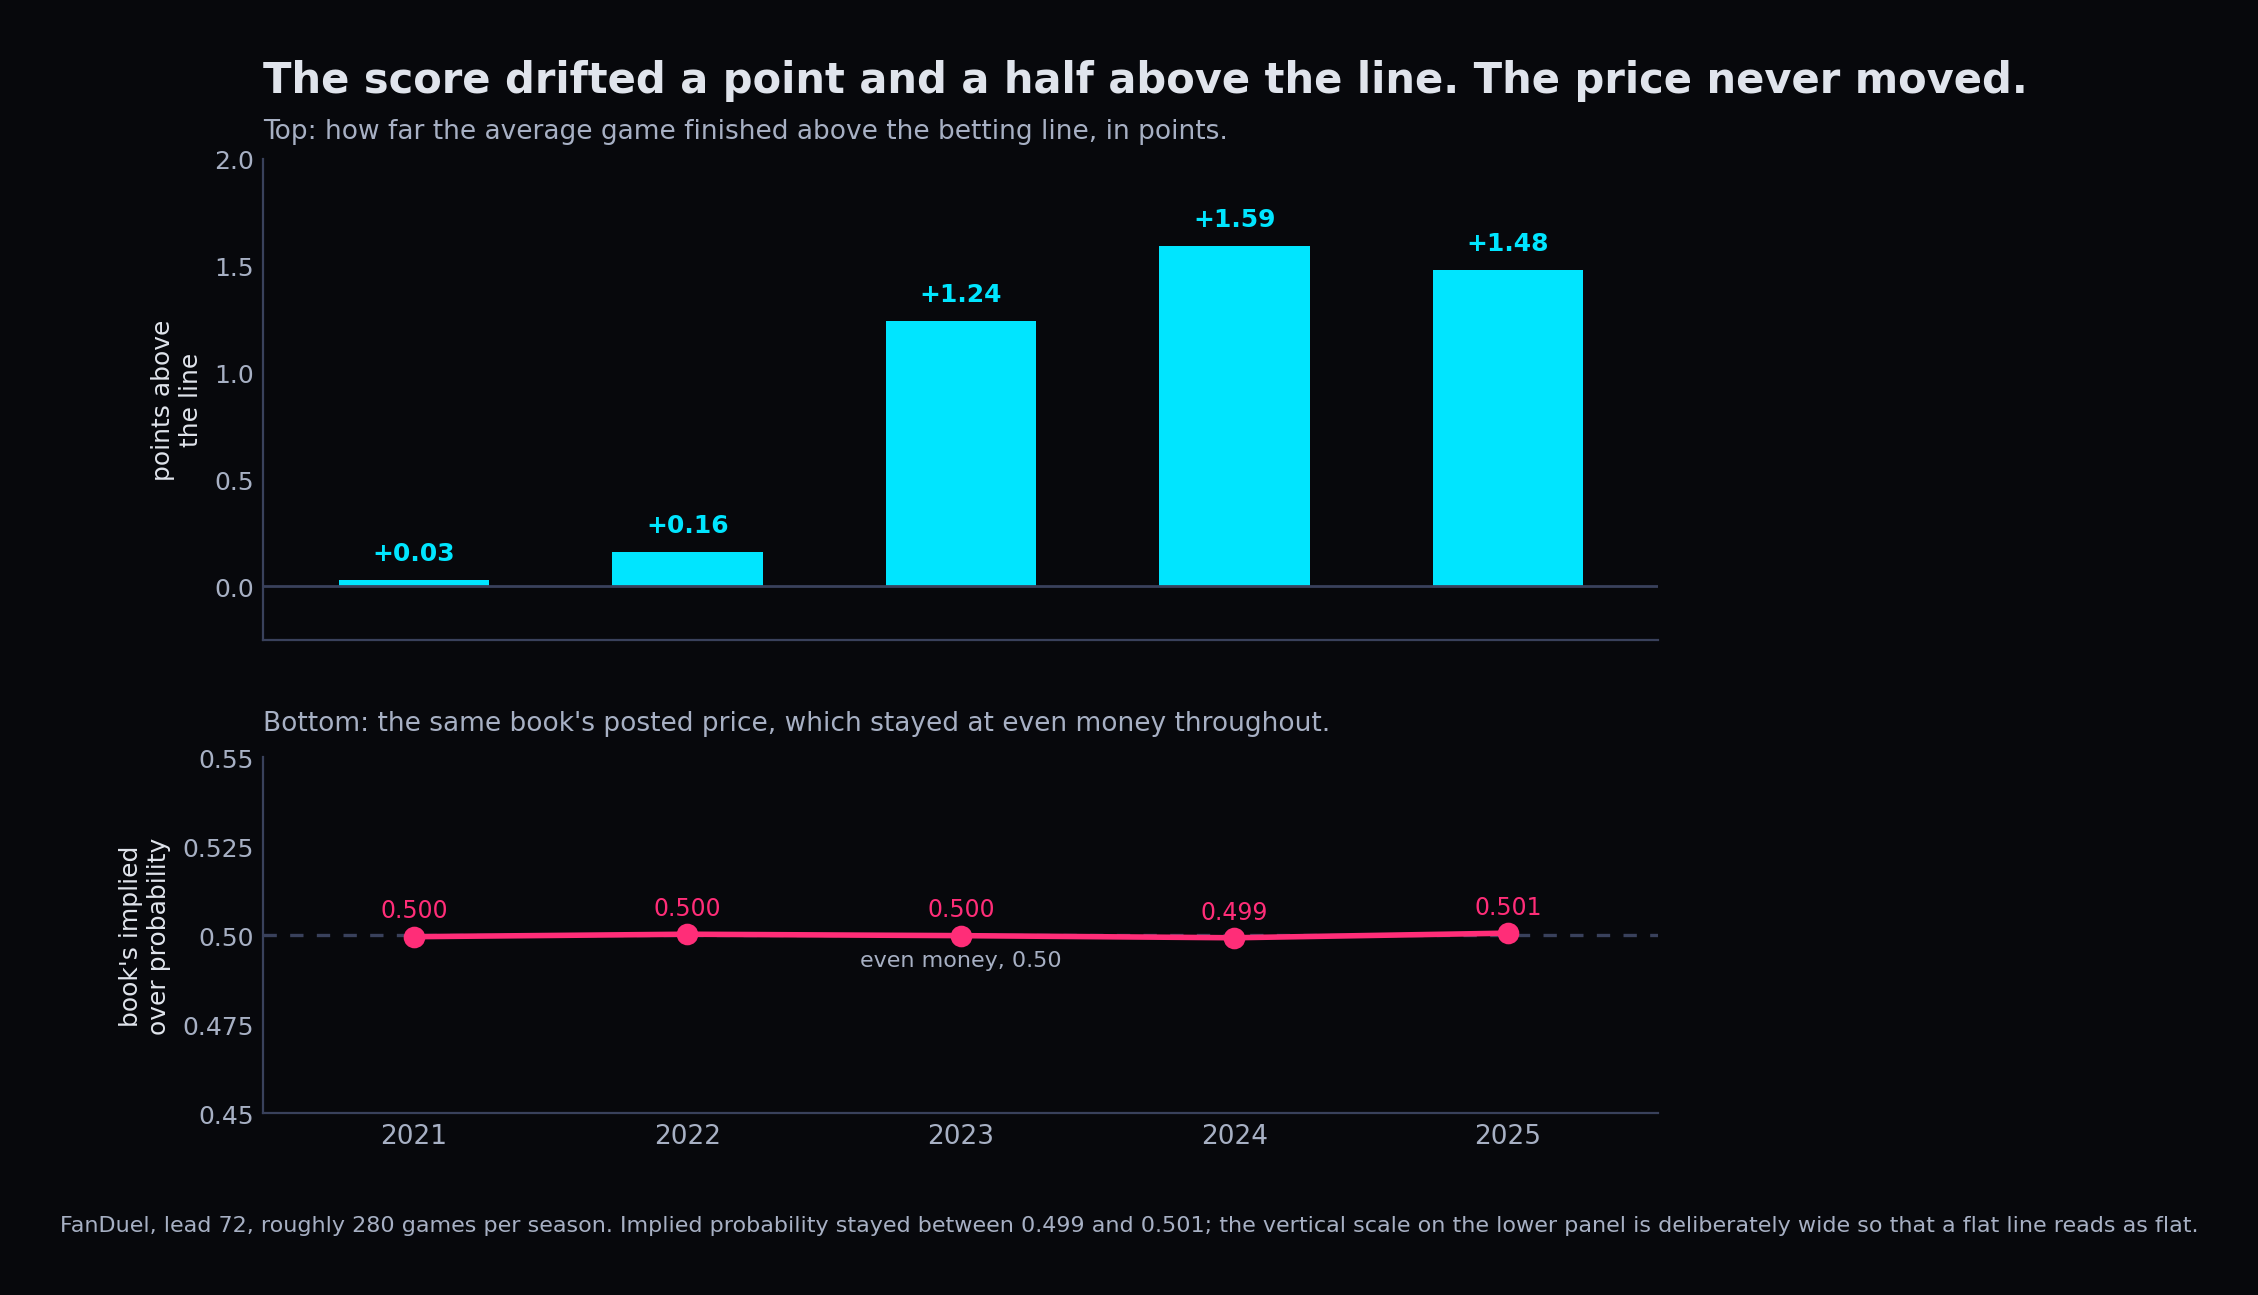
Betting the over or under on a football total is a coin flip by design. The book sets the line so each side is near even money, and we measured exactly that: the market's own probability came out at 50/50 to within a rounding error. Nobody, model or book, can be much better than a coin flip on which side lands.
So we stopped asking "which side?" and asked the better question: how far does the score land from the line? That distance is called the residual.
| season | average residual (points above the line) |
|---|---|
| 2021 | +0.03 |
| 2022 | +0.16 |
| 2023 | +1.24 |
| 2024 | +1.59 |
| 2025 | +1.48 |
- In 2024 and 2025, games finished about a point and a half above the line on average.
- The books never adjusted: their posted price stayed at even money in every season we measured.
- That is a real, unpriced effect. It is the gap the model kept stumbling into.
But nothing foresaw it. We tested all 46 model inputs one at a time, asking whether any could have predicted that drift before the season. We used a regression per input, fitted on earlier seasons and scored on a later one, and required each to clear a Bonferroni-corrected bar. Plainly: a regression checks whether one number moves with another. Bonferroni is a stricter pass mark applied because we tested 46 inputs at once, and testing many things guarantees some look good by accident. Under that bar, none passed. The best was indistinguishable from luck.
6. So what is it?
Not "the model works." Not "the model is noise." The accurate description:
It is a price picker that doesn't know it's a price picker.
It was built to forecast totals and it cannot forecast. What it actually does is buy the outlier quote, hold a better number than the closing price, and occasionally catch a season where the whole league drifts one way. Real effect, accidental exploitation, and more confidence than the evidence supports.
7. What to go and build
Four things, in order.
- Make the price edge deliberate. The one durable skill is buying better numbers. Build that on purpose: which books consistently post the outlier, how stale those quotes are, and the missing piece, how much money you can actually get down at them. We know the price; we do not know the size.
- Explain the drift. A point-and-a-half shift that the market leaves at even money is worth understanding. It is a season-level effect rather than a game-level one, so it needs season-level causes: rule changes, pace of play, officiating, kickoff rules. Per-game inputs will never see it, which is exactly why 46 of them found nothing.
- Stop predicting the side and start pricing the shape. The book gives you one number (50/50) and one line. It does not tell you how wide the outcomes spread around that line. If the market is wrong about the spread rather than the direction, that is a bet on variance, and it is the one place left with room in it.
- Buy sample, not cleverness. At a fifth of a point a bet, the price edge sits inside one standard error of the return at a few hundred tickets. Settling more tickets is the only way to separate a real price advantage from a lucky draw, and the corpus records price and status only, never stake or depth, so it cannot say what the edge is worth in size. Two things to buy, in this order: more settled tickets, and any measurement at all of how much you can get down.
8. The one lesson
Big and certain are different things, and the trade press only ever asks about big. This is the difference between statistical significance, meaning it is probably not luck, and materiality, meaning it is large enough to matter. The most certain number we produced explained 6% of the result. The numbers that made the headline explained none of it. And the data loss matters too: an unreproducible backtest is a claim, not a finding. When someone shows you one, the useful question is not "is it significant?" but "how much of it is the edge, how much is the weather, and could you rebuild it if the data vanished tomorrow?"
Two ways to use this
I'm taking on new work. If you have a model, pipeline, or AI-assisted system producing numbers that people rely on to make decisions, but you can't verify how those numbers were produced, I can help. I audit the system, verify its results, fix gaps in testing and documentation, and make sure you can reproduce the results yourself. That's what QAF does, with custom projects available for larger or more complex problems.
I'm available for new projects now. Reach me at bcr@blackarbs.com or blackarbs.com/contact.
Or build the skill yourself. If you would rather learn to build systems you can trust than hire someone to prove them, that is Forge Learn: one strategy taken from raw data through data certification, walk-forward validation, paper execution, scheduling and monitoring, so the pipeline you end up with is one you can explain, test and operate. Eleven units, self-paced, no live capital required.
Both are the same offer, honestly. The difference between a system that runs and a system you can defend is the work.
Glossary
| term | what it means here |
|---|---|
| Brier score | A grade for probability forecasts. Lower is better. 0.25 is what always saying 50/50 earns. |
| Closing line value (CLV) | The gap between the price you got and the price at kickoff. Positive means you bought better than the last price available. |
| Confidence interval | The range of outcomes that would not surprise us. If it includes zero, the result could be luck. |
| t-statistic | How many units of noise the result sits away from zero. Under about 2, treat it as noise. |
| Residual | The distance between the actual score and the line. The thing you can predict; the side is not. |
| Out-of-sample | Tested on data the rule never saw. The only test that counts. |
| Bonferroni correction | A stricter pass mark applied when you test many ideas at once, because testing 46 things guarantees some look good by chance. |
| Significant vs material | Significant means probably real. Material means big enough to be worth doing. They are not the same. |
Disclosure: this is historical and educational research, not a betting tip, staking recommendation, or personalized financial advice. Historical prices may not have been available or accepted at the displayed terms. The agreement rule was identified after reviewing the historical tape and must pass a locked forward test before it authorizes capital.