With the start of the NFL season just around the corner, I've been using my alpha research pipelines to find opportunities in the betting markets. I have been trying to beat a posted number since I was a teenager.
Sportsbooks were the first market I ever wanted to beat. I loved playing sports as a kid and the habit has carried over throughout my life. Anyways, I used to always wonder how the books could price a future, create a line that created a built-in profit and in some cases actively position against the public. They dared you to know something they didn’t.
That is the same job as quant finance.
A sportsbook total and a stock price are both estimates under uncertainty. Someone is selling you a number. Your edge, if you have one, is a gap between that number and the world. The rest is process: point-in-time data, costs, walk-forward tests, and the discipline not to fund a lucky chart or sequence.
Sports Prediction Machines is the same research stack I use on markets, pointed at games. Different tape. Same question. Did we find a price the market got wrong, or a backtest that flattered us?
The first result was promising
To be clear this report is vetted historical research, not a live book. The profit is real in sample. It is not funded. After one locked test, it may be ready for 2026.
One model family, LightGBM, made money on unfiltered NFL totals at both popular U.S. books. +4.13% at FanDuel on 425 settled bets. +7.17% at DraftKings on 537. Those were separate models, each fit and priced at its own book. Approximate 95% intervals still crossed zero: FanDuel about -4.96% to +13.21%, DraftKings about -0.80% to +15.15%. It's promising but not proof yet.
The path-adjusted numbers tell the same story with more texture. Using $100 flat stakes, a $10,000 notional bankroll per book, weekly returns across all 18 regular-season weeks, and a zero risk-free rate, the season-annualized Sharpe ratio was 0.48 at FanDuel and 0.87 at DraftKings. The geometric Martin ratio, annualized compounded growth divided by the ulcer index, was 0.78 at FanDuel and 1.92 at DraftKings. DraftKings did not merely finish with more ROI. Its path delivered more return per unit of volatility and drawdown pain.
| Cohort | ROI | Sharpe | Geometric Martin |
|---|---|---|---|
| Unfiltered FanDuel | +4.13% | 0.48 | 0.78 |
| Unfiltered DraftKings | +7.17% | 0.87 | 1.92 |
| Agreement FanDuel | +10.05% | 0.91 | 3.34 |
| Agreement DraftKings | +10.40% | 0.97 | 4.12 |
| Combined agreement | +10.23% | 0.94 | 3.74 |
Unfiltered LightGBM made money at both books, but the same-side agreement cohort was stronger. ROI uses $100 flat risk per settled bet. Sharpe and geometric Martin use weekly returns on a $10,000 notional bankroll per book; the combined agreement path uses $20,000 to preserve equal capital per execution leg. Historical and post-hoc, not a staking recommendation.
Agreement was the stronger filter
What happens when those two models pick the same side?
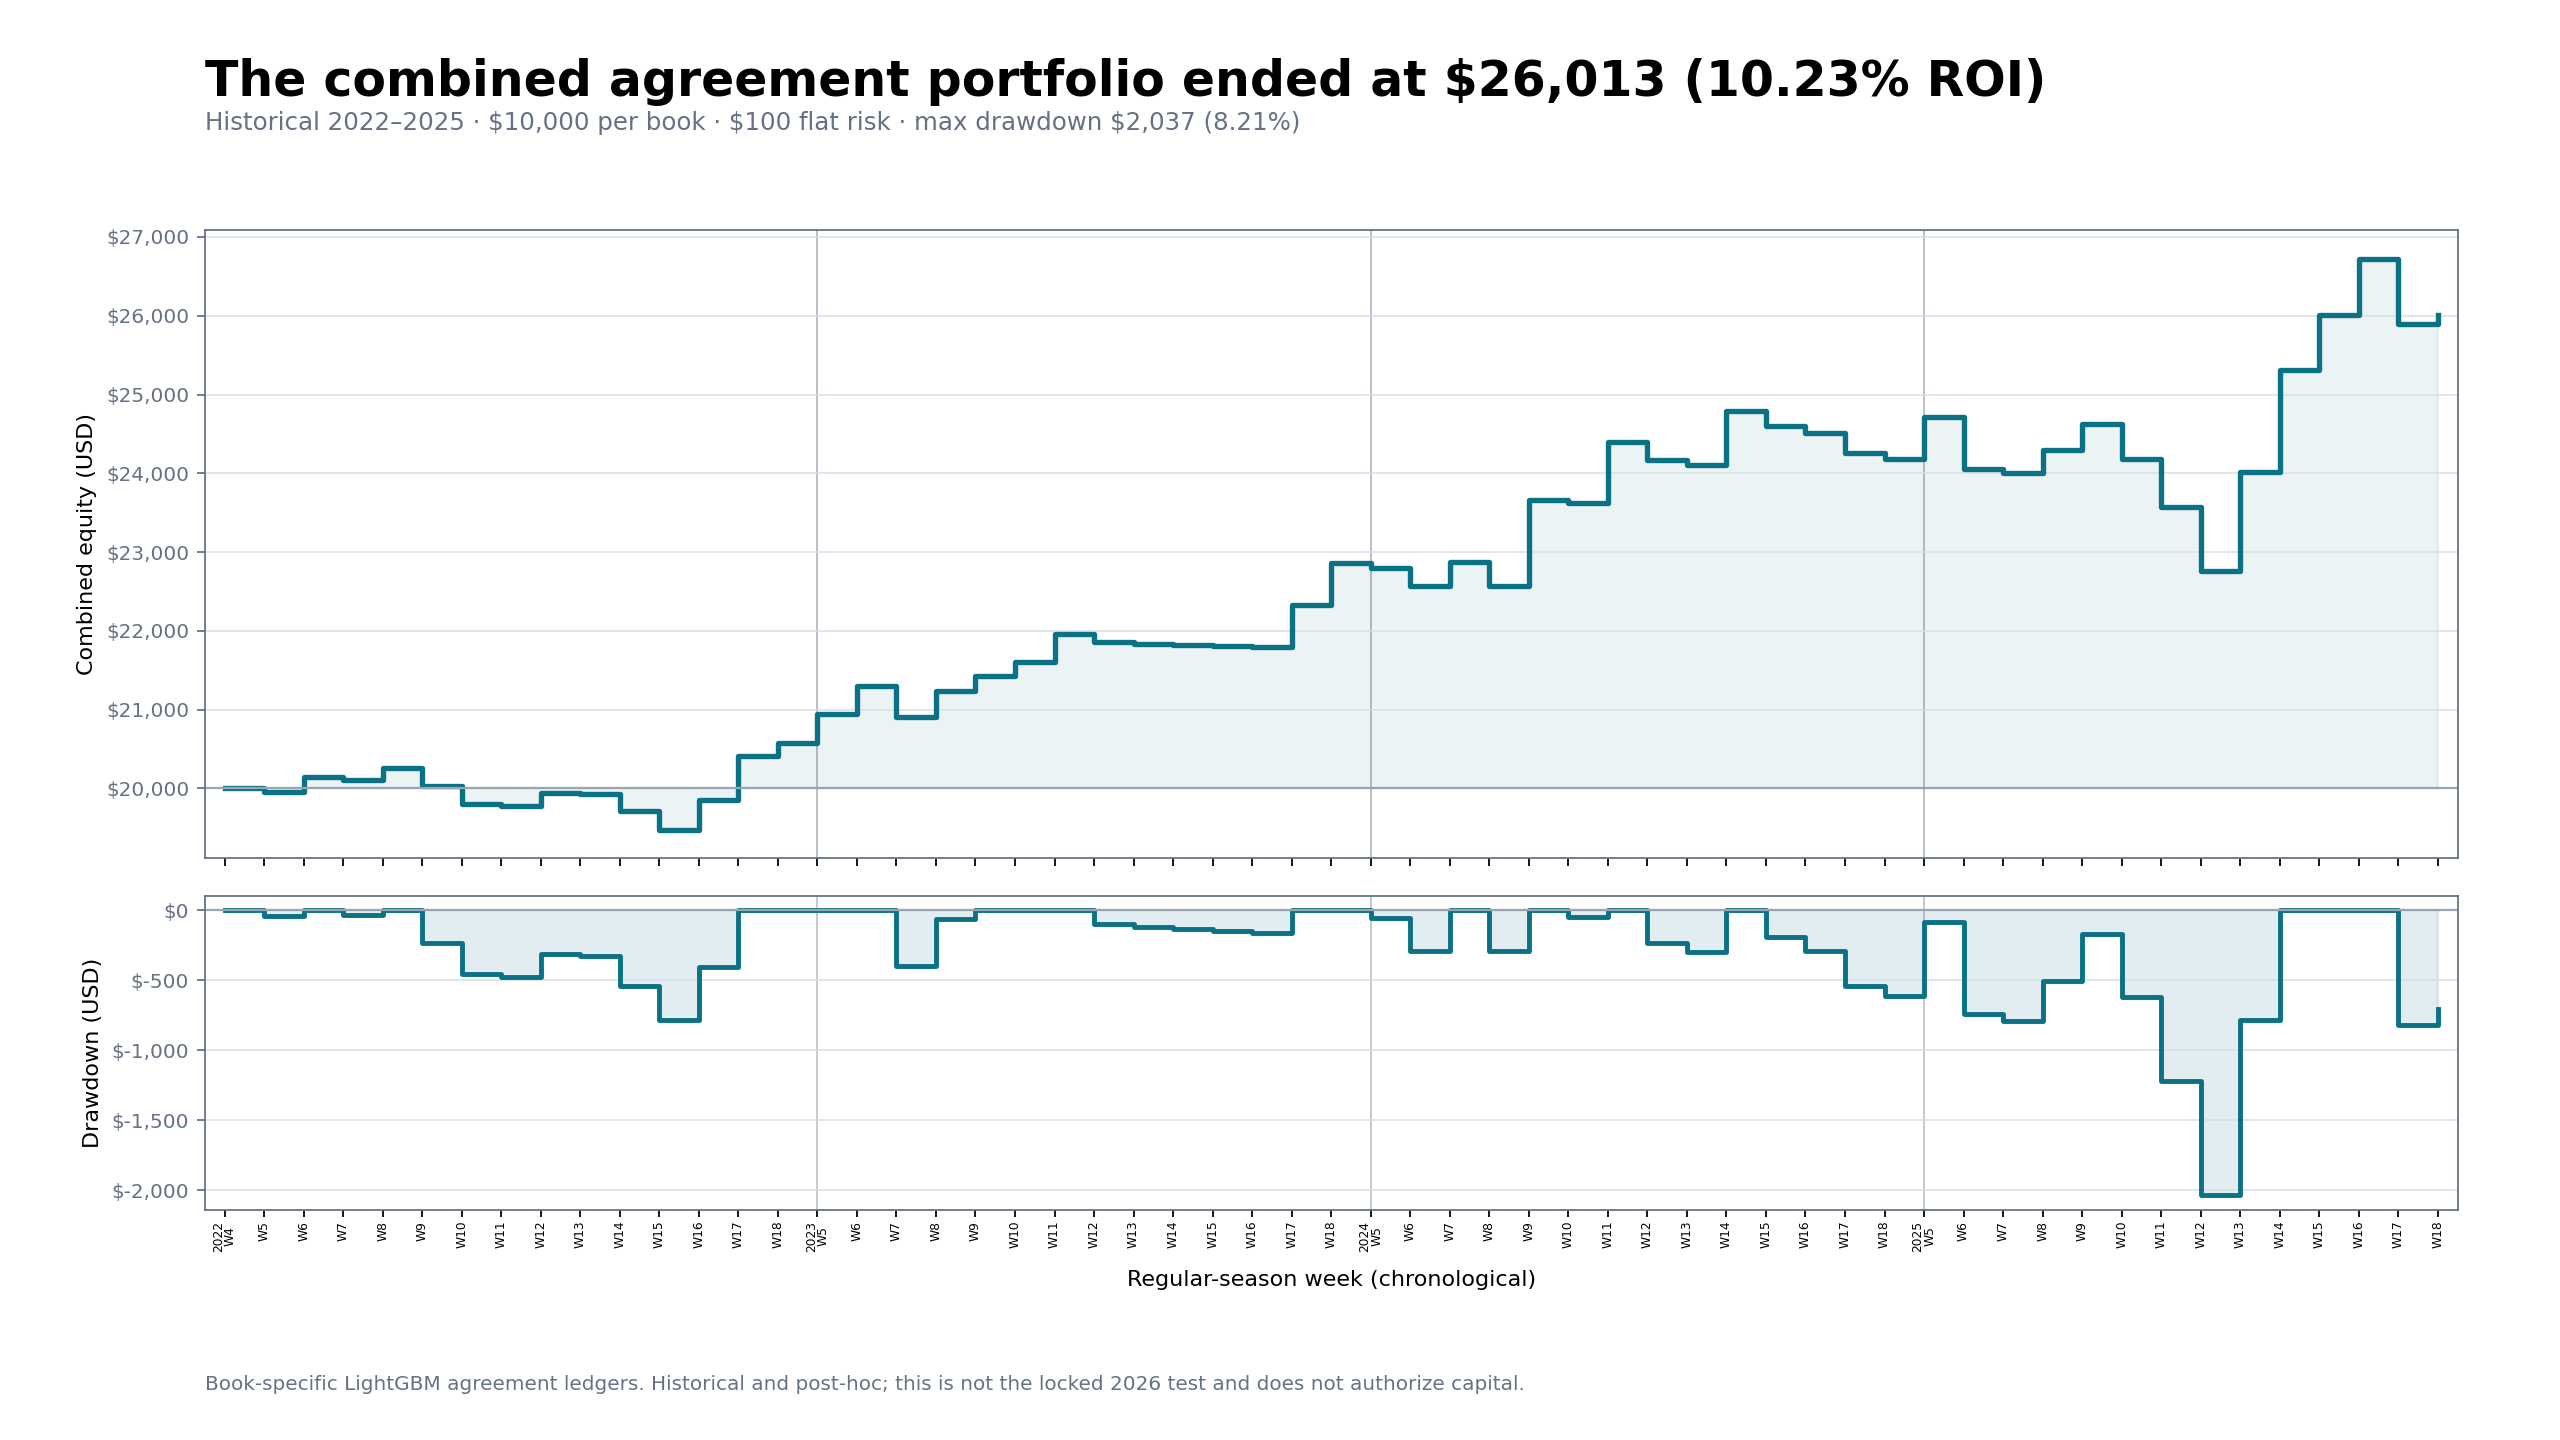
On 294 games they agreed, each bet still settled at its own book: +10.05% at FanDuel prices, +10.40% at DraftKings prices. Combined that is +10.23% across 588 book-bets. Overs and unders both contributed. Every season stayed positive. That comparison was found after looking at the tape, so it is a lead, not a holdout.
Agreement also improved the shape of the path. FanDuel agreement produced a 0.91 Sharpe and 3.34 geometric Martin ratio. DraftKings agreement produced a 0.97 Sharpe and 4.12 geometric Martin ratio. Treating the two book legs as an equal-capital combined portfolio produced a 0.94 Sharpe and 3.74 geometric Martin ratio. These are risk-normalized historical descriptors under the stated notional-bankroll convention, not evidence that the bankroll or stake size is safe.
| Agreement book | 2022 | 2023 | 2024 | 2025 |
|---|---|---|---|---|
| FanDuel | +6.77% | +28.52% | +5.70% | +9.14% |
| DraftKings | +6.67% | +30.00% | +6.13% | +9.14% |
The two independently fit LightGBM models selected the same side on 294 games. Each decision was settled at its own book and line. Both price legs were profitable in 2022, 2023, 2024, and 2025, but this agreement rule was identified after reviewing the historical tape.
Bigger claimed edge was not better
The useful filter was not a bigger claimed edge.
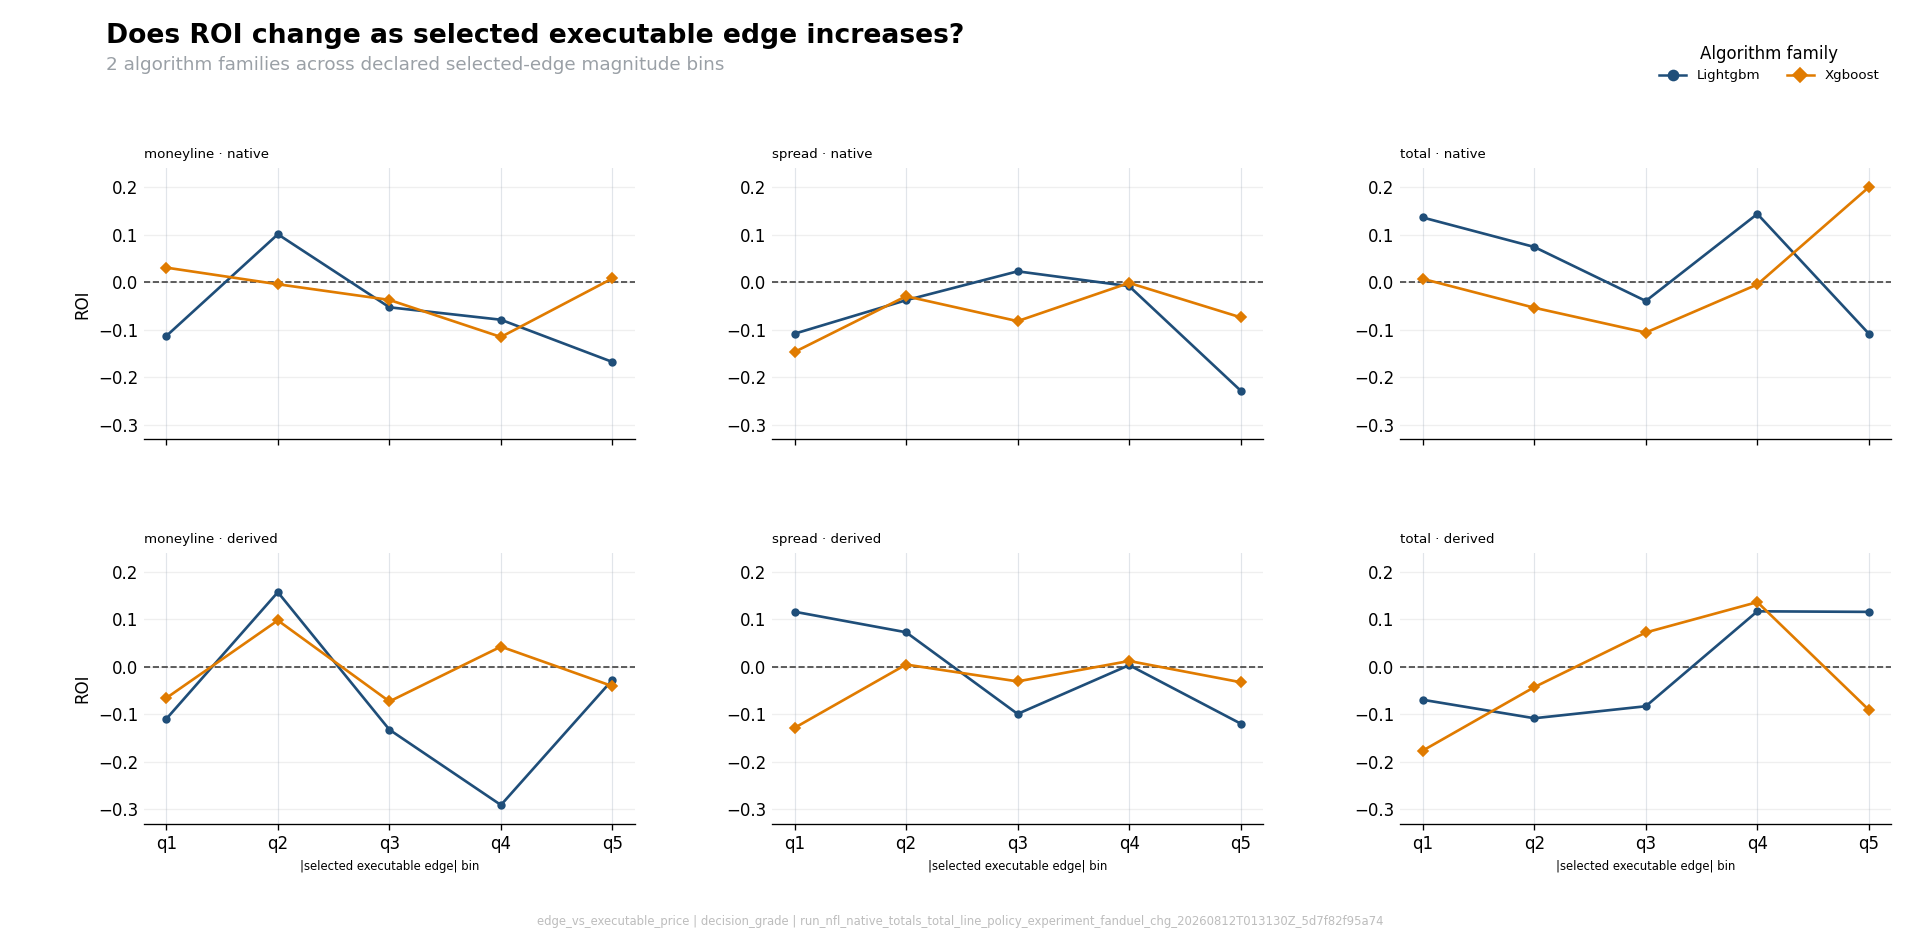
On the unfiltered FanDuel run, LightGBM’s smallest claimed-edge group made +13.63%. The largest lost 10.85%. Anyone who has watched a factor’s highest-signal names become the worst sleeve already knows this movie.
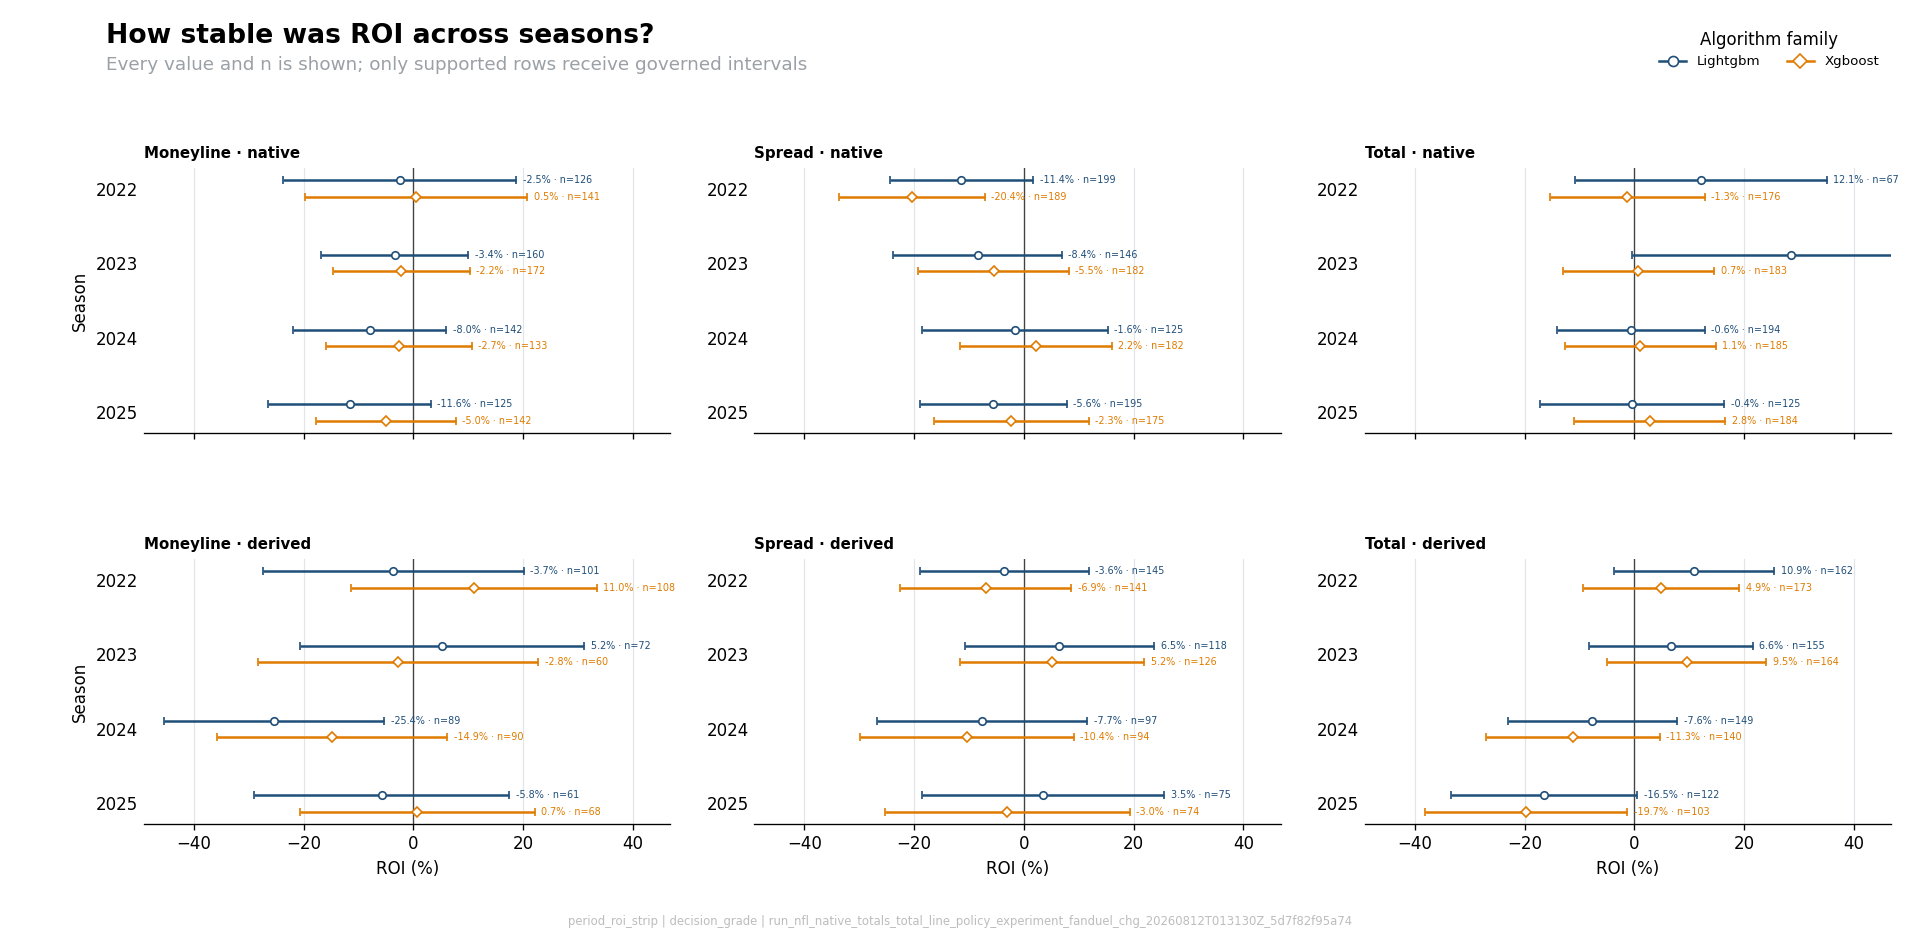
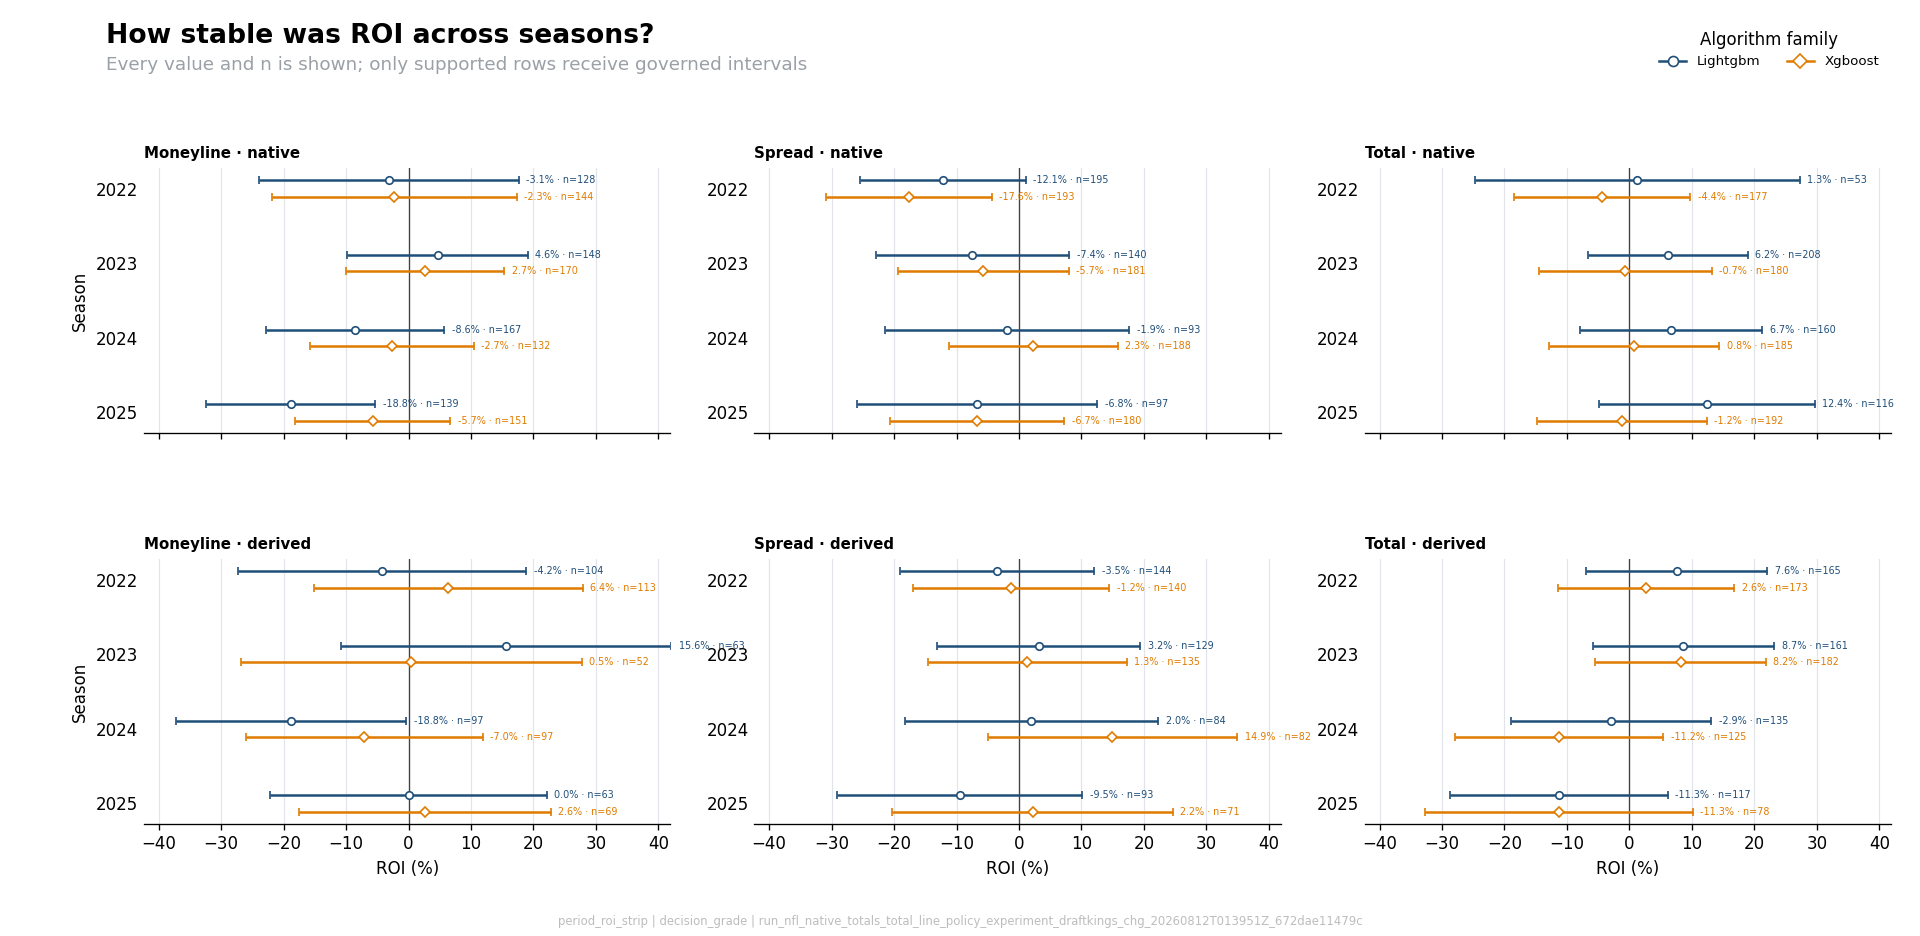
Without the agreement filter, FanDuel did not hold up across all four seasons. It printed in 2022 and 2023, then slipped under water in 2024 and 2025. The unfiltered FanDuel edge was not portable. DraftKings, shown next, remained positive in every observed season. Same-side agreement stayed green at both books.
FanDuel — unfiltered LightGBM seasonal ROI
DraftKings — unfiltered LightGBM seasonal ROI
The next test is a simple rule
The test rule is fixed: run both book models separately, take the total only when they agree on the side, and settle each bet at its own book’s price. Keep each book’s line separate: 44.5 and 45 are not the same number. Then evaluate the rule once on the locked 2026 season before calling it a strategy.
Combined — equal-capital agreement portfolio
A profitable chart is not authorization
Two independent models agreed, and the same-side bets got better. Unfiltered FanDuel faded. Agreement did not. I am not funding it yet, but I'd be lying if I said with certainty that I won't this season.
If you have a model that looks ready but you still don't trust the results or the pipeline that generated it, that's what QAF is for. Write me.
Anyways, I still want to beat the number. I wanted that when I was a teenager staring at a total. I want it now with a walk-forward and an audit trail. The interest never changed. The standard did.
Metric note: Sharpe is the annualized return relative to weekly volatility, calculated with a zero risk-free rate across 18 regular-season periods per season-year. Geometric Martin is annualized compounded growth divided by RMS percentage drawdown. Weeks with no bets count as zero returns. Both ratios use the disclosed $10,000 per-book notional bankroll and $100 flat-stake convention; neither authorizes capital.
Explore the complete interactive report
Open the complete interactive slide report in a new tab.
The report includes the full book-by-book paths, edge-group diagnostics, the same-side agreement comparison, and the equal-capital portfolio view.
Disclosure: This is historical and educational research, not a betting tip, staking recommendation, or personalized financial advice. Historical prices may not have been available or accepted at the displayed terms. The agreement rule was identified after reviewing the historical tape and must pass a locked 2026 test before it can authorize capital.
Best,
Brian Christopher, CFA
BlackArbs LLC