In this post
- TL;DR
- What Corrfilter was supposed to do
- Before alpha, there must be evidence
- One number was answering two different questions
- The tempting redesign
- The 2022 out-of-sample failure
- The allocation rule that survived
- The final research decision
- Why this matters beyond Corrfilter
- Interactive slide report
TL;DR
I spent the last week rebuilding a strategy I stopped trading in 2025.
The goal was not to rescue it.
The goal was to find out whether the original idea contained anything worth keeping, and whether I could trust the evidence enough to make that decision.
The first redesign looked dramatically better in the data used to develop it.
But the improvement came from a mistake in the allocation rule. The redesign moved capital out of SHY, the short-term Treasury position, and into UPRO and TQQQ. It was mostly taking more leveraged equity risk.
I had kept the 2022 data separate from the redesign process. When I finally used it for an out-of-sample test, every redesigned rule performed worse than its original version. The extra leveraged-equity exposure was the reason.
I corrected the allocation rule so rejecting a Treasury hedge could never increase UPRO or TQQQ. The correction improved every comparison, but the strategy still fell far behind SPY. I rejected it before testing it on the final untouched data from 2023 through mid-2025.
That is the short version.
The longer version is a post-mortem of how a backtest can become computationally correct and economically wrong.
Prefer the visual version? Open the complete interactive slide report in a new tab.
What Corrfilter was supposed to do
Corrfilter was a risk-control rule for a portfolio built from leveraged ETFs.
It watched UPRO and TQQQ, two leveraged U.S. equity funds, and TMF, a leveraged long-term Treasury fund intended to diversify equity losses. A single score measured whether the assets were moving together dangerously. That score controlled how much leveraged exposure the portfolio retained. More perceived danger meant less leveraged exposure and more weight in SHY, a short-term Treasury fund.
The intuition was reasonable:
When several positions begin moving like one concentrated equity trade, reduce risk.
The implementation was not that simple.
Corrfilter was stopped in 2025 after discrepancies in observed performance made the experimental results difficult to trust. When I reopened it, the first question was not whether the signal worked.
The first question was whether the backtest, allocations, returns, costs, and SPY comparison all came from the same run.
Before alpha, there must be evidence
The reconstruction found several reasons the reported performance could not yet be trusted.
The verification backtest did not include SPY, even though SPY was the benchmark the strategy needed to justify its added complexity.
The strategy produced daily target weights for UPRO, TQQQ, TMF, and SHY. The reporting layer dropped part of that allocation record. I could see performance, but not every portfolio decision that produced it.
The system also could not prove that a displayed benchmark belonged to the same strategy run, calculation, and period. A comparison could look valid while pointing to the wrong evidence.
Then there were the platform problems. The strategy could not run through the current version of the research platform. Some backtests finished successfully but saved results the current application could no longer open. The strategy recorded one form of portfolio allocation, while the reporting system expected another. Valid decisions disappeared from the report.
None of those problems make for an exciting alpha chart.
They determine whether the alpha chart means anything.
Before interpreting performance, I had to prove one chain:
market data
    -> target weights
    -> executed portfolio
    -> returns and costs
    -> same-period SPY
    -> final report
Only then could I inspect the strategy itself.
One number was answering two different questions
The original correlation-pressure statistic mixed two facts:
- Equity concentration: Are UPRO and TQQQ becoming one crowded trade?
- Treasury hedge quality: Is TMF behaving like insurance for the equity basket?
Those are not the same question.
During February through April 2020, median equity pairwise correlation was 0.925. In plain English, UPRO and TQQQ were moving very closely together.
A separate point-in-time score, internally called equity stress, confirmed that this concentration was unusually high. It used only information available before each day. Its median reading was 0.861, where values above zero meant equity co-movement was above its prior baseline.
At the same time, TMF generally moved against the equity funds, which made it look like an effective hedge. Its median hedge-quality score was 0.791 on a scale where higher values meant stronger diversification.
The old statistic averaged those facts together. Strong Treasury diversification made elevated equity concentration look safer. After the working hedge offset the equity warning, the combined score fell to a median of -0.409. The old rule interpreted that negative score as safe, so its typical daily warning remained off and the portfolio generally stayed fully invested even while equity concentration was elevated.
The portfolio followed the rule correctly. The rule cut risk late, restored full risk while equity stress remained high, then cut again near the bottom.
The code did what it was told. The design was the problem: it allowed a working hedge to erase an equity-risk warning.
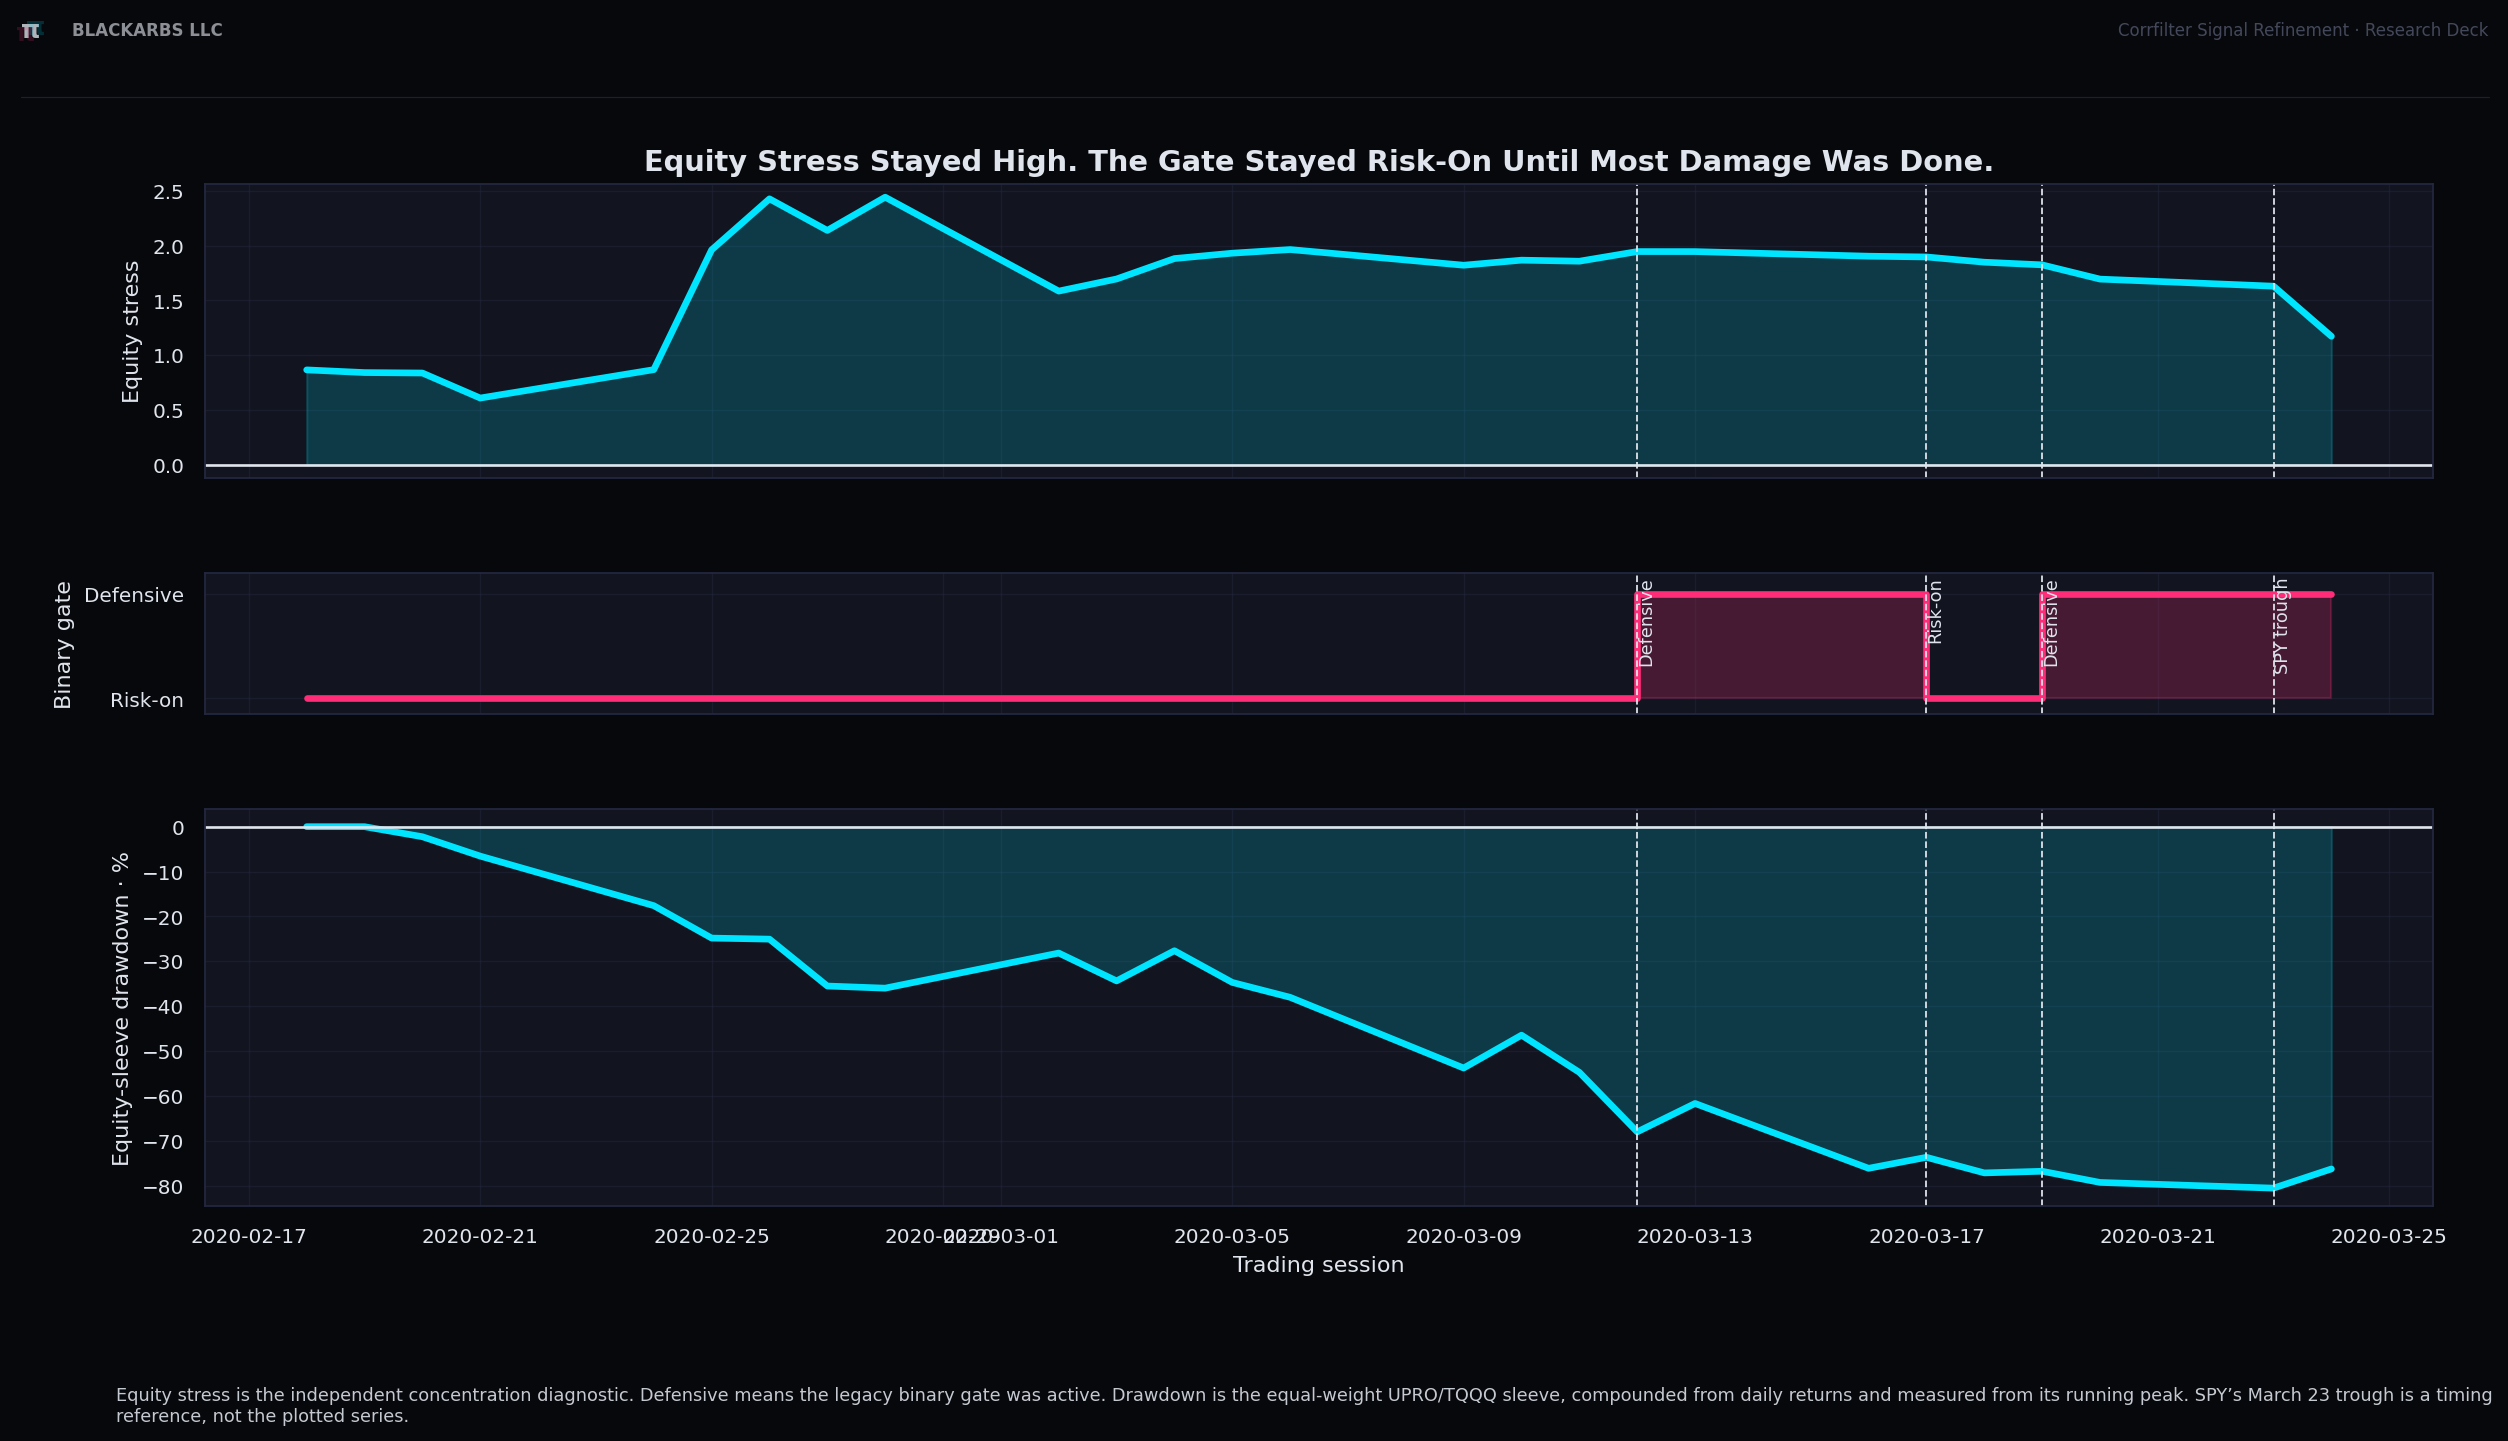
Figure 1: Equity concentration remained high while the mixed signal stayed quiet, then changed direction near the trough.
The tempting redesign
I separated equity stress from Treasury hedge quality.
Once separated, equity stress and Treasury hedge quality had different relationships with subsequent returns during the 2018 through 2021 development period. Higher equity-stress readings tended to precede weaker returns over the next 5 and 20 trading sessions. Stronger TMF hedge readings tended to precede better returns over the next 20 and 60 trading sessions. The old mixed signal combined the two measurements and made both relationships look weaker.
That was enough evidence to test separate rules for equity exposure and Treasury-hedge eligibility. It did not establish a tradable rule.
I then finalized six rules for translating equity stress into portfolio exposure before looking at their 2022 results. Every comparison used the same data, next-day execution, volatility-based asset weights, trading costs, and return accounting. Only the exposure rule changed.
One of the six allocation rules looked especially convincing in development. I called it equity-linear because it reduced exposure in direct proportion to rising equity stress.
Under the original portfolio design, the equity-linear rule returned 216.03% with a -20.89% maximum drawdown. Under the redesign that treated the equity budget separately, it returned 440.90%.
Its Geometric Martin ratio also improved. That metric rewards compound growth while penalizing deep, persistent drawdowns. The redesign therefore appeared to improve both total return and risk-adjusted performance.
That is the sort of result that makes you want to keep working.
But average leveraged-equity weight increased from 42% to 71%, and maximum drawdown nearly doubled to -40.25%.
The redesign looked smarter.
It was mostly longer leveraged equities.
In plain English, the redesign held substantially more UPRO and TQQQ.
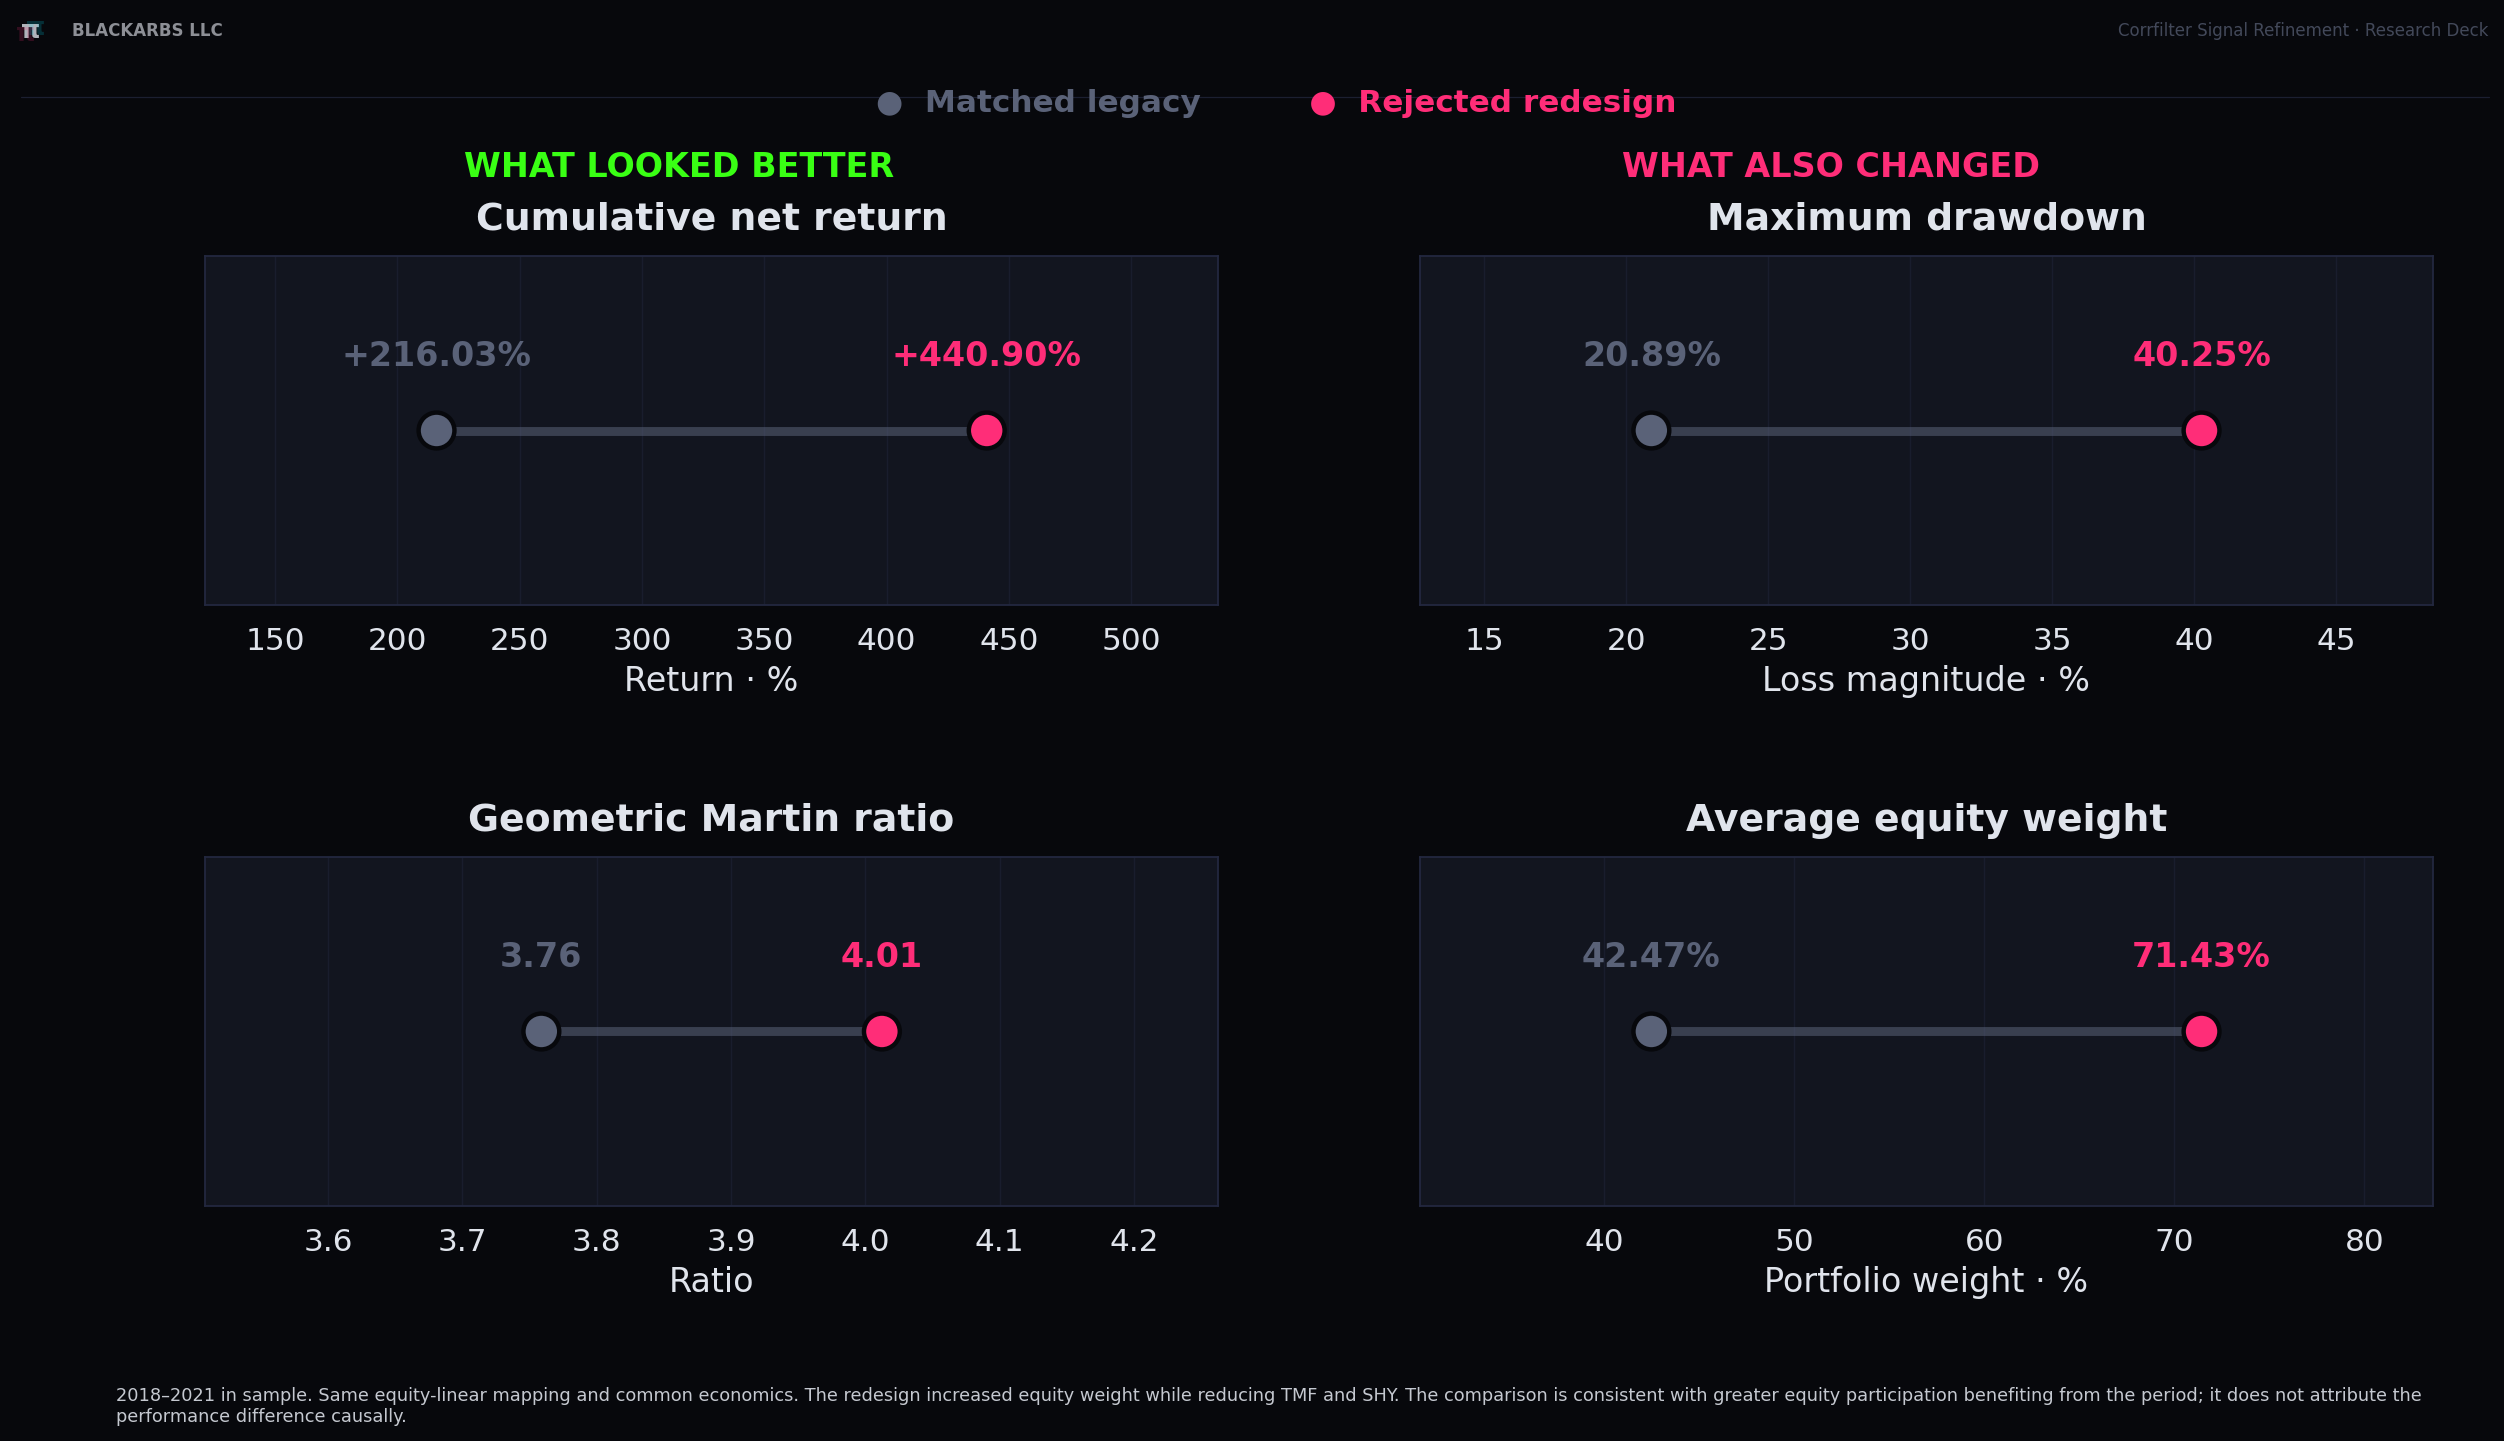
Figure 2: The development-period improvement came with materially greater leveraged-equity exposure.
2022 broke the redesign. All six rules got rekt.
The six exposure rules and portfolio designs were finalized before I looked at their 2022 results.
The term for this is an out-of-sample test: evaluate the finished design on data that was not used to build or tune it. The 2022 period tested the finished rules on data that had not influenced their design. It was not another opportunity to improve the answer after seeing it.
Every redesigned rule produced a larger 2022 loss and a deeper drawdown than the same exposure rule under the original portfolio design.
Six rules entered the test. Every redesign made its matching result worse.
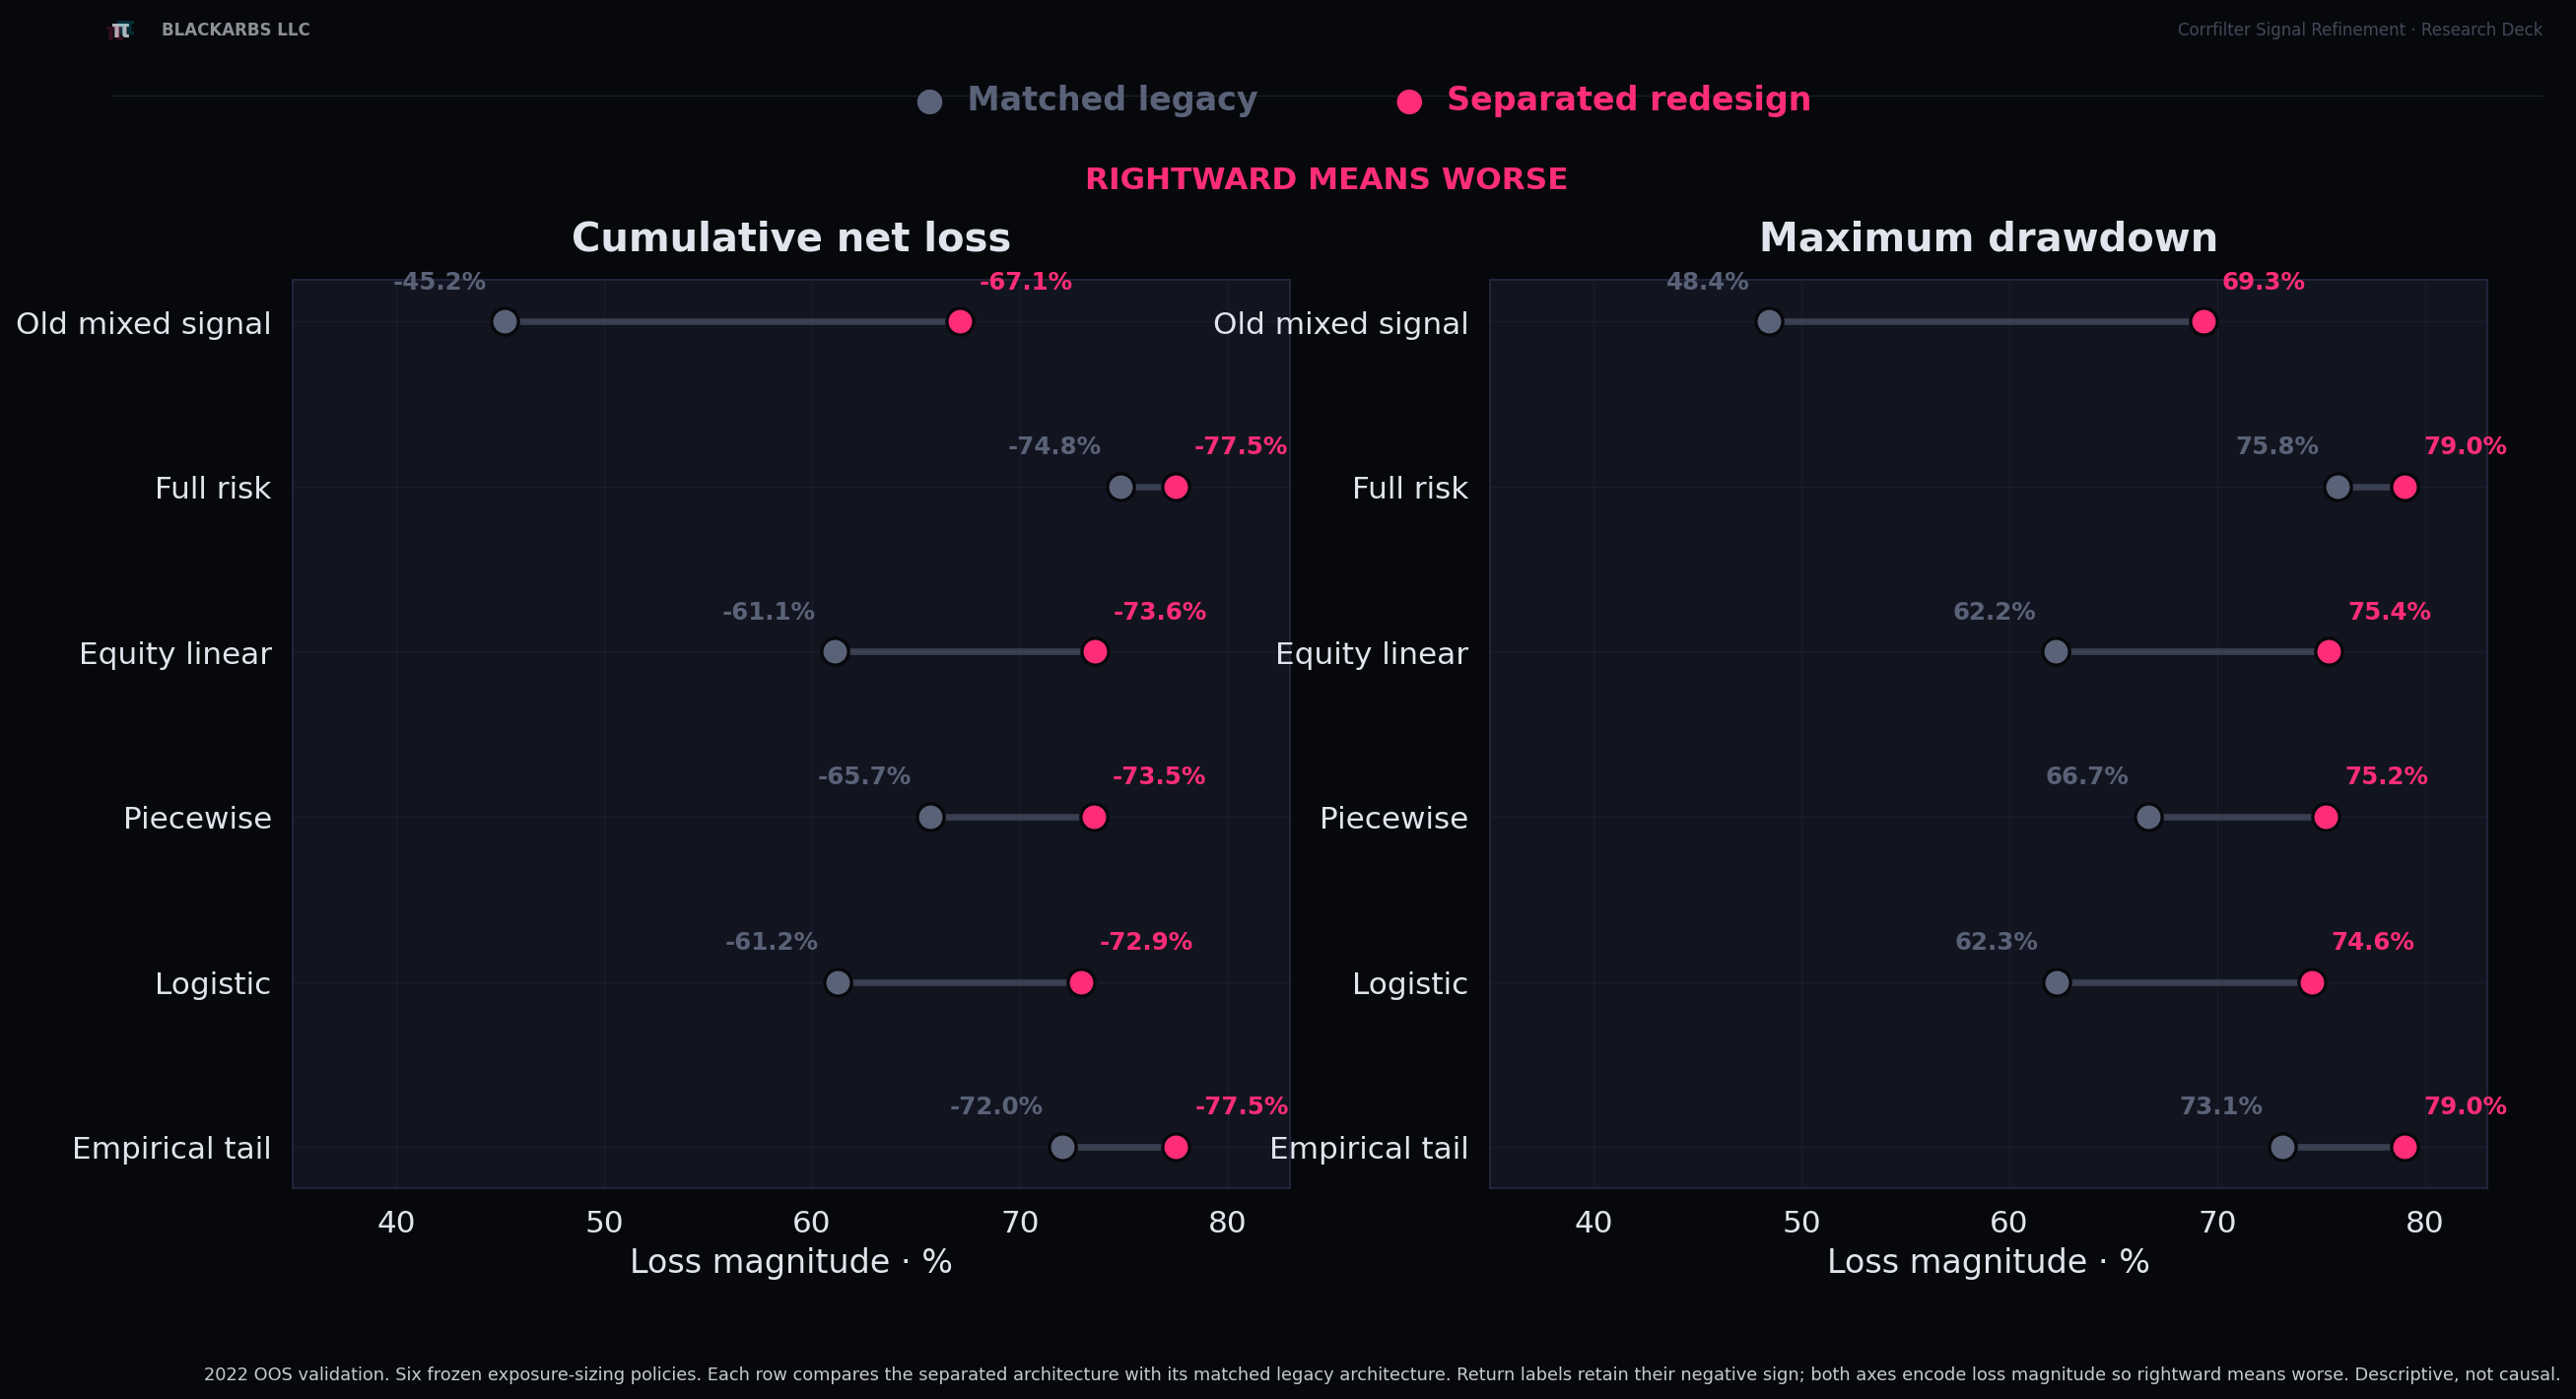
Figure 3: The development-period ranking did not survive the 2022 out-of-sample test.
The portfolio weights revealed where the extra losses came from:
| Average 2022 portfolio weight | Legacy architecture | Separated architecture |
|---|---|---|
| UPRO + TQQQ | 34.2% | 56.4% |
| TMF | 22.2% | 22.8% |
| SHY | 43.6% | 20.9% |
| 2022 cumulative net return | -61.1% | -73.6% |
| 2022 maximum drawdown | -62.2% | -75.4% |
TMF barely changed.
Approximately 22 percentage points moved from SHY into leveraged equities.
The allocations followed the redesigned formula exactly. But the redesign changed which assets the capital budget was allowed to buy.
Originally, the 56.4% active-risk budget was split between leveraged equities and long-term Treasuries: 34.2% in UPRO and TQQQ, plus 22.2% in TMF.
After the redesign, leveraged equities alone consumed 56.4% of the portfolio. TMF remained near 22%, so the extra equity allocation came almost entirely from SHY. The formula preserved the 56.4% number but changed it from a mixed equity-and-Treasury budget into a leveraged-equity allocation.
Same number. Different assets. Much more leveraged-equity risk.
The one allocation rule that survived
The failed redesign revealed one rule worth preserving:
Treasury hedge quality should decide whether to keep the proposed Treasury hedge. It should not decide how much leveraged equity to own.
The correction left the original UPRO and TQQQ weights untouched. Hedge quality could reduce only the proposed TMF allocation. Any TMF allocation rejected by the hedge-quality test moved to SHY instead of increasing equities.
new_UPRO = original_UPRO
new_TQQQ = original_TQQQ
new_TMF  = original_TMF * hedge_quality
new_SHY  = original_SHY + original_TMF - new_TMF
That created a hard portfolio rule:
- rejected TMF cannot increase UPRO;
- rejected TMF cannot increase TQQQ;
- TMF cannot exceed its original proposal;
- rejected hedge capital can move only to the safe destination.
The correction improved the 2022 result for each of the six exposure rules.
It still did not rescue the strategy.
For that same equity-linear rule, the corrected architecture improved the 2022 return from -61.07% under the original portfolio design and -73.58% under the redesign to -54.68%.
SPY returned -19.58%.
The best corrected rule still trailed the benchmark by approximately 21 percentage points. After repeatedly resampling the 2022 return paths, the median risk-adjusted result remained negative for all six corrected rules. For five rules, even the 90% uncertainty range remained entirely negative. The sixth range reached zero, but did not establish a positive result.
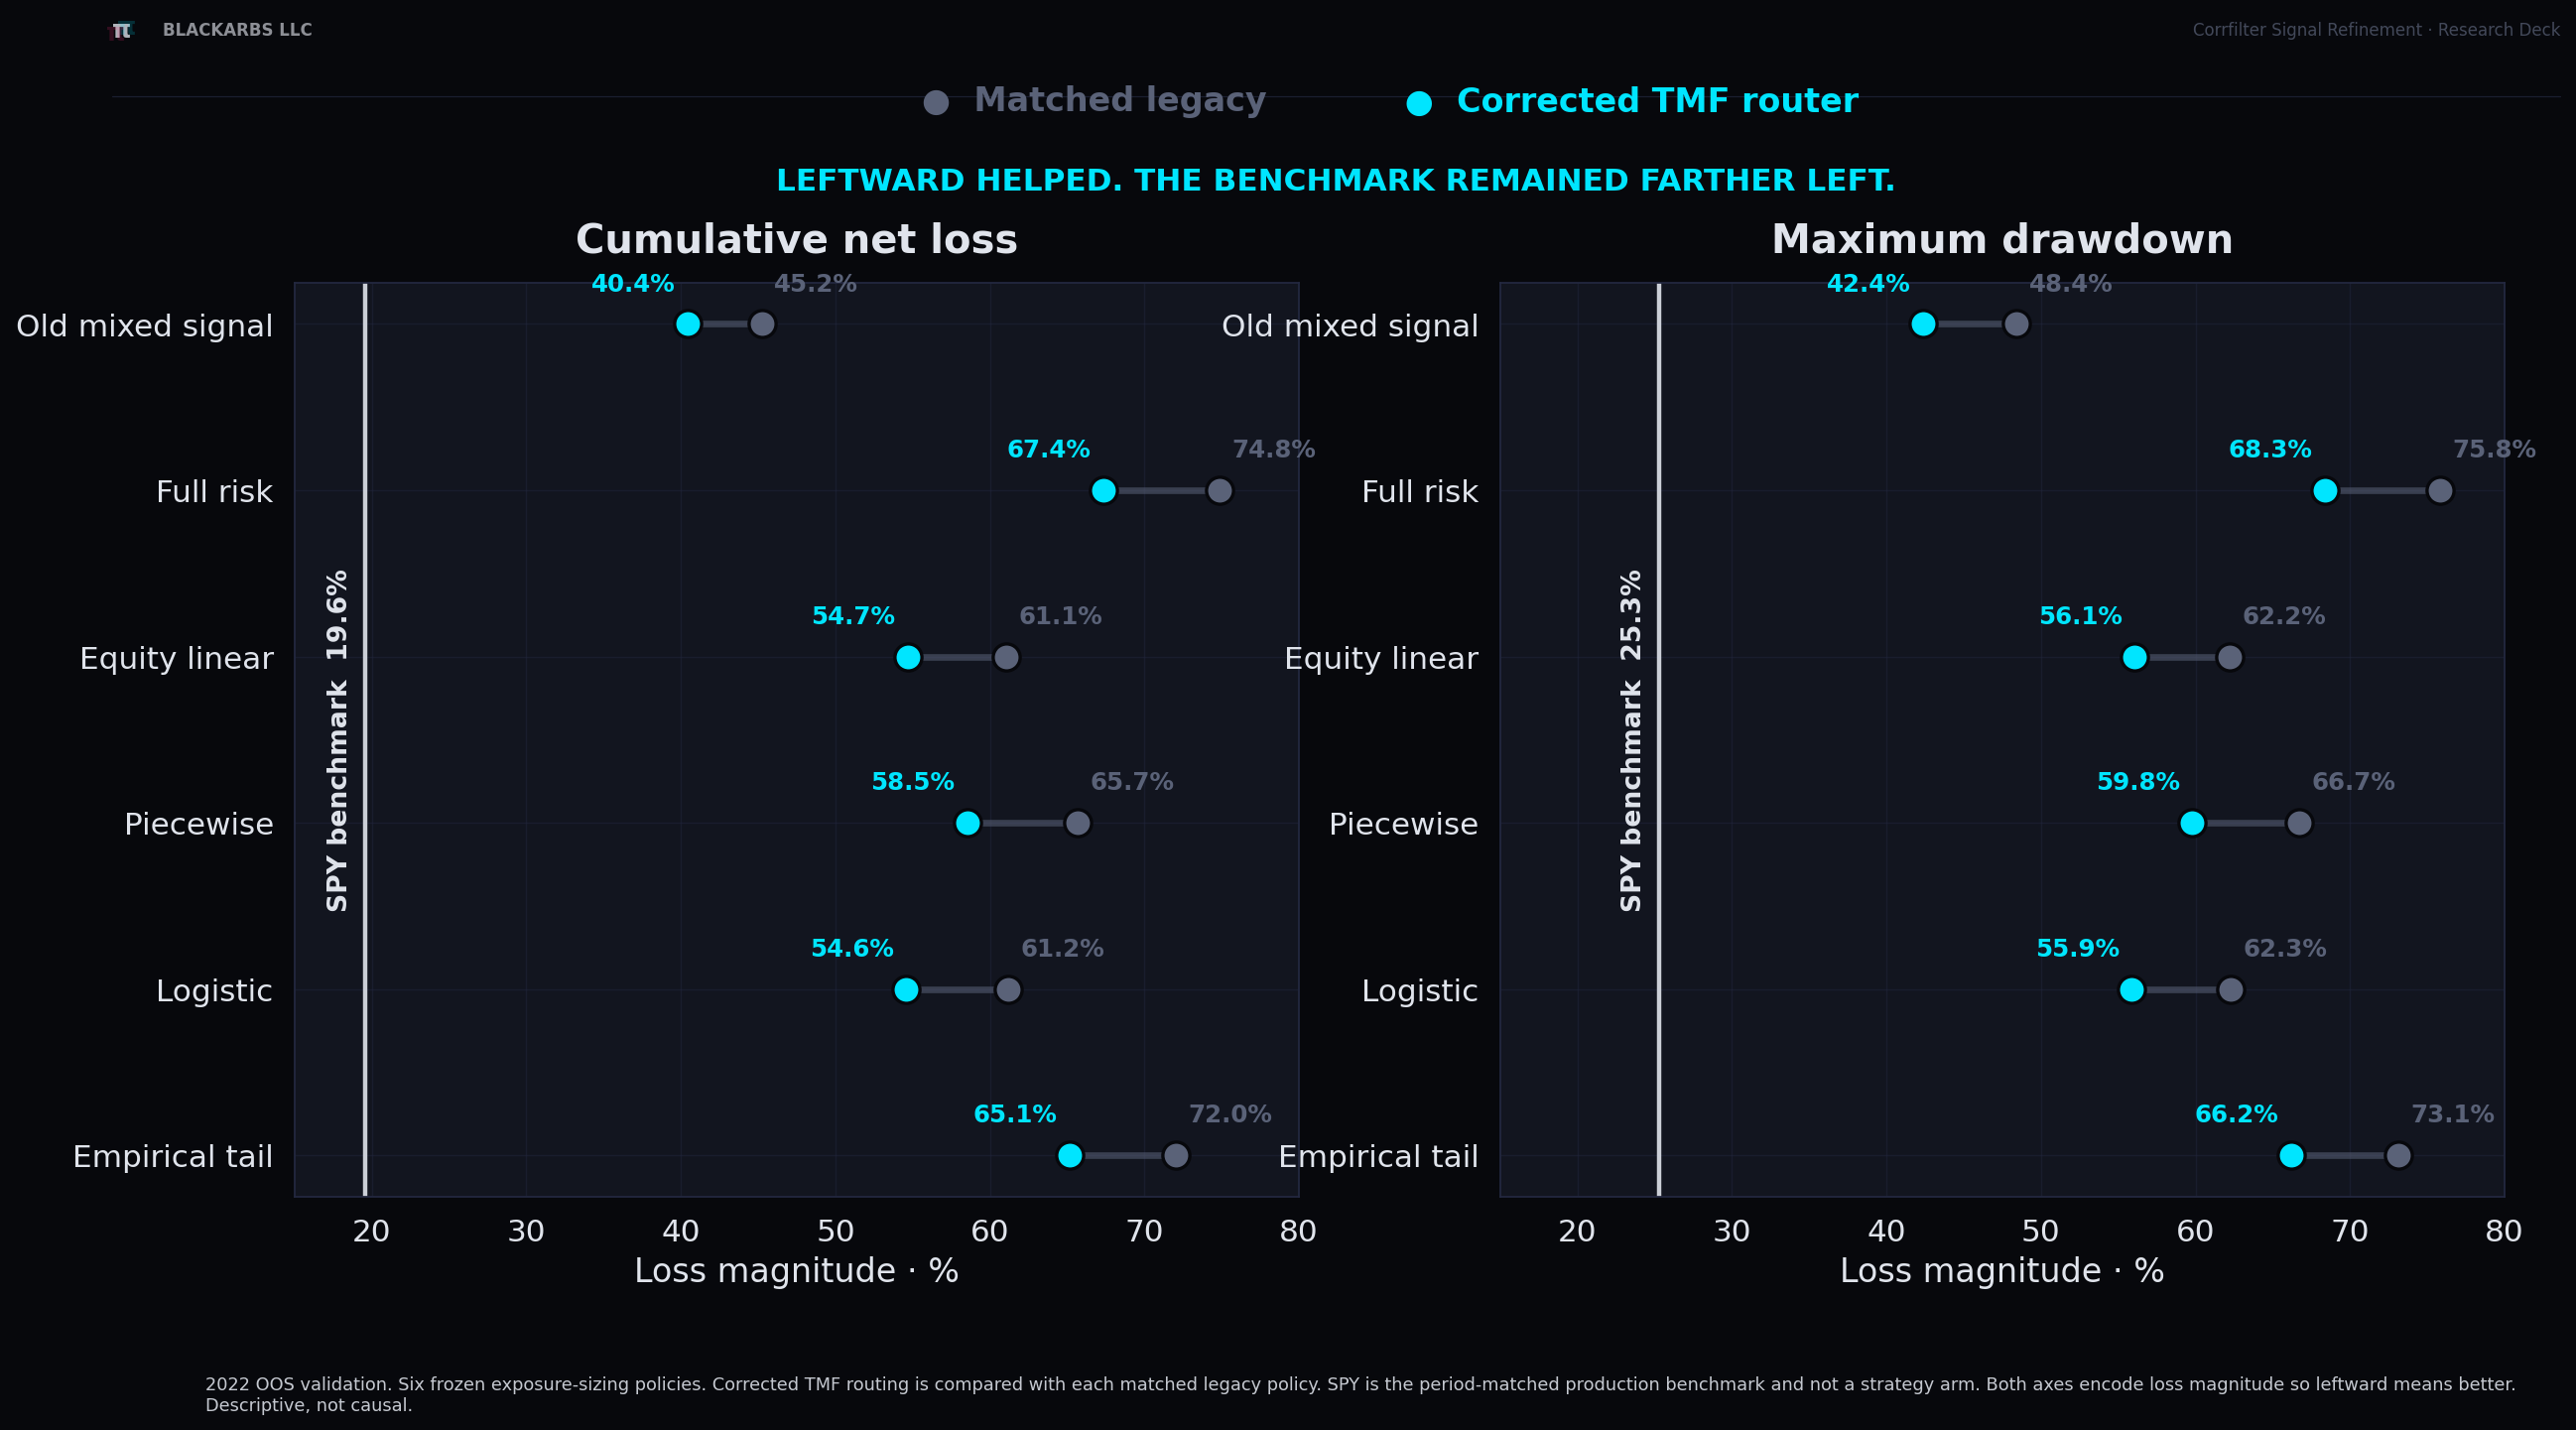
Figure 4: Every correction helped. None earned promotion.
The research process survived. Corrfilter did not.
The final result was not a new trading strategy.
It was a better decision process.
Audit
Tie every return, allocation, and benchmark to one run before interpreting performance.
Isolate
Separate what a signal measures, how the portfolio uses it, and how much market risk the resulting allocation creates.
Gate
Define the return, drawdown, recovery, cost, and benchmark requirements before testing the final untouched data. Do not spend the final clean dataset on a strategy that already failed its validation requirements.
The final 2023 through mid-2025 data remains unopened. Corrfilter would have needed to pass the 2022 out-of-sample test before earning access to it. It did not.
Had it passed, the next step would have been to lock the complete experiment before opening the holdout: the final strategy rules, benchmark, trading costs, intended investor outcome, acceptable drawdown and recovery limits, and the exact results required before moving toward production.
The true holdout gets opened once.
It should answer a capital question defined in advance. It should not become another dataset for making the strategy look better.
Why this matters beyond Corrfilter
A backtest can pass every software test while the portfolio quietly takes a different kind of risk.
A report can display a benchmark without proving that the benchmark belongs to the same run.
A cleaner-looking signal can improve a backtest simply because the resulting portfolio holds more leveraged exposure.
A corrected strategy can improve every comparison and still fail the investor's actual mandate.
That is why research needs more than an optimizer and an equity curve.
It needs traceable inputs, clearly separated portfolio decisions, and a validation rule capable of rejecting the strategy.
The pipeline advanced.
Corrfilter did not.
Interactive slide report
Open the complete interactive report in a new tab.
The report includes the complete evidence chain, the separated signal analysis, the 2022 out-of-sample comparisons, and the uncertainty tests.
When your own results stop agreeing
If your research backtest, live or paper implementation, portfolio weights, benchmark, and final performance report no longer agree, optimization is probably not the next step.
Reconciliation is.
Maybe a backtest improved after a refactor, but no one can explain whether the signal got better or the portfolio simply took more risk. Maybe live or paper returns no longer match the backtest, and no one can trace the difference to timing, costs, execution, or portfolio construction. Maybe the benchmark, allocation history, and final report cannot be traced back to the same run.
If that sounds familiar, send me a note with what changed, which results no longer agree, and whether the discrepancy is blocking a launch, allocation, investor report, or retirement decision.
Disclosure: This is educational research-process review only. It is not personalized investment, trading, legal, tax, or financial advice.
Best,
Brian Christopher, CFA
BlackArbs LLC