Estimated Longevity of a Retirement Portfolio in Years (Python)

Post Outline:
- What is Shortfall Risk (Shortfall Probability, Ruin Risk, Risk of Ruin etc.)?
- Issues with Traditional Shortfall Risk Estimates
- Key Insights (Solutions)
- Python Code (Implementation)
What is Shortfall Risk (Shortfall Probability, Risk of Ruin, etc.)?
portfolio value will fall below some minimum acceptable levelover some time horizonAnalystNotes.com
Issues with Traditional Shortfall Risk Estimates
In the article "It's Time to Retire Ruin (Probabilities)" the author, Moshe A. Milevsky, takes an insightful stance regarding estimates of retirement portfolio longevity.
His approach addresses some key problems traditional, portfolio ruin risk estimation methods have, including:
It's time to retire ruin (probabilities), moshe a. milevsky, cfapubs.org
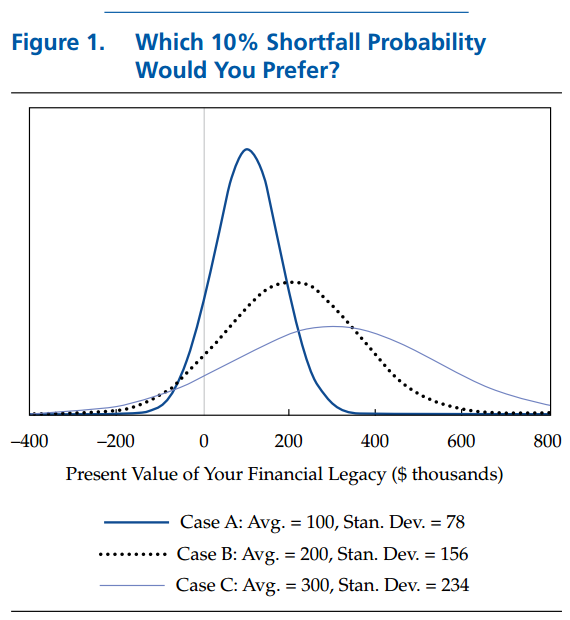
- No one can definitively say what a "good" shortfall probability is (is 10% good or bad?, 5%, 1%, 0.01%...N%?).
- Should a portfolio with an estimated 9% shortfall probability dominate a portfolio with a 10% shortfall probability?nbsp;Is the theoretical 1% reduction in shortfall risk economically significant and/or accurate?
- Portfolios with the same shortfall probability can have wide variation in their distributions of possible outcomes. Which 10% risk of ruin is better?
- There is not enough market history to sample from. A retiree might have 30 years of retirement. Reliable asset class data extends back approximately 167 years.
- Typically, financial advisers are unlikely to both:
- understand the subtle, critical assumptions underlying the model estimates and their effects
- effectively communicate the model contraints, limitations, and facts to their clients
(@blackarbsceo: The keys above are my paraphrased interpretations from the original article)
Key Insights (Solutions)
Ultimately his insight is that financial advisers need to focus the portfolio longevity discussion around two key issues:
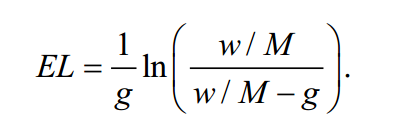
- What is the estimated real long term growth rate (after ALL fees and taxes) that your portfolio assumes, and how did you derive that estimated growth rate (G).
- Discuss portfolio longevity in units of years not probabilities. By expressing units in years the discussion is more "tangible" and analogous to a Dr.'s estimate of our remaining lifespans.
To address both points he derives a stylized model to estimate portfolio longevity.
IT'S TIME TO RETIRE RUIN (PROBABILITIES), MOSHE A. MILEVSKY, CFAPUBS.ORG
Variables:
- w = annual cash withdrawal in dollar units (ex. $50,000)
- M = current total "nest egg" value measured in dollars (ex. $1,000,000)
- g = annual growth rate of portfolio after all fees and taxes measured in percent (ex. 2%)
Python Code (Implementation)
To create a useful piece of code we need functions to process the following inputs:
- N years of remaining life (integer)
- A range or array of possible growth rates in decimal form
- Estimated annual cash spend/drawdown (integer/float)
- Estimated uncertainty of annual cash spend (decimal percent)
- An array of future annual cash spend estimates
- Current value of nest egg (float/integer)
The first two helper functions I define below are roundPartial, and estimate_longevity. The roundPartial function takes a float value and a resolution value between (0,1) and outputs a rounded decimal to the percentage resolution given. The estimate_longevity function takes the variables (w, M, g) and outputs the estimated portfolio longevity in years rounded to the nearest quarter.
The next function is the create_cash_spend_range. This function takes the estimated annual cash withdrawal (ex. $50,000), our estimated uncertainty about that cash withdrawal as a percent (ex. 0.25 is +/- 25%), and a default number of cash withdrawal estimates to return in our array (ex. 5).
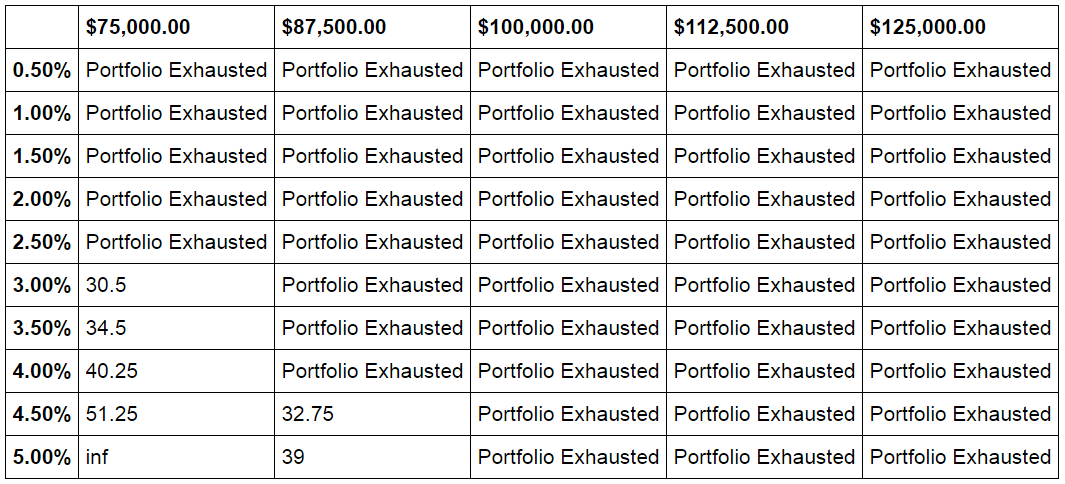
This next function is a fun one. It creates a sensitivity table based on our nest egg value, estimated annual cash withdrawals, and estimated growth rates. I also define a helper function to easily create the money string format I use for the column labels. Note that in creating the dataframe the function iterates through both numerical and string arrays (lists) simultaneously using the zip function in order to maintain the index (str) and calculate the estimated longevity values (floats/integers).
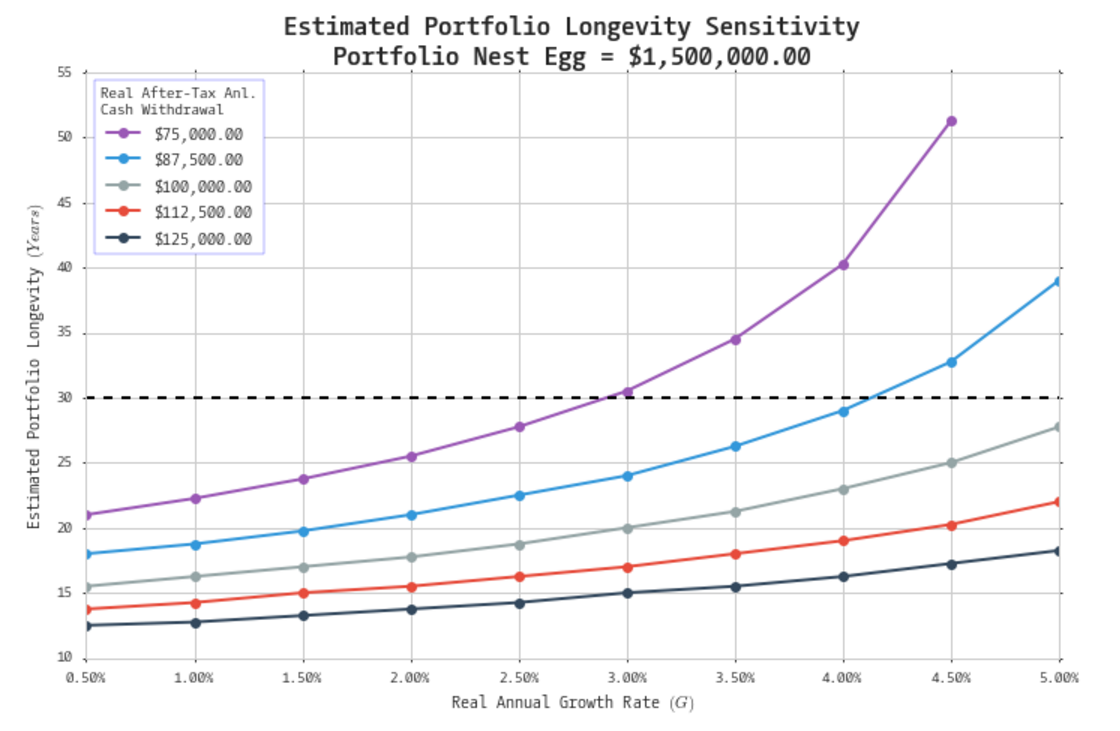
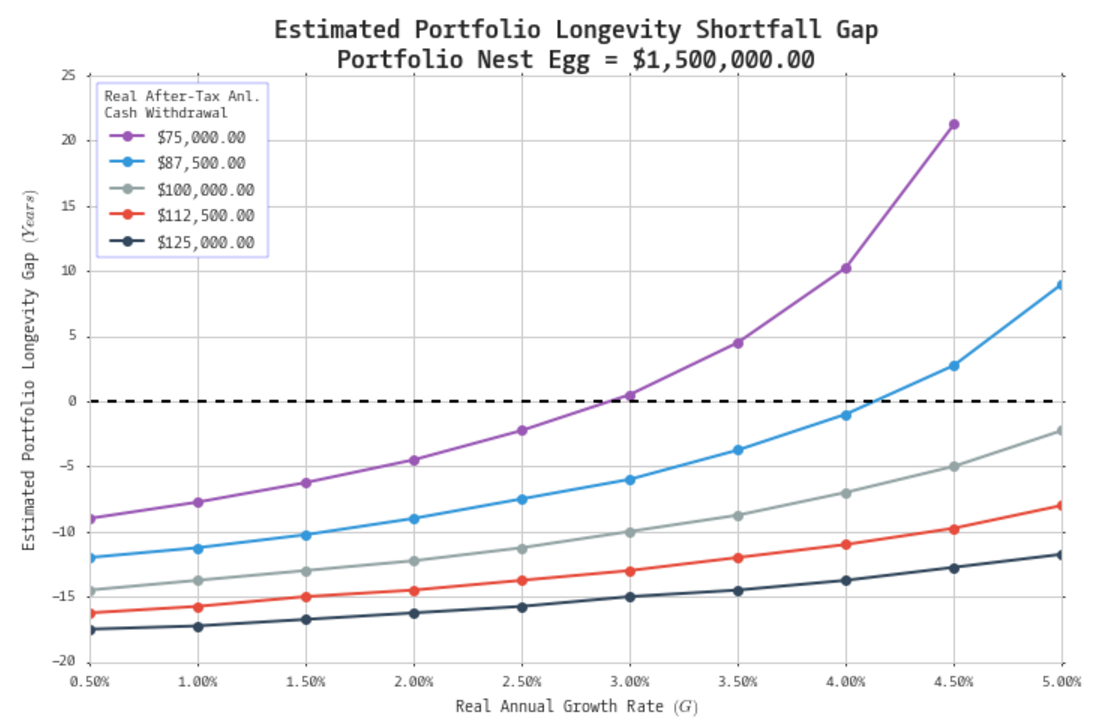
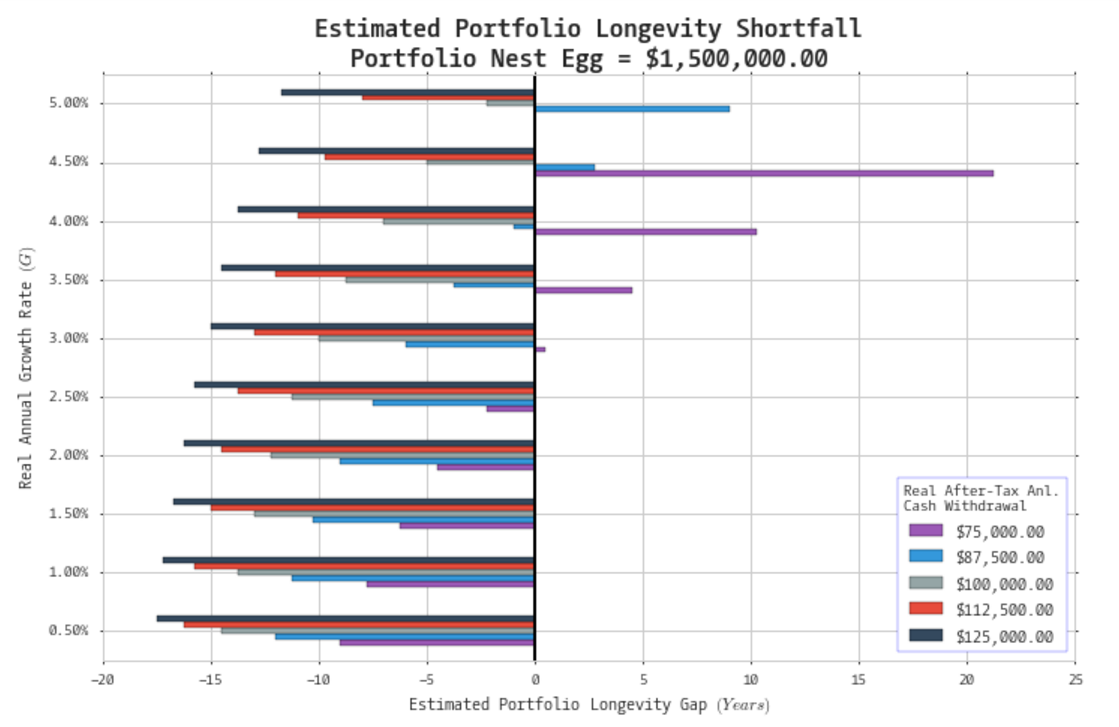
With the hard work complete I define several convenient plotting functions to summarize our output. First is a simple line plot function that takes our nest egg value and shows how our portfolio longevity estimates vary with our return estimate (g) and our annual cash withdrawal rates. It also plots a horizontal line to display the estimated personal lifespan remaining. The second plot function takes our sensitivity table, and estimated personal lifespan and plots the estimated longevity of the portfolio less the personal lifespan remaining. In this way it plots the gaps between a portfolio's estimated longevity and an estimated lifespan in number of years. The final function takes the sensitivity table, and estimated lifespan and plots the same information as the second function except as a vertical barplot where the horizontal "length" of the bars represents the number of years the portfolio is expected to last above or below the expected lifespan of the individual.
Now we can input our assumptions and output the results!
Note that for an assumed return and annual cash drawdown, a portfolio that lies above the estimated personal lifespan may theoretically never be exhausted. Python expresses these values as "inf" and "nan" meaning that they will not be plotted.
blackarbs llc
BLACKARBS LLC
BLACKARBS LLC
BLACKARBS LLC
Enjoyed this post?
Subscribe for more research and trading insights.
By clicking "Subscribe," you agree to our Terms of Use and acknowledge our Privacy Policy. You can unsubscribe at any time.
No spam. Unsubscribe anytime.