BlackArbs LLC · Sports Prediction Machines Research
MLB betting-model research · Corrected 2022–2025 test

Two MLB betting models made money—but the evidence is not strong enough to trust yet.

Three model strategies ended with a profit. However, none was reliably above break-even, and retraining models during the season generally produced worse wagers.

3Model strategies that made money in the corrected test.
0Profitable strategies proven reliably above break-even.
6Regression strategies that were reliably unprofitable.
How to read this research

We judged each model by the bets it placed and the money it made

One question

Could an MLB model find bets that made more money than the sportsbook price implied?

Two training schedules

Annual frozen trains once before the season. Within-season updated retrains during the season.

Two betting rules

Fixed keeps one rule. Dynamic may change the model or rule on scheduled dates.

Model strategy

One model, market, training schedule, and betting rule tested together.

Likely range

A range of plausible results after resampling game dates. If it crosses zero, profit could be luck.

What counts as proof

The model must make money after costs on new games, and its likely range must stay above break-even.

Money made on settled bets drives the decision. Prediction scores only help explain the result.

How to read the deck
What the corrected test means

Two MLB betting models made money. We should test them once more.

+$2,032
XGBoost made money when it was trained before the season and then left unchanged. Its likely range was -$1,251 to +$5,065.
+$1,645
LightGBM control made money under the same frozen setup. Its likely range was -$1,271 to +$4,573.
8 / 22
Cases where changing the selected model during the season beat keeping one rule fixed. The earlier 16-of-22 result was wrong.

Test these two moneyline models once on new data. Do not restart the losing regression search or another broad updating experiment.

Updated decision
Narrative roadmap

The evidence answers four questions in decision order

1

What changed?

The corrected test found three model strategies that made money.

2

What is established?

The profit is real in this sample, but the uncertainty is too wide to prove a lasting edge.

3

Why only two models?

Earlier tests ruled out broad model searches, frequent retraining, and simply adding more existing features.

4

What happens next?

Test the two strongest models once on new data, then stop or add genuinely new information.

Each chapter answers one question before the next begins.

24-slide decision story
BlackArbs LLC · MLB betting research
I
Chapter 1 · What the corrected test showed

Some models made money.
The evidence was still too weak to trust.

Which profits survived corrected accounting, and which explanations failed?

Pure-sleeve economics

Three classifiers finished positive; regression remained the graveyard
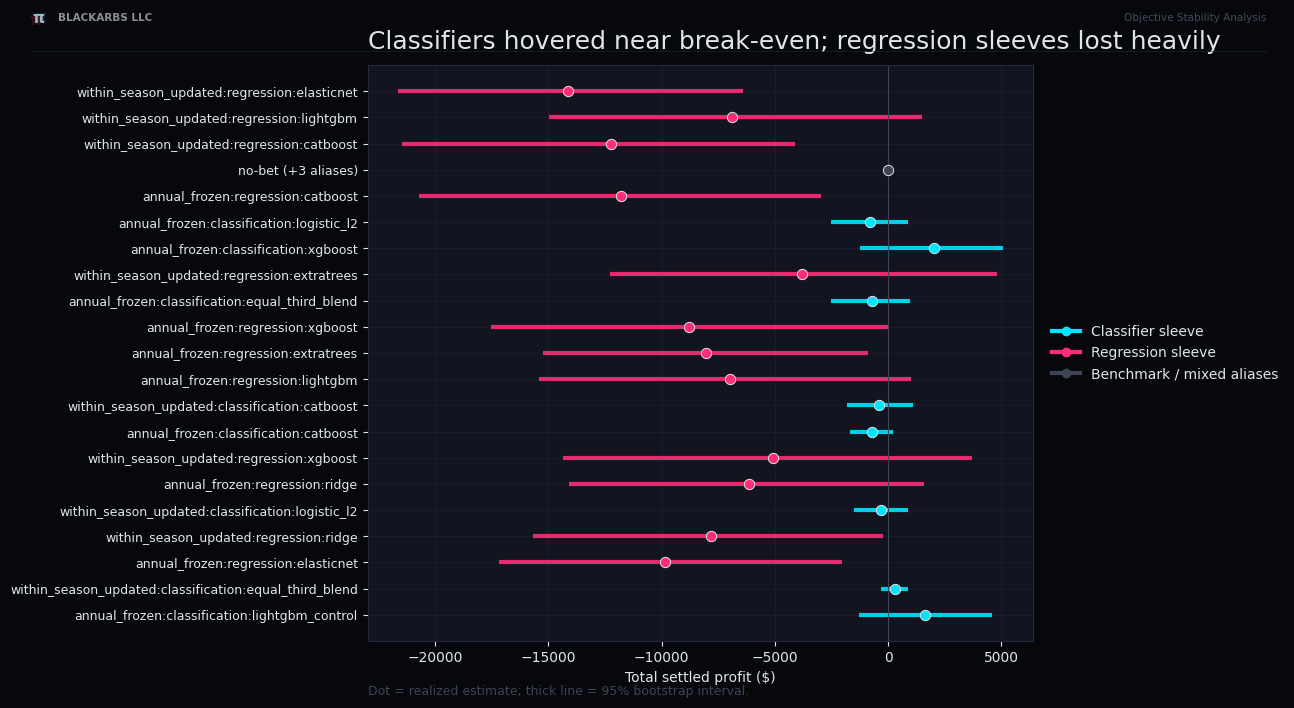
Model-sensitive pure-sleeve profit estimates and date-block uncertainty intervals

Annual-frozen LightGBM control and XGBoost finished positive. The updated equal-third blend was slightly positive. Six regression intervals remained wholly below zero.

Canonical outcomes
Absolute ROI

Positive classifier returns remained hypotheses, not deployment evidence

Promoted classifier ProfitROIAmount riskedMaximum drawdown SPM Sharpe
LightGBM control+$1,645 +7.18% $22,900 $902 1.38
XGBoost+$2,032 +8.03% $25,300 $1,611 1.54
All metrics use the same governed 310-date outcome calendar. Profit, risk, ROI, drawdown, and Sharpe no longer mix action-date scopes. Both existing date-resampled profit intervals still cross zero.
Fixed versus dynamic policy

Dynamic beat fixed in only 8 of 22 matched comparisons
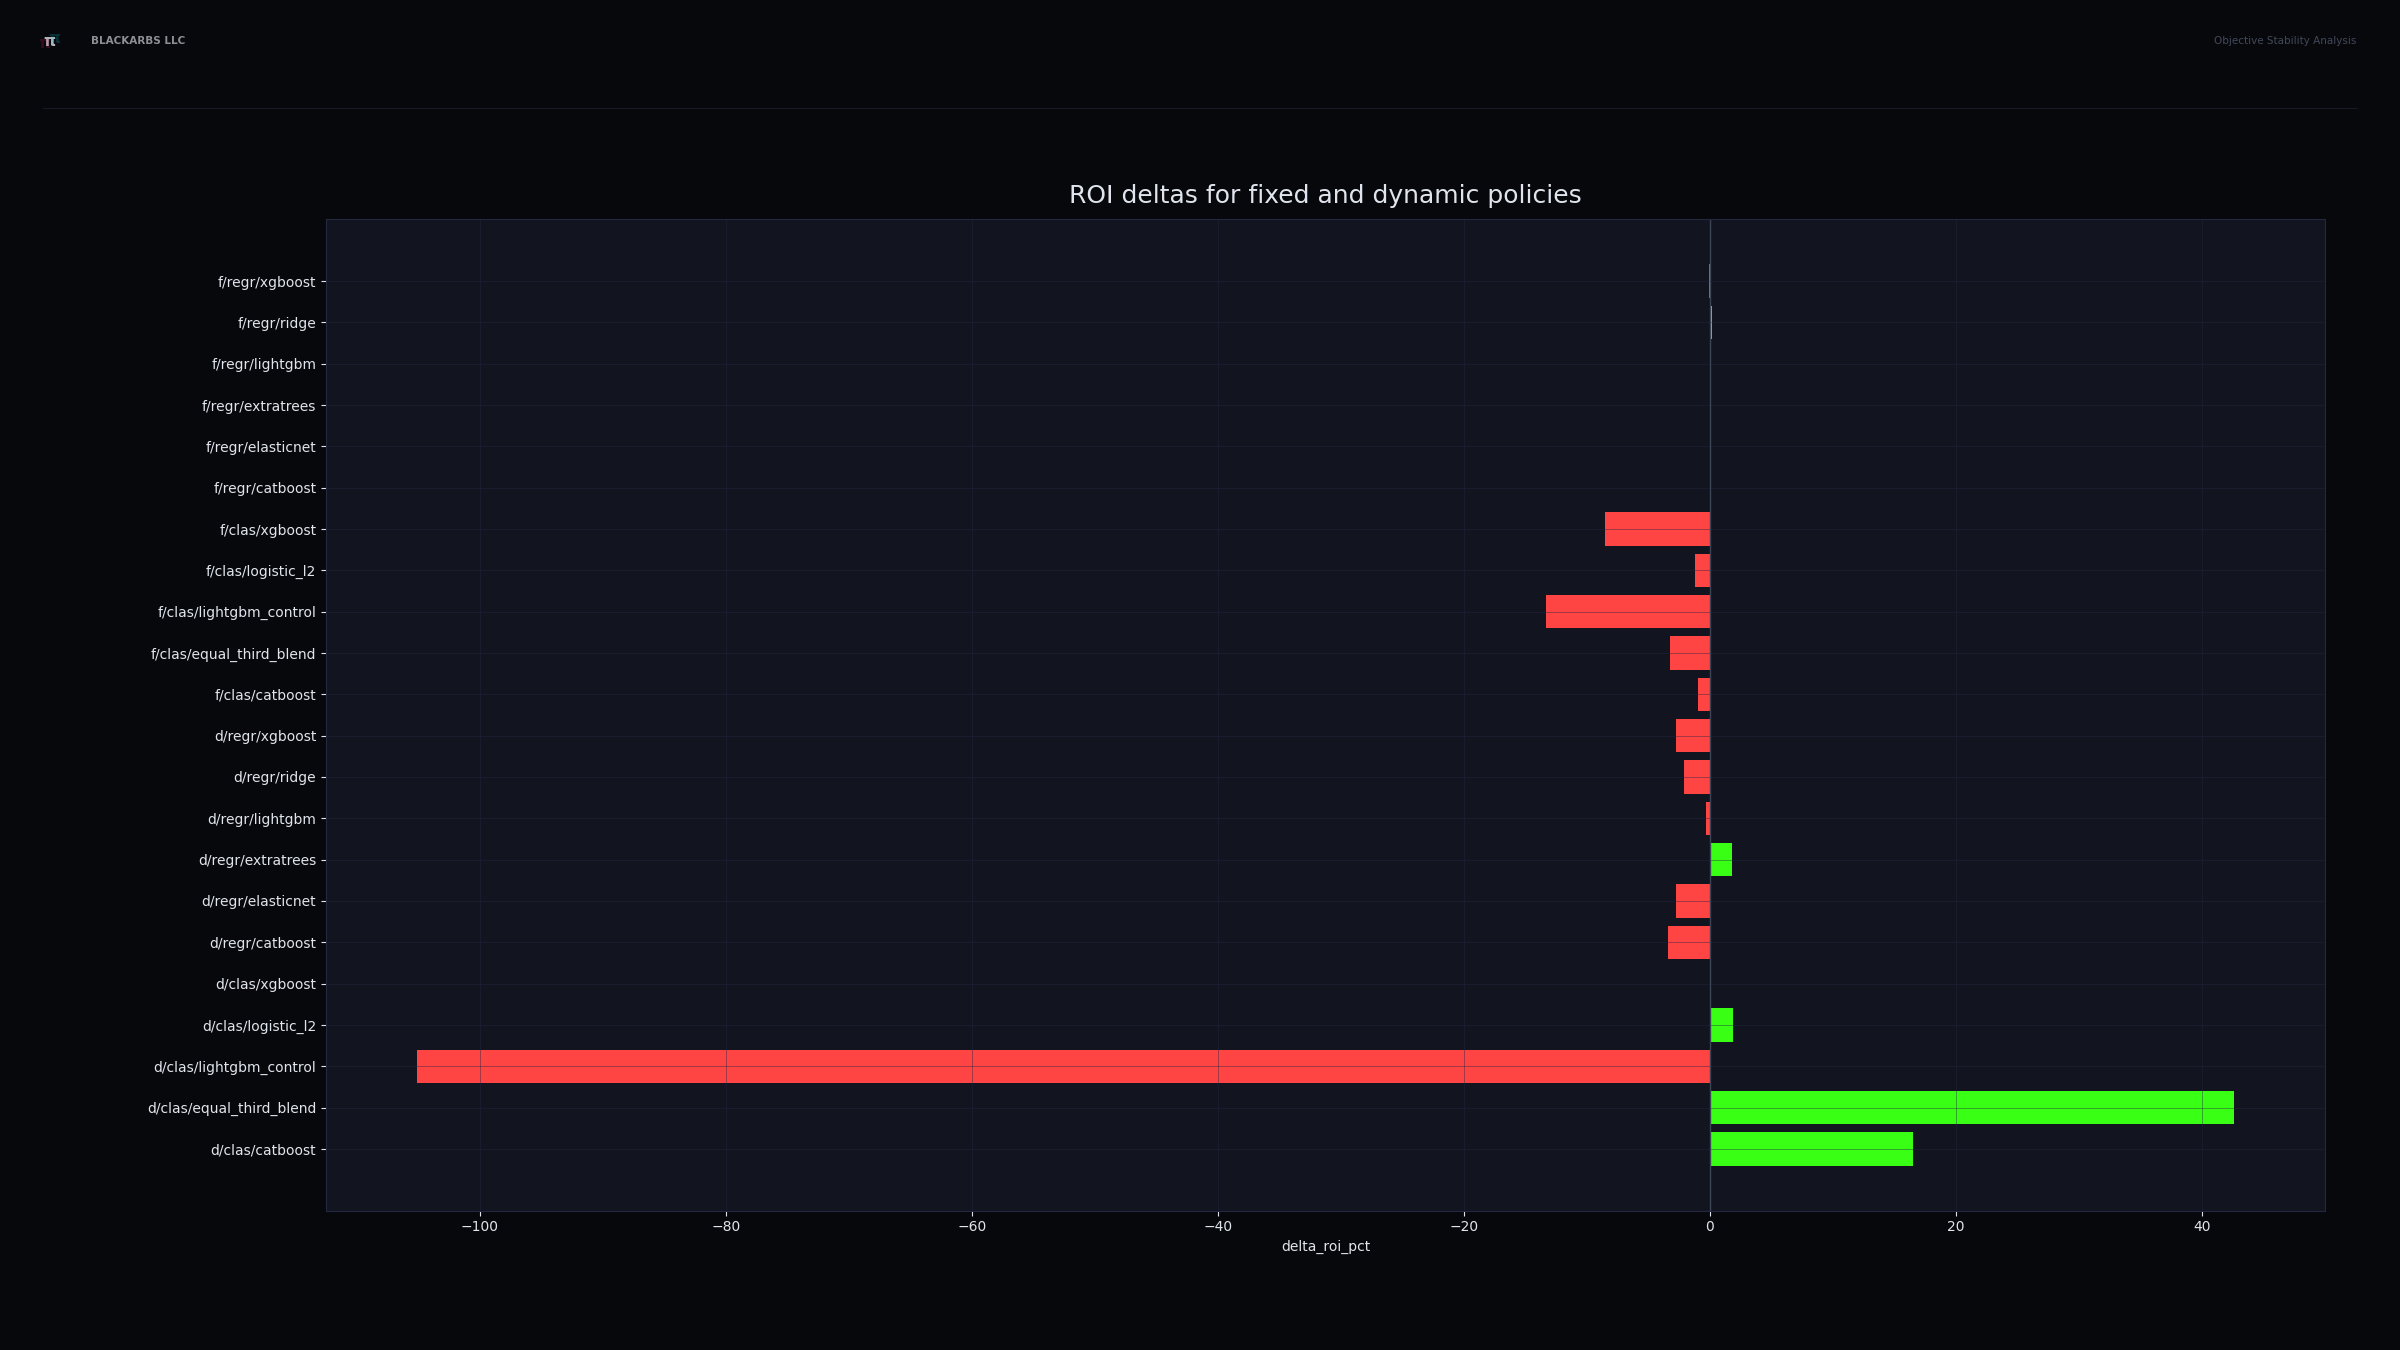
Corrected fixed-versus-dynamic ROI by model arm and training window

Dynamic won 4 of 11 comparisons in each training window. Median dynamic-minus-fixed ROI was -0.09 points annual-frozen and -2.29 points updated.

Supersedes 16 / 22
Market contribution

Annual-frozen moneyline was the exception inside broad spread and totals losses
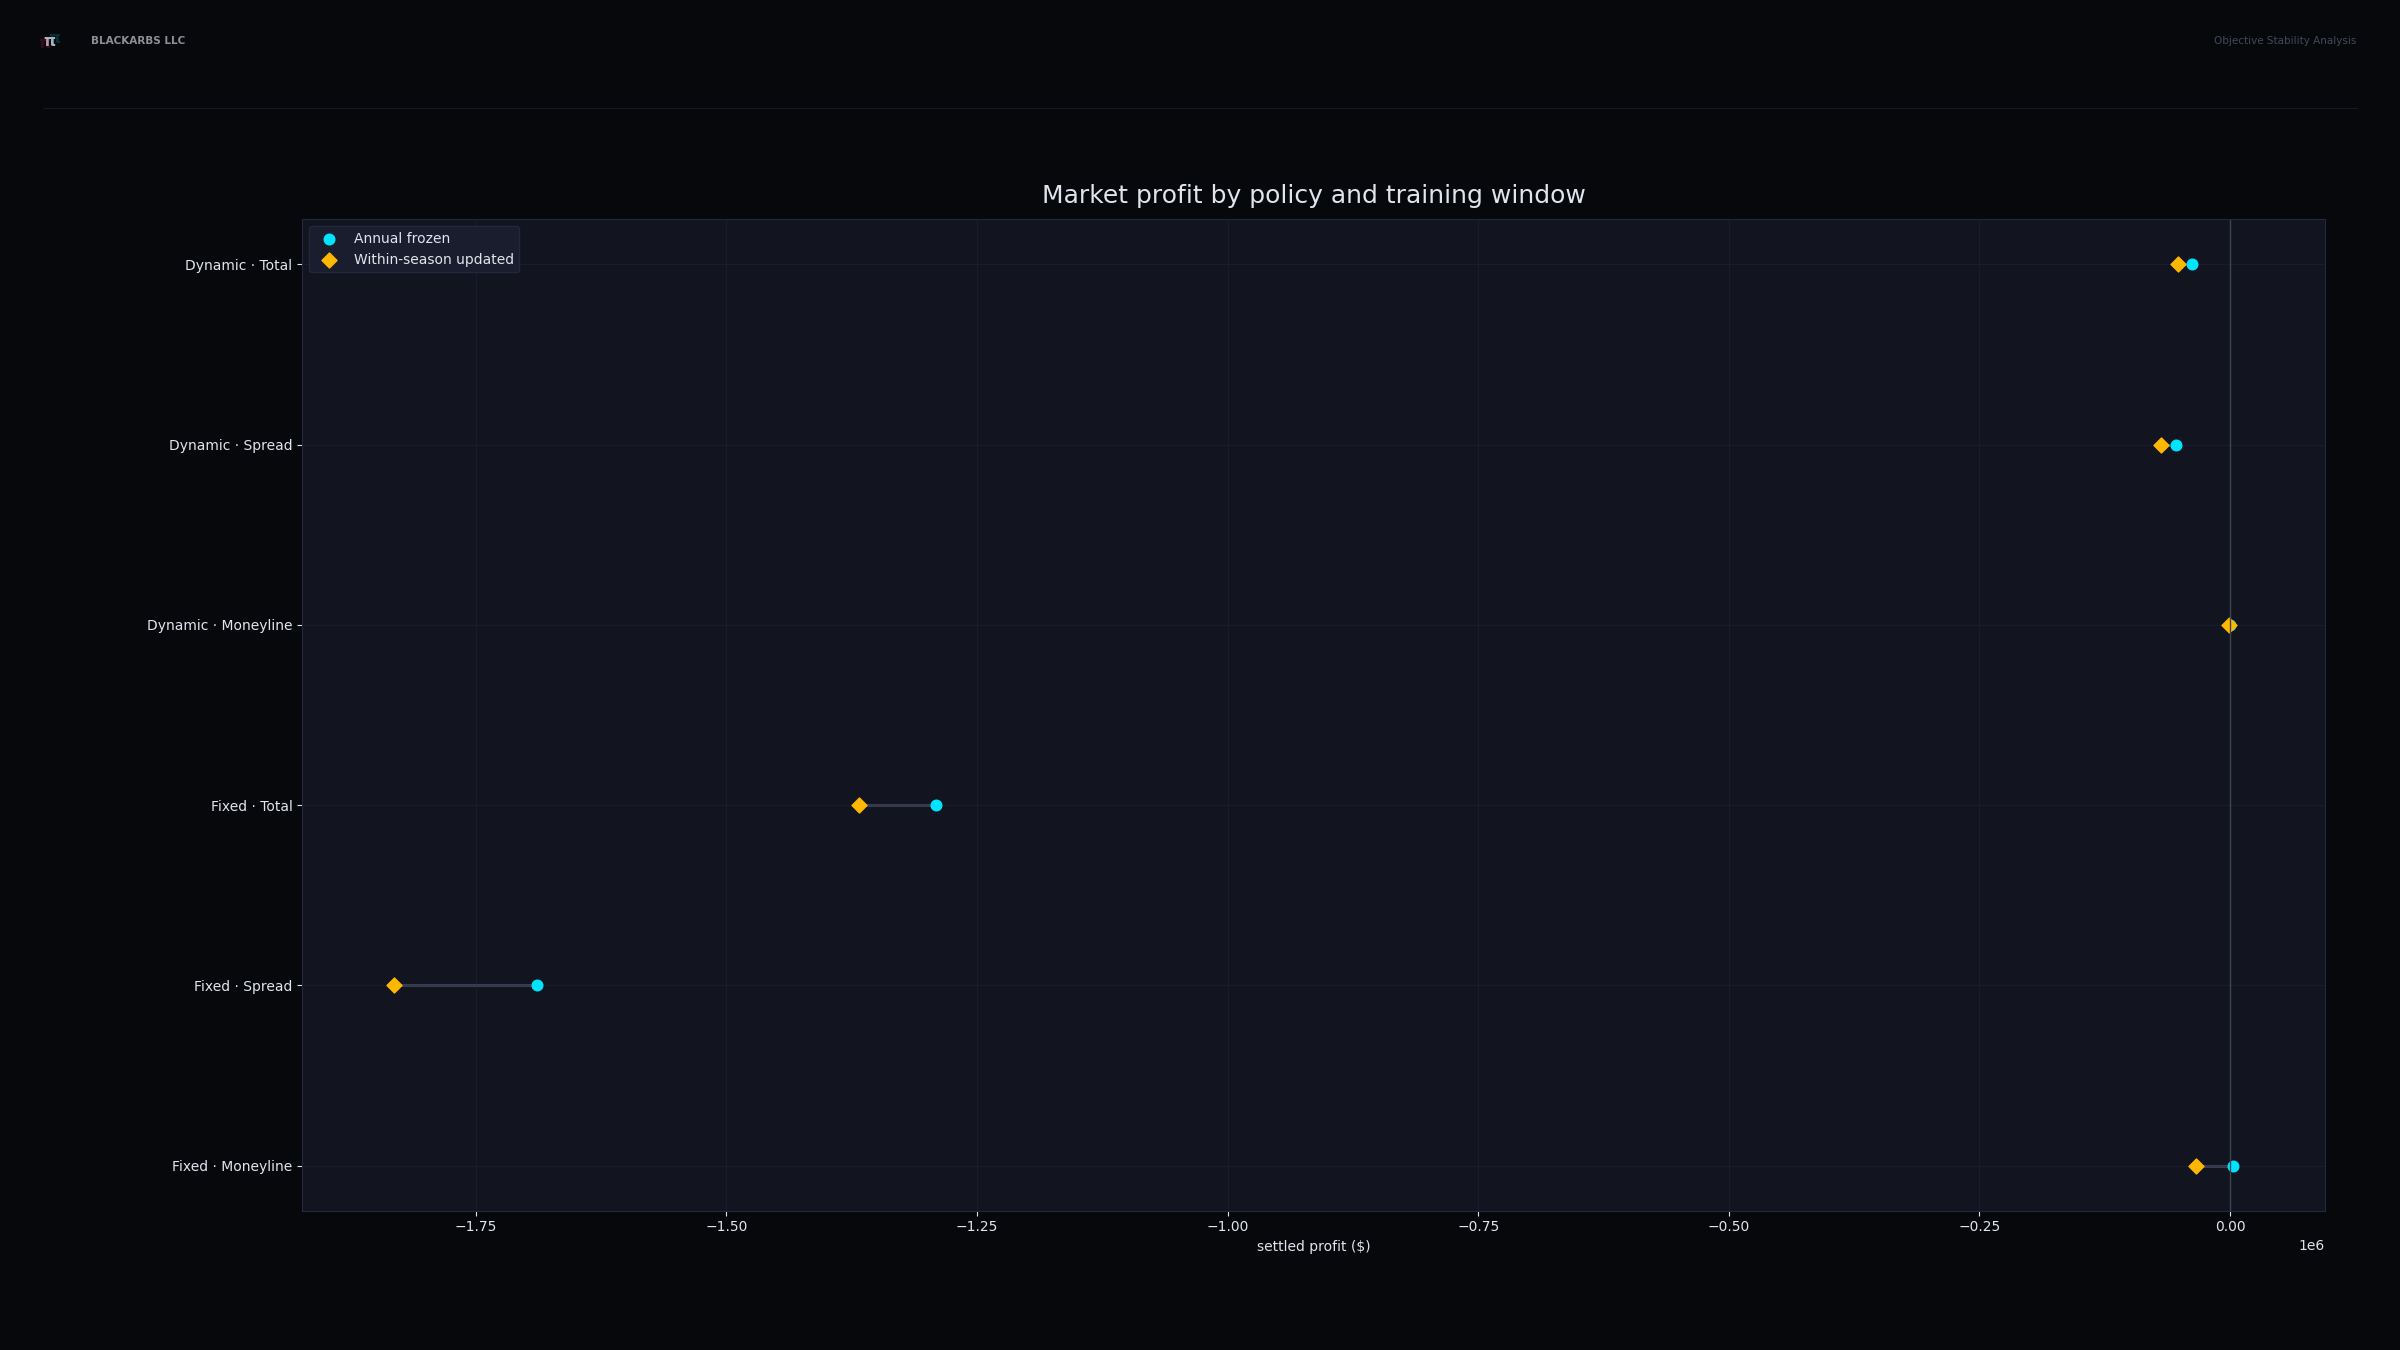
Corrected fixed and dynamic profit by market and training window

Moneyline changed sign under annual-frozen training. Spread and totals remained materially negative, and within-season moneyline reversed sharply below zero.

Market context
Decision change

Updating replaced most dynamic wagers and one-third of fixed identity overlap remained
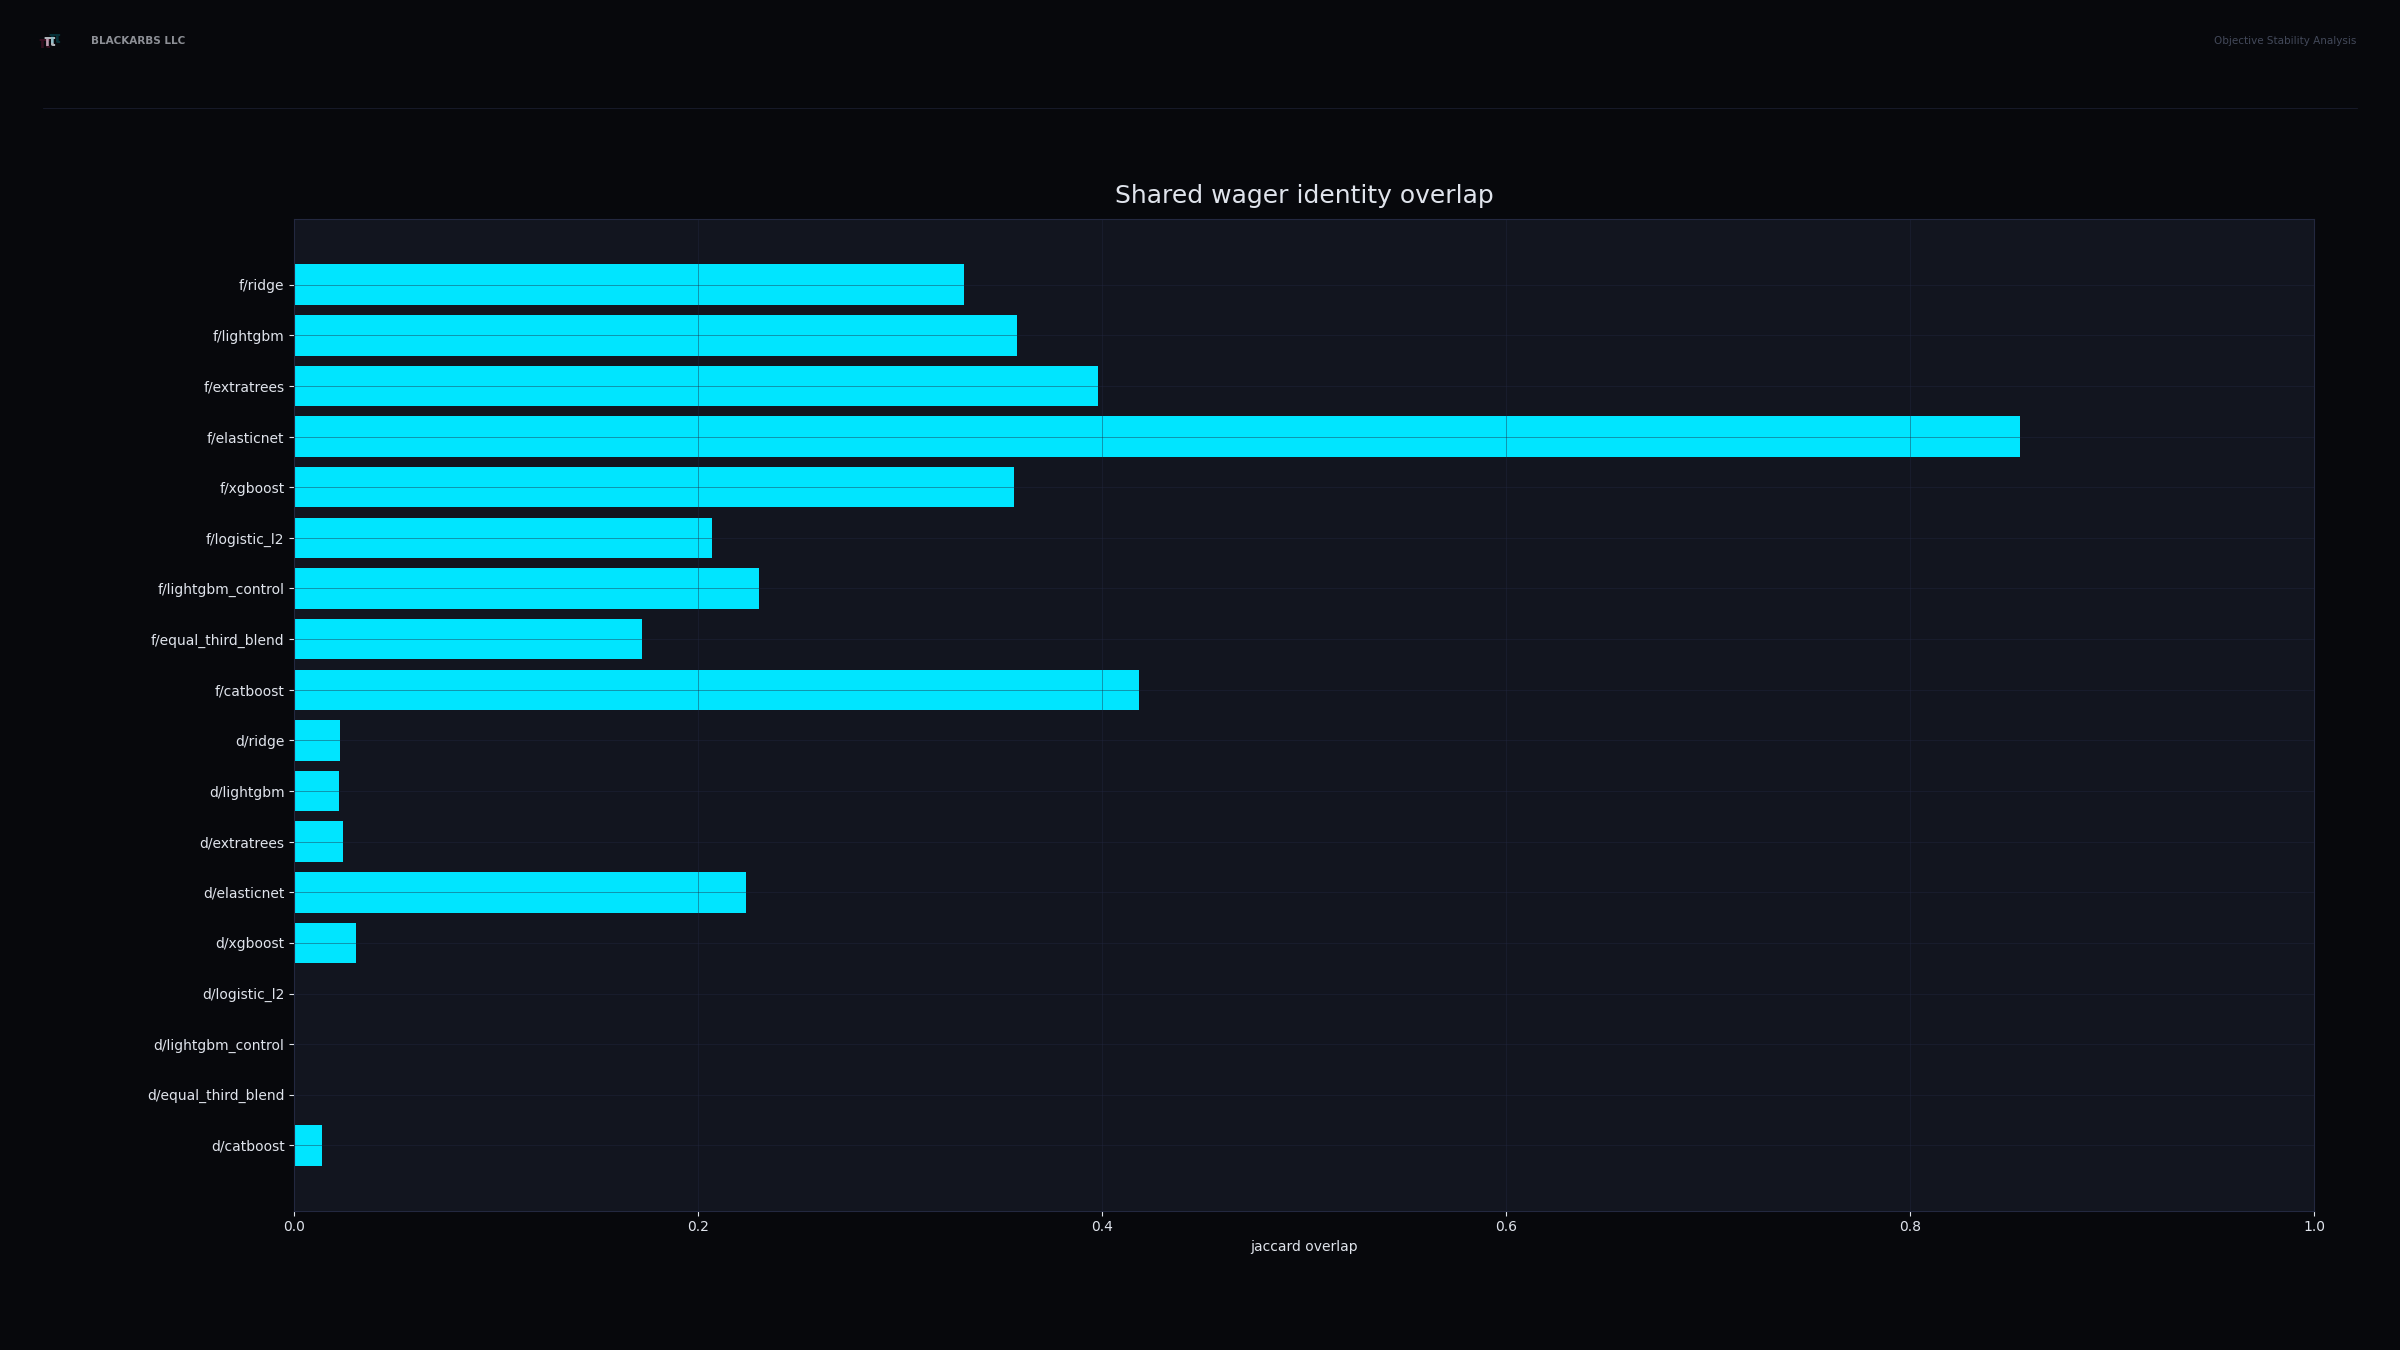
Corrected annual-versus-updated wager overlap for fixed and dynamic policies

Median annual/updated Jaccard overlap was 0.014 for dynamic policies and 0.332 for fixed. Updating changed exposure materially.

Identity-aware overlap
Window-specific attribution

Updated-only wagers lost more in every sleeve
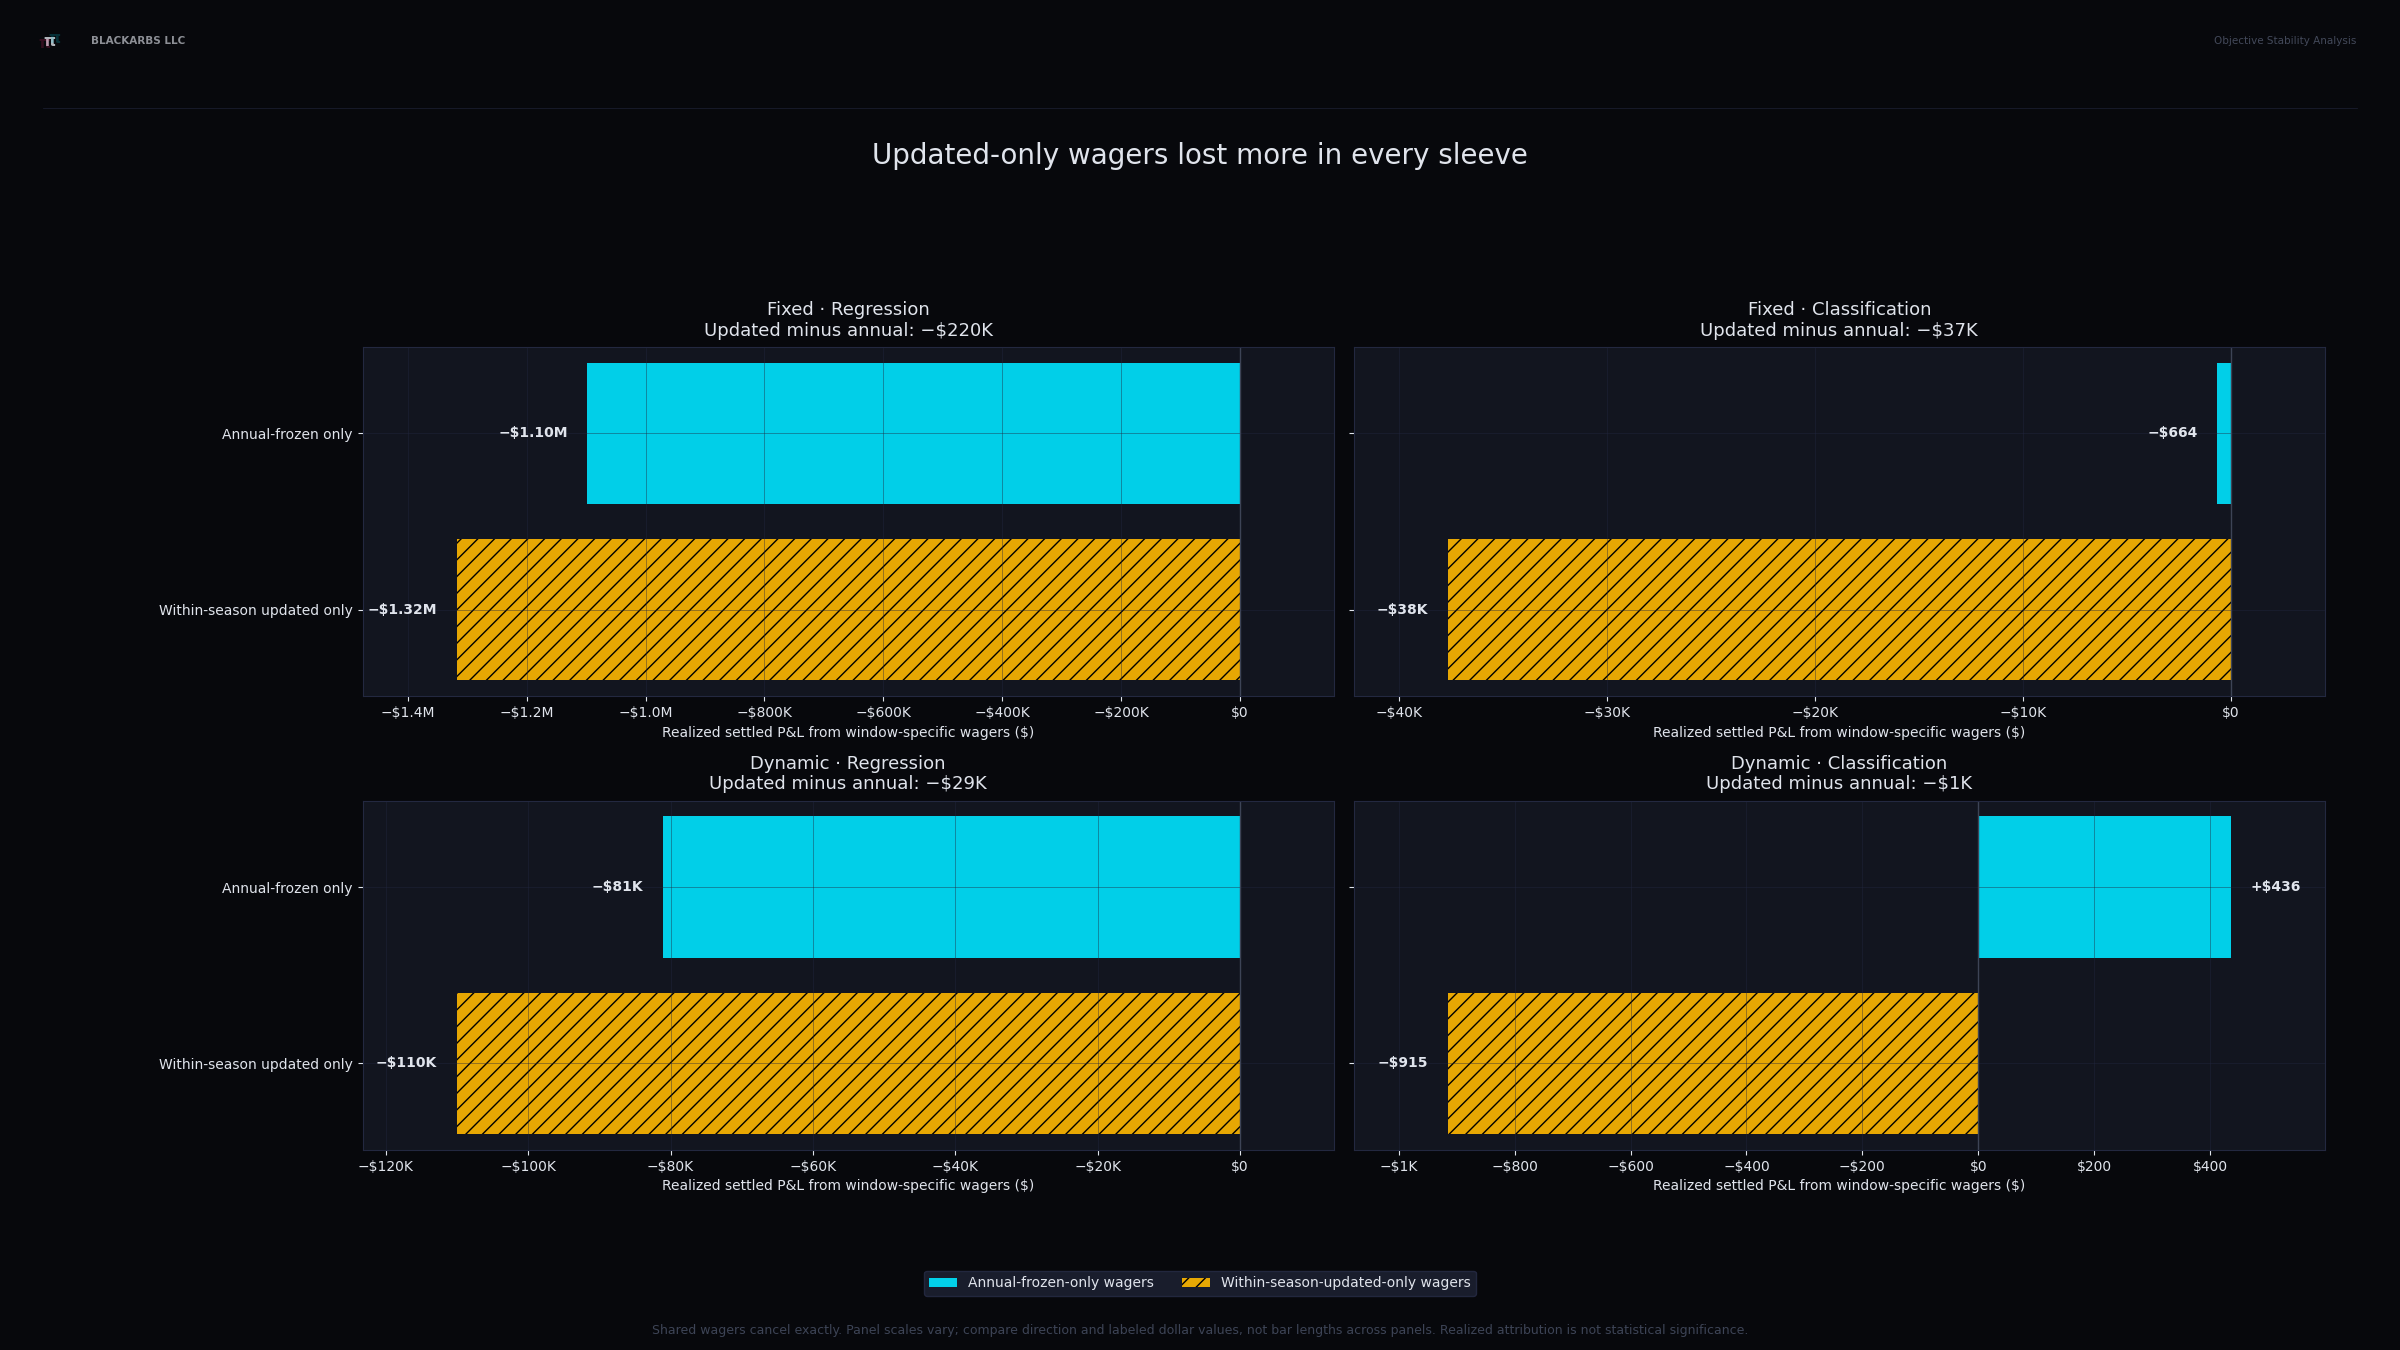
Realized P&L from annual-frozen-only and within-season-updated-only wagers across four sleeves

Shared wagers cancel exactly. Updated-only selections worsened arm-aggregated realized P&L by about $287K across fixed and dynamic classifier and regression sleeves.

Changed decisions hurt
Chapter 1 synthesis

The corrected test supports one more check—not deployment or frequent retraining

What the sample showed

  • Three model strategies made money.
  • The two strongest candidates were moneyline models trained before the season.
  • Wagers added by in-season retraining lost more in every group.

What remains uncertain

  • Every positive classifier interval crossed zero.
  • The sample does not prove lasting positive returns.
  • The two models may have made money on many of the same wagers.

What we ruled out

  • Changing models during the season was not broadly better.
  • Frequent retraining did not create the profitable pocket.
  • The regression models do not deserve another promotion test.

We now look backward only to explain why the surviving decision is narrow.

Why Chapter 2 follows
BlackArbs LLC · MLB betting research
II
Chapter 2 · Why the broader search failed

Different models chose different bets.
None found a reliable edge.

Why did five earlier tests say not to repeat the same broad search?

Fixed classifier comparison

Earlier screen: the sportsbook price beat every learned classifier

ArmBrier score ↓Replay ROI
Market no-vig0.247067Not a wager strategy
Equal-third blend0.247817-7.43%
LightGBM0.249005-12.01%
CatBoost0.249665-4.80%
Logistic L20.251692-2.99%
XGBoost0.252797-4.98%

What Brier score means

It rewards probabilities that are both accurate and honest. Lower is better. The sportsbook's margin-free probability beat every learned classifier.

What it does not mean

Market no-vig is a benchmark probability, not an executable betting policy.

Even before portfolio selection, the learned classifiers failed to improve the strongest available probability baseline.

Experiment 1
Fixed classifier chart package · Replay

Earlier screen: promising selection evidence did not become profit

Classifier Selection-time lower boundForward replay ROI
Equal-third blend+10.6%−7.43%
CatBoost+13.5%−4.80%
XGBoost+9.1%−4.98%
Logistic L2−0.5%−2.99%
LightGBM control+19.0%−12.01%
All five executable arms lost forward. The sportsbook no-vig row was a probability benchmark, not a wager strategy.
Earlier regression test

Regression models chose different bets, and all lost money

ModelBetsProfitReturn
Elastic Net8,719-$43,508-4.99%
XGBoost6,474-$32,804-5.07%
Ridge6,357-$35,467-5.58%
CatBoost6,228-$35,978-5.78%
Extra Trees6,766-$39,317-5.81%
LightGBM6,399-$41,412-6.47%

The models did not choose the same bets

  • They shared 33% to 53% of all bets.
  • They shared only 17% to 33% outside moneyline bets.
  • Every model lost in every season tested.
  • Every model lost in each market when seasons were combined.

The models differed enough that shared bets cannot explain the losses.

Earlier test 6
Separate residual experiment · Policy attribution

Earlier screen: dynamic selection worsened residual ROI by 3.59 points

Residual portfolio ROI · fixed
−4.35%
Residual portfolio ROI · dynamic
−7.94%
Dynamic − fixed: −3.59 percentage points
FanDuel moneyline · out-of-sample 2022–2025 · intervals resample UTC game dates. The category label is explicit; there is no hidden y-axis.
Full-feature follow-up · Primary endpoint

Full-feature screen: 156 inputs still failed to improve on FanDuel no-vig

Family Residual minus market log loss95% intervalResult
Elastic Net+0.000200[−0.000004, +0.000396]Inconclusive
CatBoost+0.001145[+0.000422, +0.001833]Worse
LightGBM+0.001164[+0.000230, +0.002138]Worse
Ridge+0.001296[+0.000565, +0.002026]Worse
XGBoost+0.001548[+0.000693, +0.002441]Worse
GAM+0.091747[+0.072833, +0.116702]Materially worse
Lower is better. Five families were detectably worse; Elastic Net was inconclusive, not better.
Chapter 2 synthesis

Five separate tests reached the same result: our existing data was not enough

What failed repeatedly

  • The models did not reliably improve on the sportsbook's probability estimate.
  • Models that predicted better still did not make money.
  • Regression models chose different bets, and all still lost.
  • Changing models during the season changed the bets without improving returns.
  • Adding all 156 available inputs still did not improve on the sportsbook price.

What that means

Do not run another broad model search using the same information. Test whether the two profitable models can repeat on new data.

The appendix keeps the detailed test history. The main story keeps only the findings that change the decision.

Why Chapter 3 follows
BlackArbs LLC · MLB betting research
III
Chapter 3 · What survived

Two MLB betting models
are still worth testing.

What must we lock before the test, and what result would count as proof?

The two surviving hypotheses

LightGBM and XGBoost made money, but neither result is proven

MetricLightGBM controlXGBoost
Profit+$1,645+$2,032
ROI+7.18%+8.03%
Settled wagers229253
Amount risked$22,900$25,300
Maximum drawdown$902$1,611
SPM Sharpe1.381.54
Profitable seasons3 / 32 / 3
Largest day / absolute daily P&L1.8%1.6%
Shared wagers: 146 · Sharpe owner: SPM domain · grain: settled_wager · annualization: 365 · risk-free: 0.0% · minimum support: 30 · scope: governed 310-date outcome calendar
BlackArbs LLC · MLB betting research
IV
Chapter 4 · What happens next

Confirm once.
Then stop or add new information.

What result would make us continue, and what result would make us stop?

Revised ordered program

Five moves: freeze, attribute, confirm once, then stop or escalate

  1. Lock the LightGBM-control and XGBoost moneyline rules before testing.
  2. Separate bets chosen by both models from bets chosen by only one.
  3. Set betting costs, multiple-testing protection, and date-resampling rules in advance.
  1. Test once on new games and require the full post-cost uncertainty range to stay above break-even.
  2. If both fail, stop reusing the same inputs. Collect new time-stamped data and test whether it improves on the sportsbook's probability.

We must still prove which price was available when each bet was chosen. Test the two models once, then stop or collect genuinely new information.

Updated closeout
BlackArbs LLC · Research conclusion
What survives

Two MLB betting models made money. Test them once on new data. If they fail, stop reusing the same inputs.

FreezeLock the two models' betting rules, available prices, and estimated costs.
ConfirmOn new games, require the entire post-cost uncertainty range to stay above break-even.
EscalateCollect genuinely new time-stamped data only if both models fail.
BlackArbs LLC · Evidence appendix
Trace every claim

How to verify every claim

The main deck uses plain language. The appendix preserves the technical evidence trail.

BlackArbs LLC · Corrected economic evidence
$
Historical experiment · contextual evidence

Some models made money in the corrected test.
The result could still be luck.

Which models made money, how uncertain were the results, and did in-season changes help?

Replay methodology · evidence contract

What one historical dollar means in this deck

Chronology

Annual-frozen models train before each season. Evaluation is out of sample across the governed 310-date 2022–2025 outcome calendar; candidate activity depends on available evidence. Scorecard economics use selected actions on that same calendar.

Price and execution

FanDuel observations feed wager economics. This is simulation-only research evidence—not proof that FanDuel accepted a wager at that price.

Stake

$100 flat risk per selected canonical action. Duplicate model membership does not multiply economic authorization.

Settlement

Canonical settled profit and risk rows drive ROI. Missing, abstained, inactive, no-bet, and active-zero-return states remain distinct.

Friction and capital

Separate execution friction, bankroll limits, and overlapping-capital constraints are not evidenced in this replay package. They are not silently assumed.

Uncertainty

95% intervals resample UTC game dates with 2,000 draws per governed arm. Positive candidates remain unresolved because their intervals cross zero.

Historical experiment · contextual evidence

Annual-frozen moneyline turned positive at the arm-row aggregate

PolicyWindowMoneyline ROI
FixedAnnual frozen+0.63%
DynamicAnnual frozen+0.58%
FixedWithin-season-5.32%
DynamicWithin-season-7.10%

What this supports

  • The surviving positive classifier hypotheses live in annual-frozen moneyline.
  • Fixed and dynamic both contain positive annual-frozen rows.
  • Frequent updating did not create the pocket.

What it does not support

  • Arm rows are correlated exposures, not one combined capital ledger.
  • The pure-sleeve intervals still cross zero.

Confirm LightGBM control and XGBoost directly. Do not attribute the positive pocket to dynamic selection.

Primary opportunity
Historical experiment · contextual evidence

The corrected losses were not confined to one unlucky season
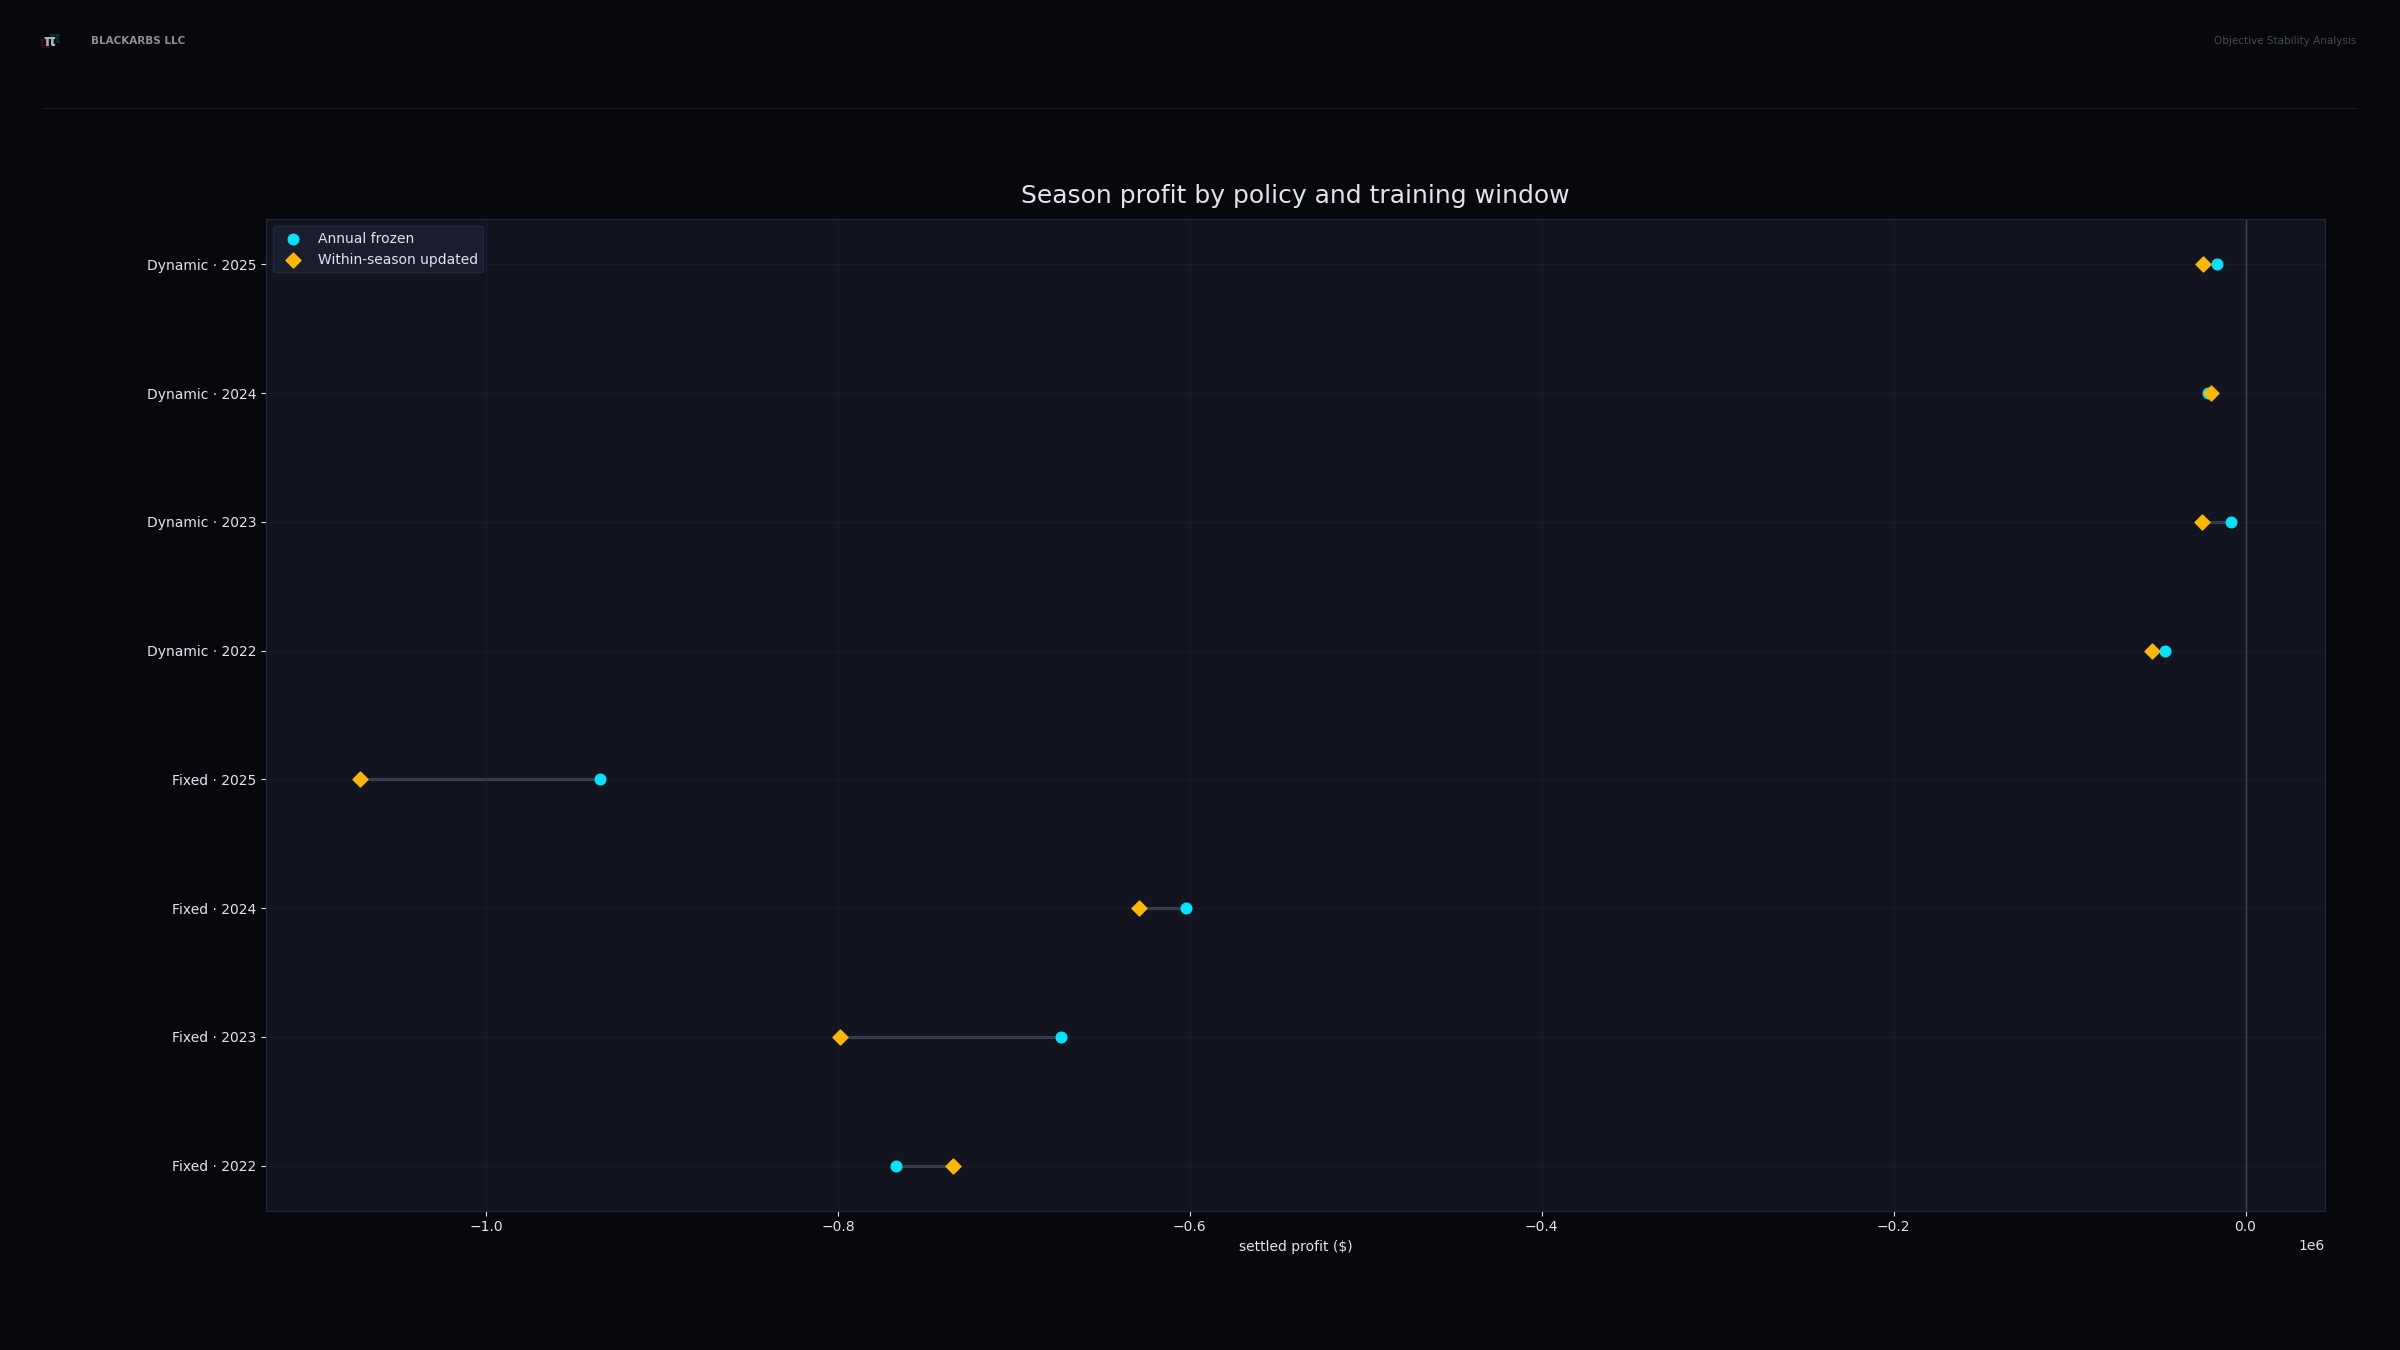
Corrected fixed and dynamic profit by season and training window

Every aggregate season/window cell remained negative. Any moneyline exclusion rule must improve across multiple seasons rather than harvest one favorable regime.

2022–2025 context
Historical experiment · contextual evidence

Dynamic updating produced 10 unresolved arms and one abstention
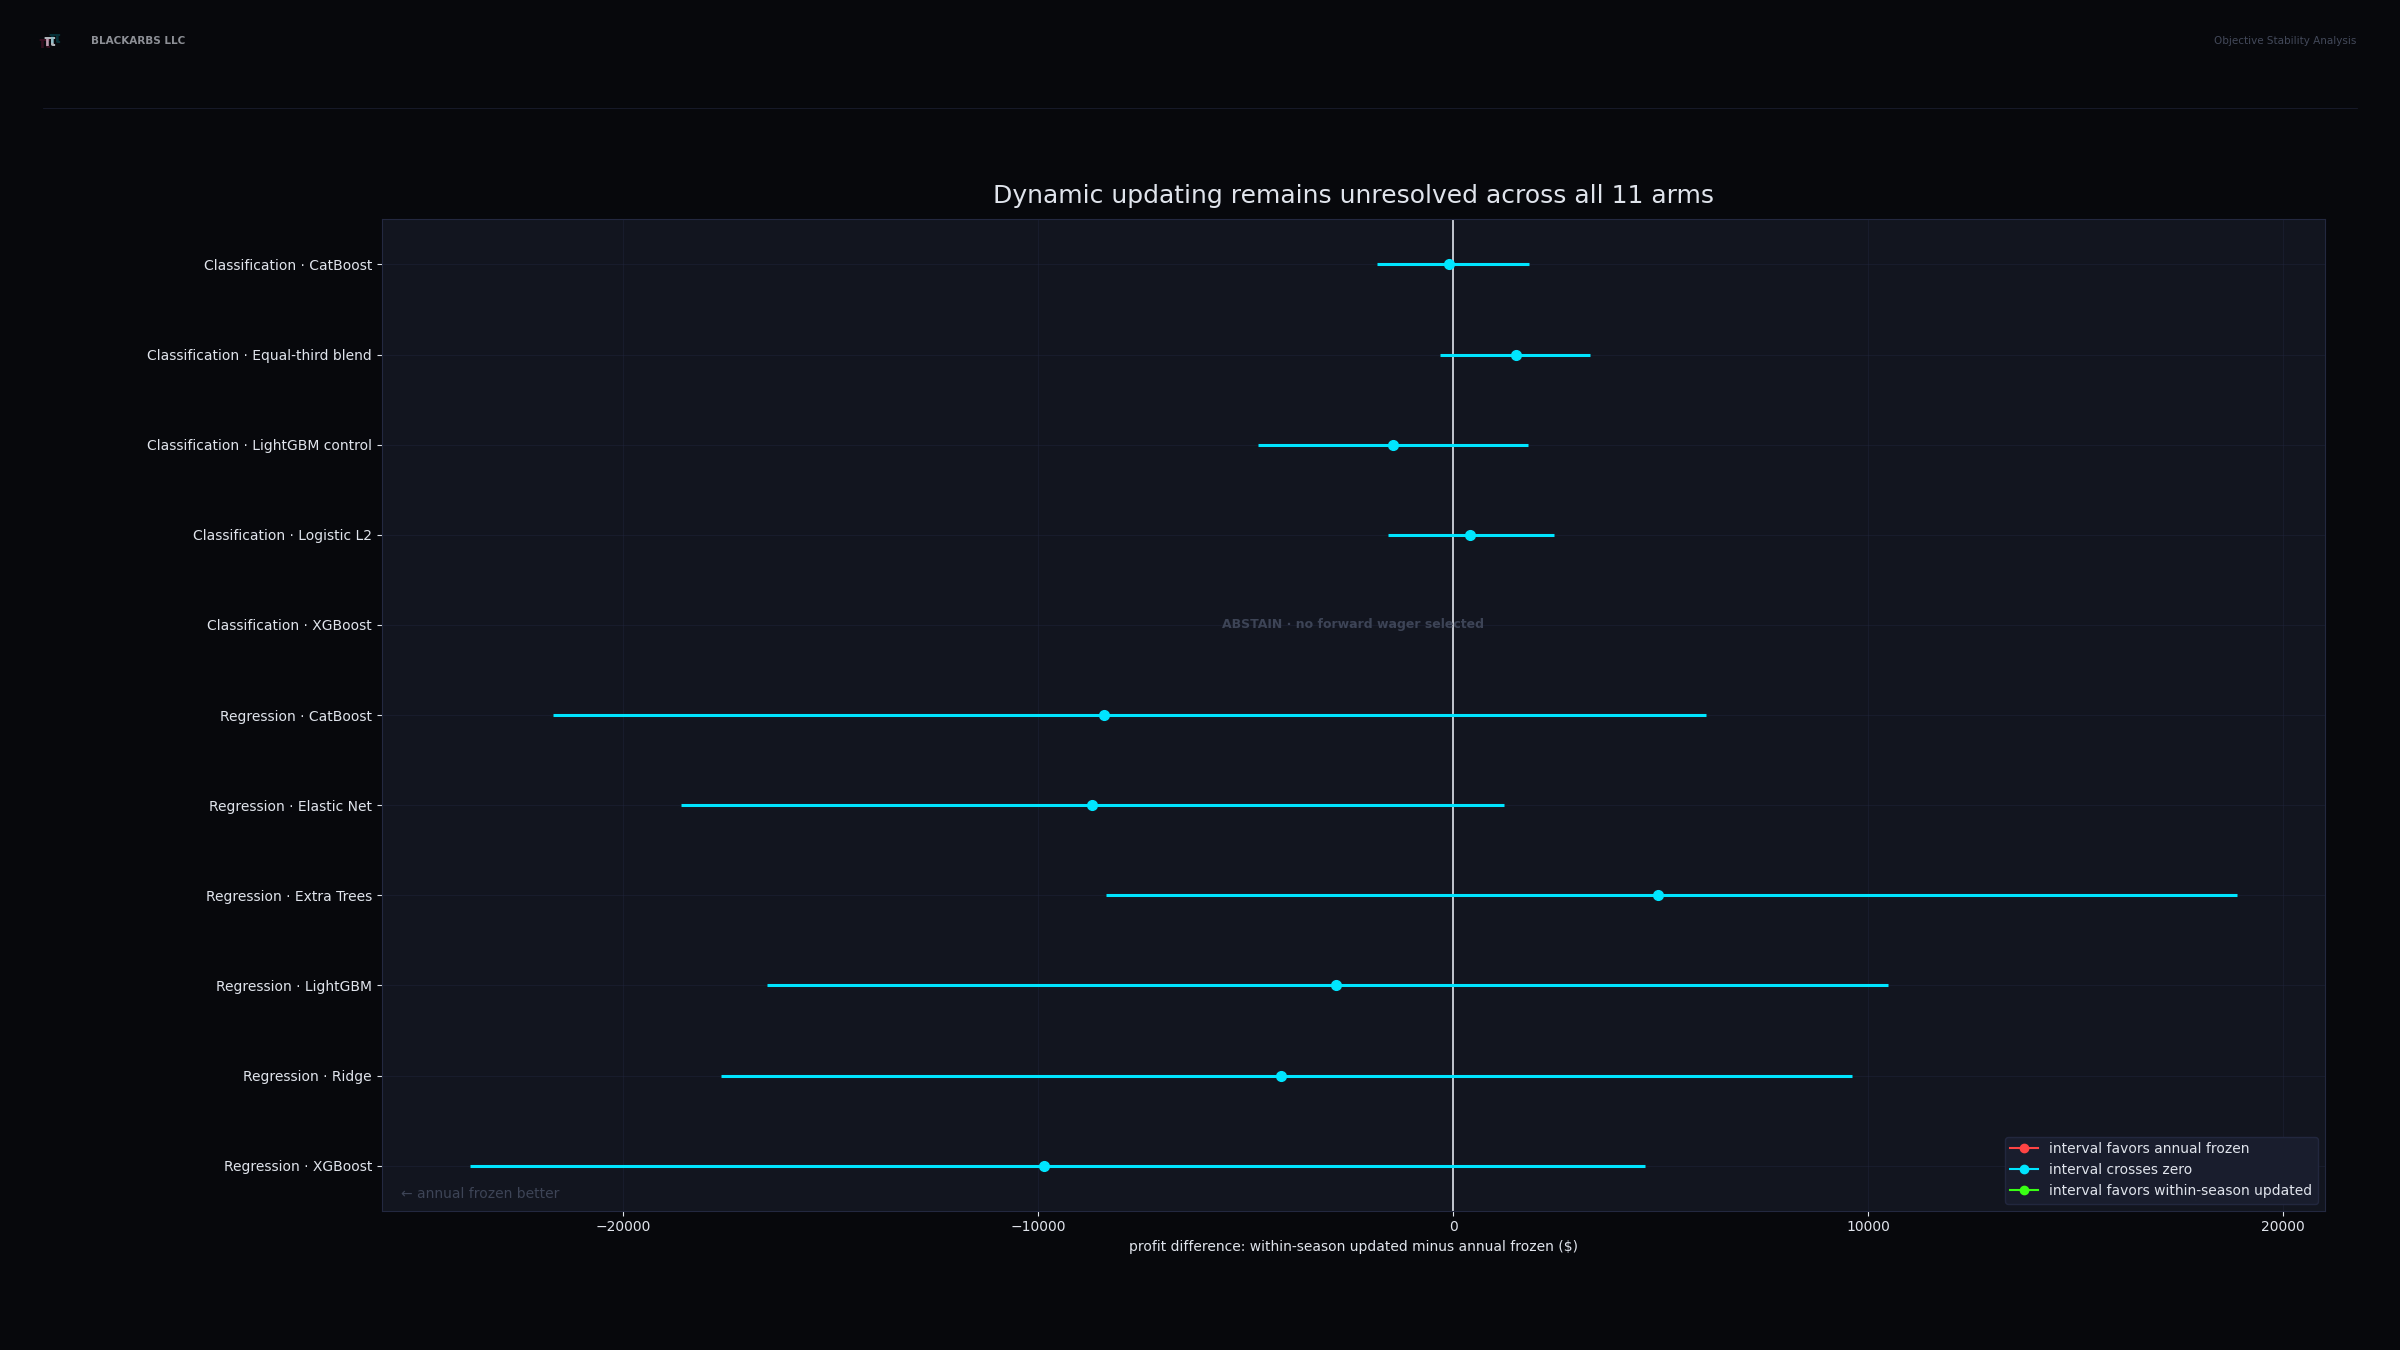
Dynamic-policy within-season minus annual-frozen profit estimates with 95 percent block-bootstrap intervals

No dynamic interval separated reliably from zero. The missing XGBoost classifier treatment is preserved as abstention, not fabricated economics.

2,000 draws per arm
Historical experiment · contextual evidence

Annual frozen won five fixed arms; five remained unresolved
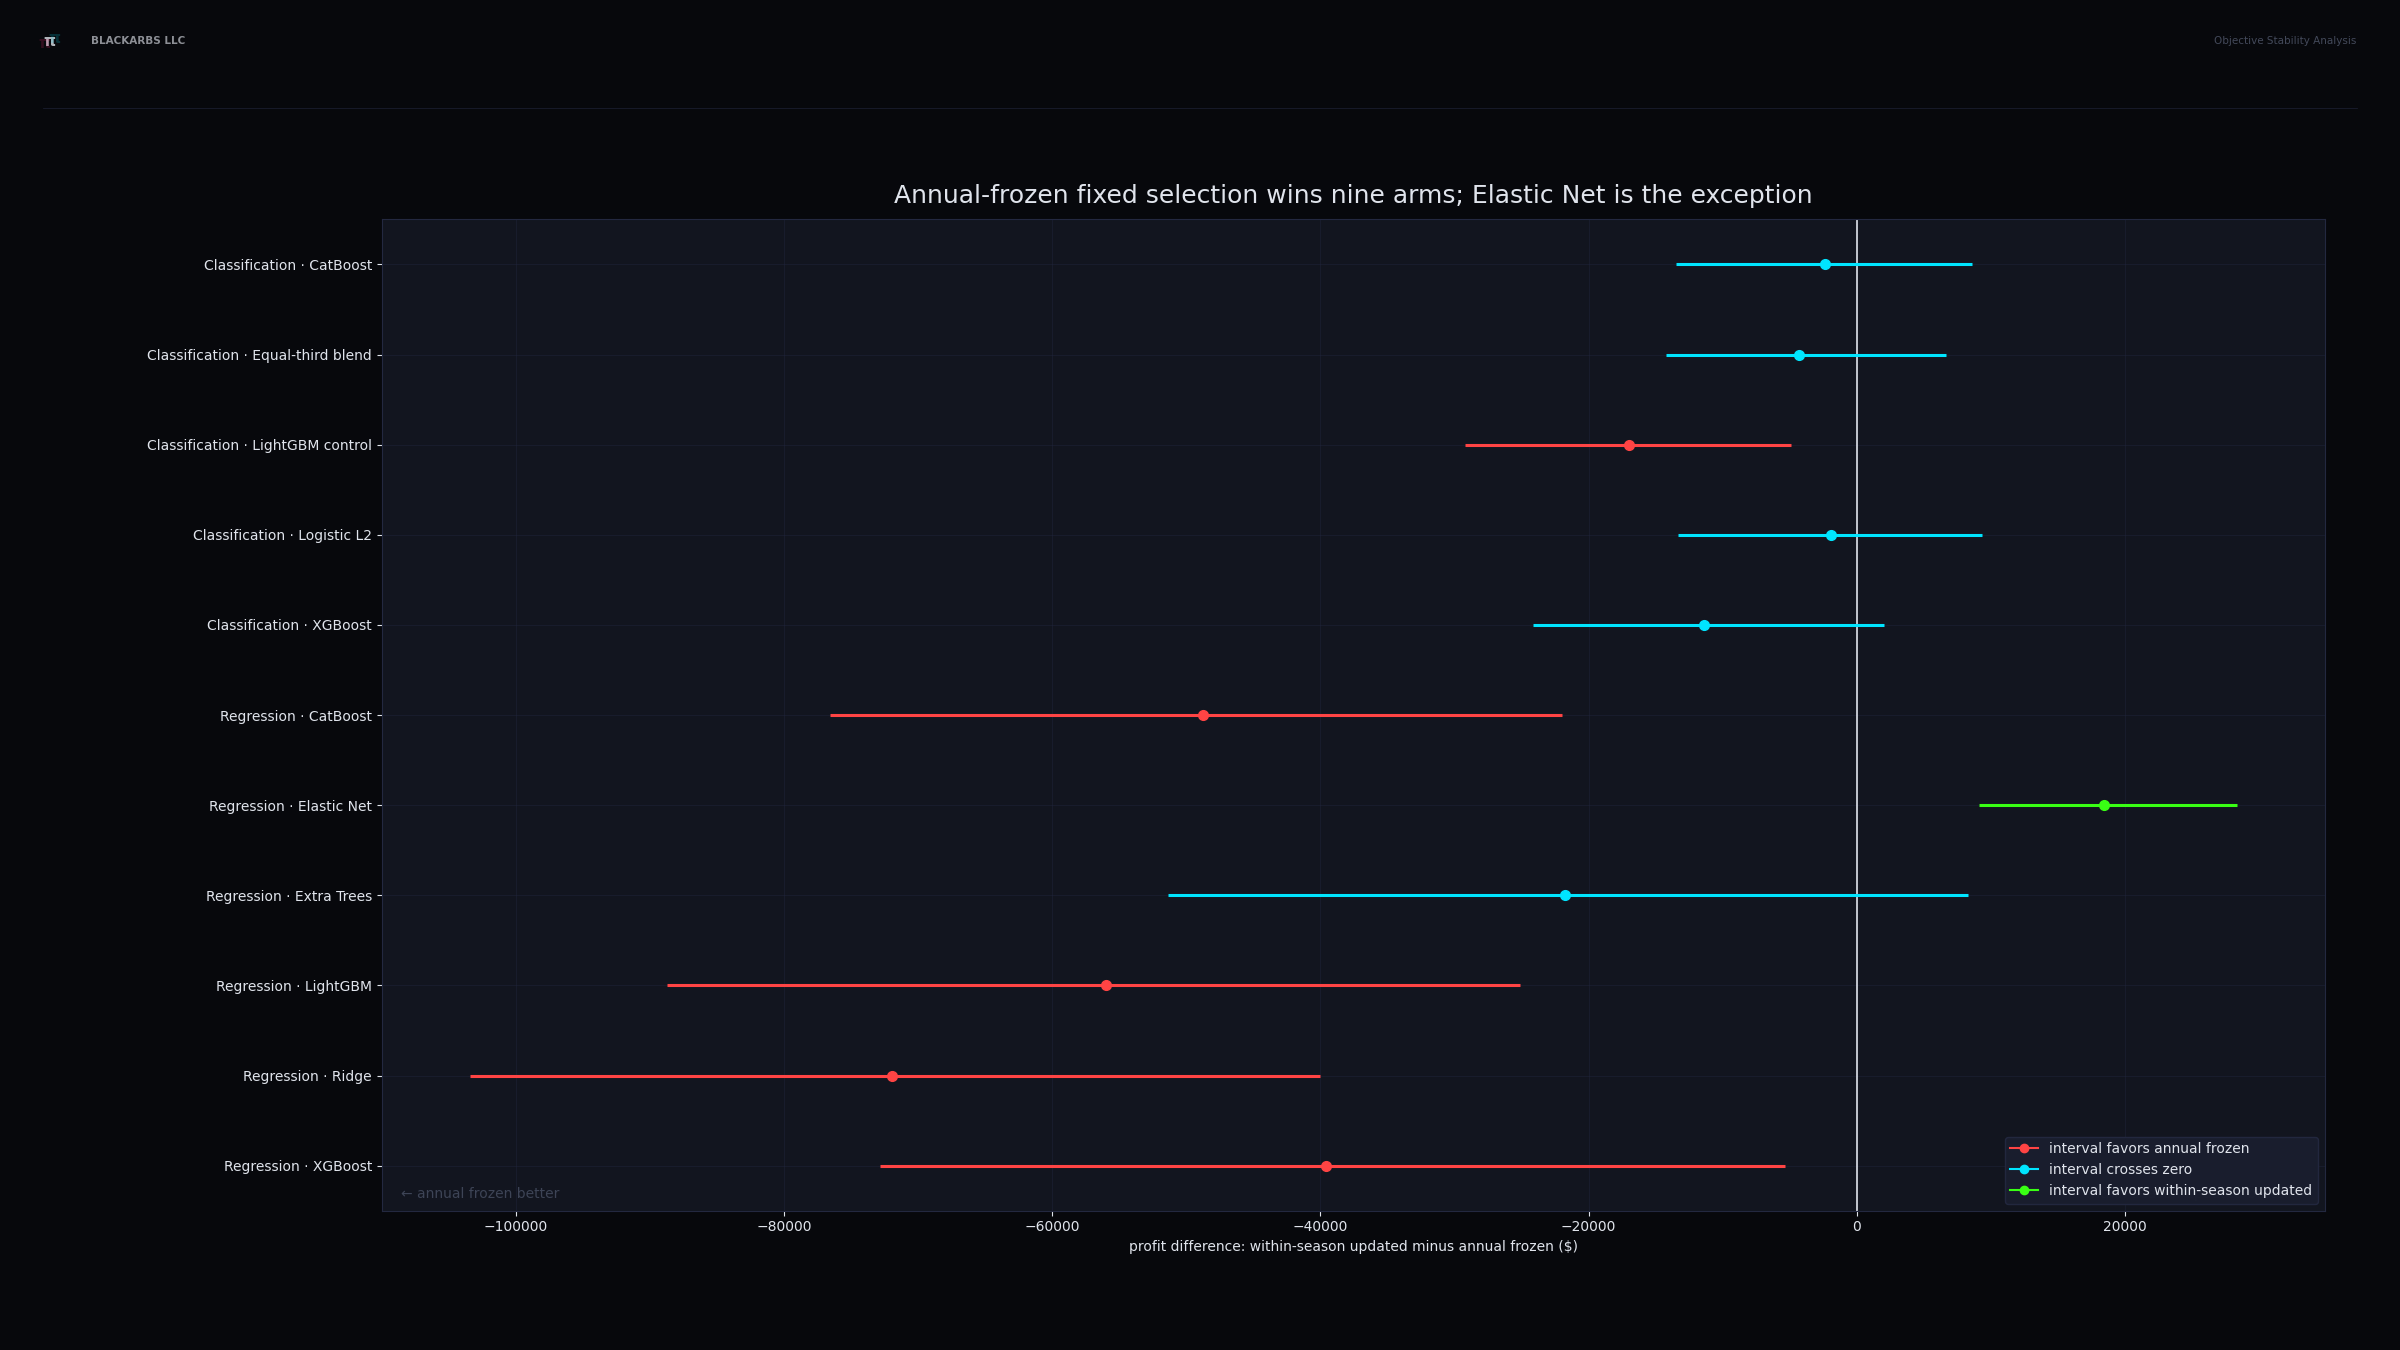
Fixed-policy within-season minus annual-frozen profit estimates with 95 percent block-bootstrap intervals

Five fixed comparisons favored annual frozen, five crossed zero, and one favored updating. The lone updated winner does not offset broad updated-only losses.

2,000 draws per arm
Historical experiment · contextual evidence

Confirm classifiers once. Close the recycled searches.

Tier 1 · Direct decision tests

  • Confirm annual-frozen LightGBM control and XGBoost moneyline.
  • Audit whether both classifiers win through the same wagers.
  • Freeze one abstention rule for within-season churn.

Tier 2 · Conditional research

  • Confirm the time-concentrated LightGBM totals pocket untouched.
  • Add genuinely new timestamped information only after classifier confirmation.
  • Use market-relative proper scores before economic promotion.

Tier 3 · Close

  • No new six-family regression sweep.
  • No broad remix of the existing 156 features.
  • No post-hoc weekly selector threshold rescue.

Positive point estimates earned a confirmation experiment. They did not earn capital.

Capital-aware sequencing
Historical experiment · contextual evidence

Four ideas that must not be confused

Prediction accuracy

How closely a model's probabilities or point forecasts match outcomes.

Expected return

What the model thinks a wager should earn at the offered price.

Realized return

What the selected wagers actually earned after games settled.

Incremental information

Whether the model knows something useful that the sportsbook price did not already contain.

A model can predict better, look profitable historically, or improve a losing baseline without producing a profitable wager at an available price.

Core distinction
Historical experiment · contextual evidence

Each experiment closed one escape hatch

1–2 · Classifiers

  • Compared five model arms with market no-vig.
  • Tested calibration and disagreement.

3–4 · Ranking

  • Asked whether high-ranked wagers paid.
  • Screened six regression families.

5–7 · Portfolios

  • Proved wager identity and routing.
  • Ran family-owned dynamic portfolios.

8 + follow-up · Residual

  • Anchored to FanDuel no-vig.
  • Expanded from 10 to 156 inputs and audited starter timing.

The conclusion did not come from one failed backtest. It emerged after prediction, ranking, routing, and economics were tested separately.

Research map
Historical experiment · contextual evidence

Reproducible does not automatically mean profitable

Verifier-owned

  • Candidate-routing accounting.
  • Regression-family screening mechanics.
  • Final market-residual package.
  • Strong authority for identity, lineage, determinism, and reproducibility.

Validated research

  • Calibration and disagreement.
  • Price-relative ranking.
  • Dynamic portfolio comparisons.
  • Suitable research evidence, not a deployed strategy claim.

Hypothesis-generating

  • Searched thresholds.
  • Recent totals pockets.
  • Sparse positive wager cells.
  • None is treated as confirmed edge.

Verification proves that we can trust what was measured. It cannot turn a negative result into a positive strategy.

Evidence hierarchy
Historical experiment · contextual evidence

Most portfolios returned roughly the sportsbook's advantage

ExperimentRealized ROI
Fixed classifier replays-2.99% to -12.01%
Dynamic regression families-4.99% to -6.47%
Dynamic classification families-3.44% to -6.49%
Residual fixed portfolio-4.35%
Residual dynamic portfolio-7.94%

The models often rearranged the losses without adding enough information to overcome the price.

Repeated returns near or below the sportsbook hold point toward a missing-information or price-translation problem, not one uniquely bad model.

Cross-experiment pattern
BlackArbs LLC · Supporting research context
II
Historical experiment · contextual evidence

Earlier tests: better predictions still lost money.

Prediction tests explain the losses, but settled betting returns determine the decision.

Historical experiment · contextual evidence

Market no-vig beat every learned classifier with uncertainty included
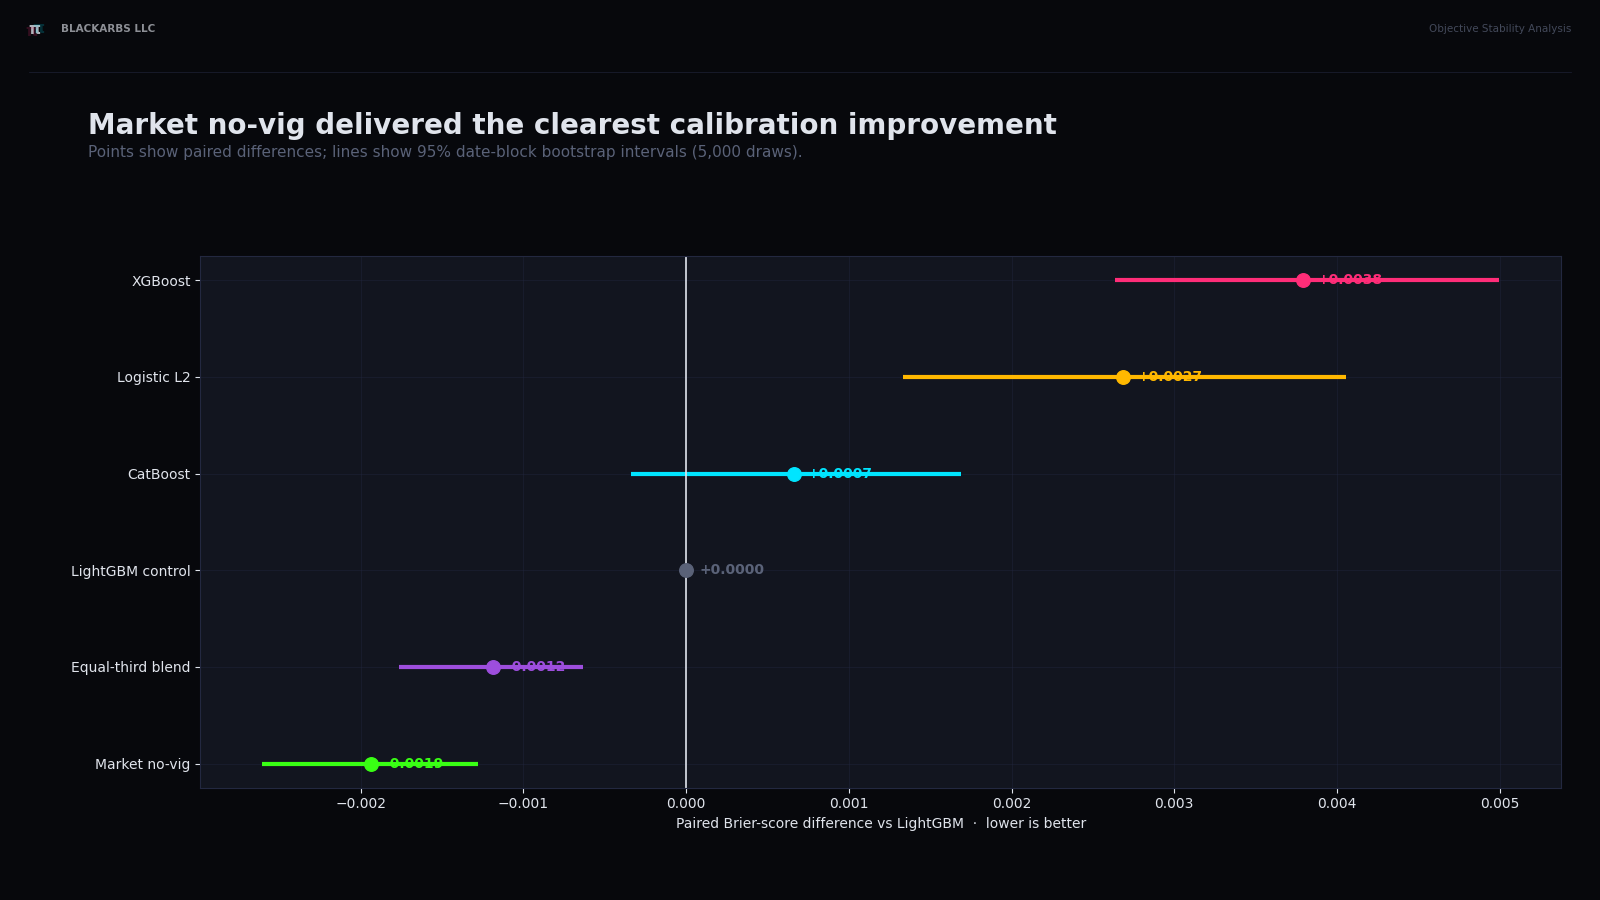
Paired Brier-score differences versus the LightGBM control

Lower is better. The market and blend improved on LightGBM; XGBoost and logistic were worse. Market no-vig was strongest.

Fixed-classifier evidence
Historical experiment · contextual evidence

Disagreement helped us avoid some losses. It did not create profit.

+1.12 pts
LightGBM moneyline ROI improvement after rejecting the highest model-market disagreements.
14,909
Retained wagers, 69.9% of baseline. The paired date-block interval was approximately +0.06 to +2.22 points.
-3.72%
Later absolute ROI. The filter improved a losing baseline without becoming profitable. Keeping only high-disagreement wagers was worse by 2.60 points.

Model-market disagreement is useful as an abstention or risk signal, not as proof of a positive edge score.

Experiment 2
Historical experiment · contextual evidence

Expected returns overstated most cells; LightGBM totals was the exception
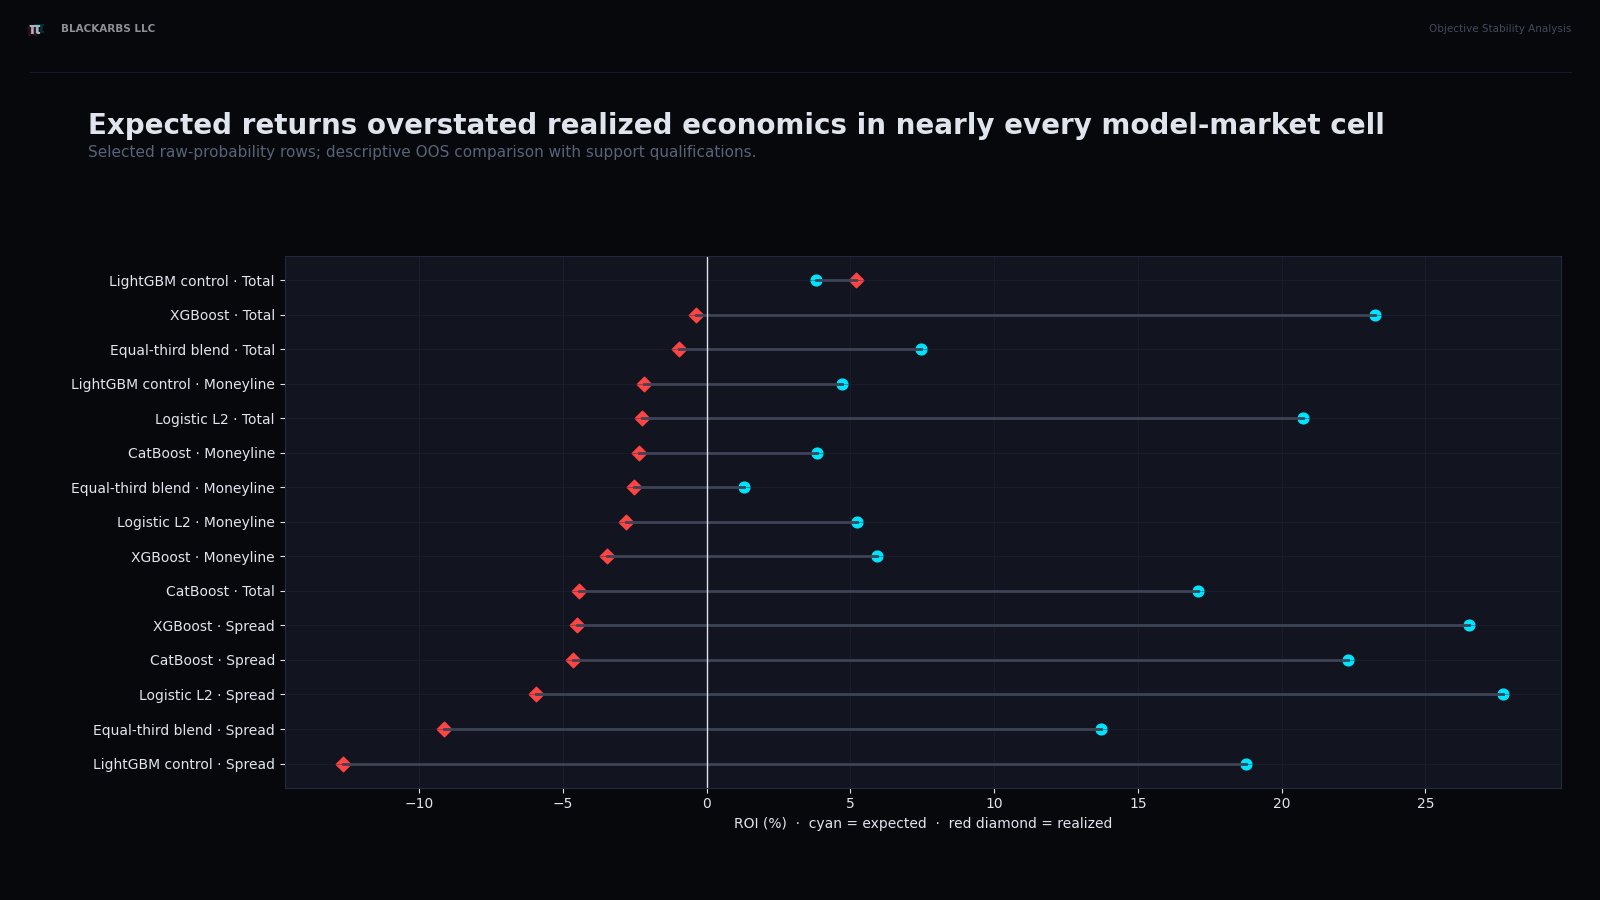
Expected-versus-realized ROI gaps across selected calibrated model-market cells

Selected LightGBM totals realized +5.19% ROI versus +3.79% expected across 5,068 rows. But 5,024 rows came from 2025 and only 44 from 2024, making this a temporally concentrated confirmation candidate—not broad edge proof.

Totals follow-up
Historical experiment · contextual evidence

Rejecting extreme disagreement helped; following it did not
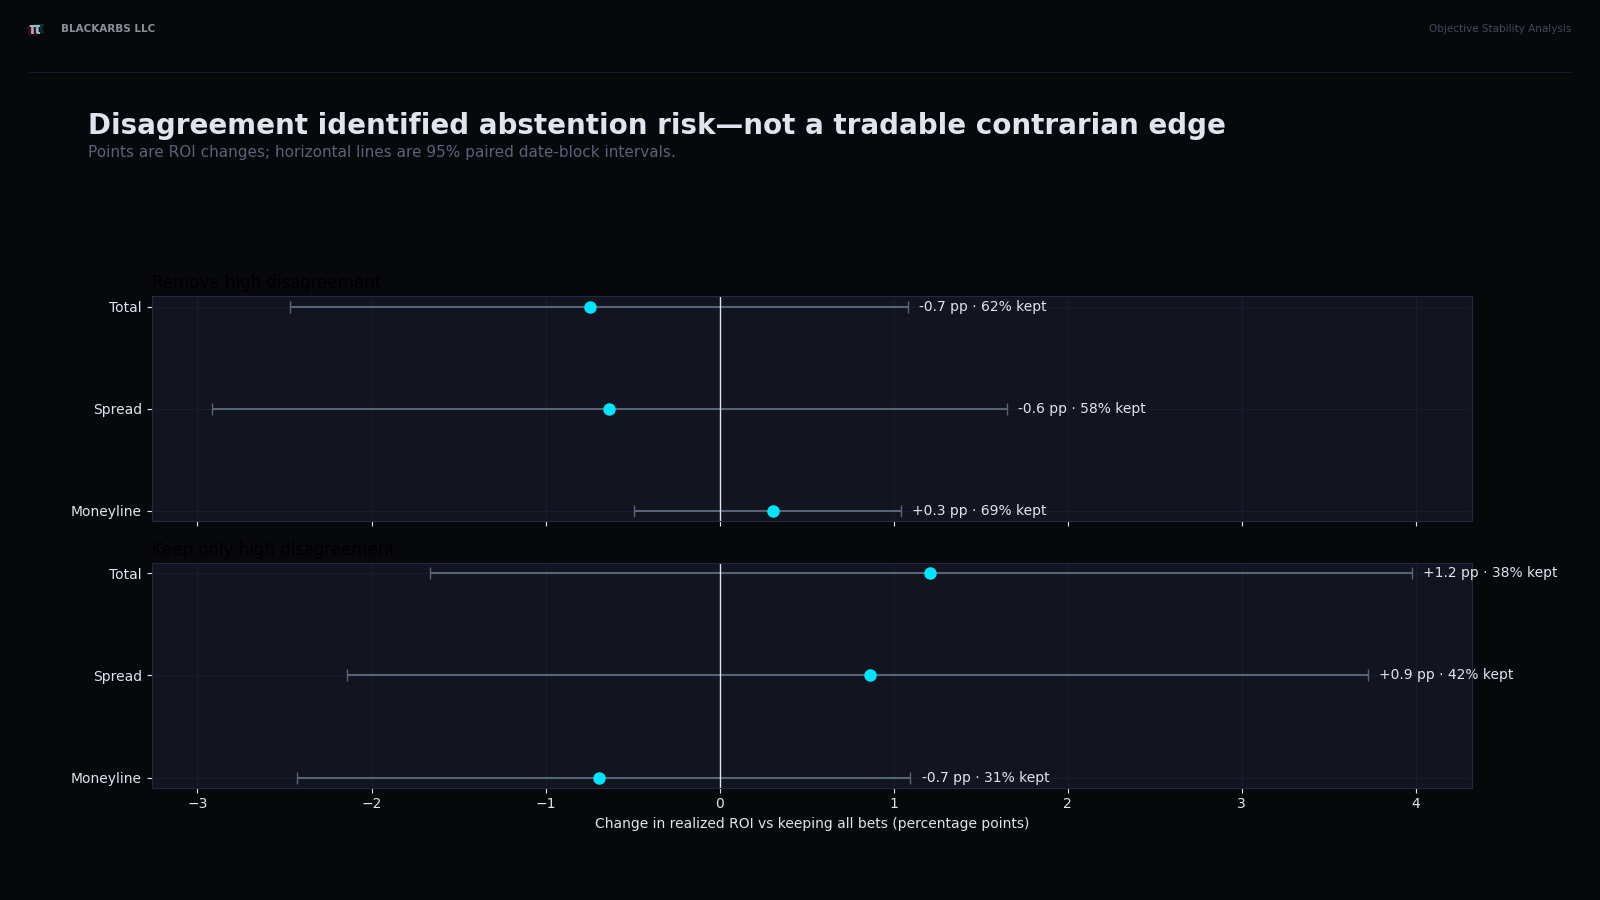
Profitability response when retaining or rejecting model-market disagreement groups

The chart supports an abstention interpretation: disagreement identified riskier areas, not a profitable contrarian signal.

Prior chart package
Historical experiment · contextual evidence

The “best” candidates were still losing candidates

CandidateBetsROIMax drawdown
Equal-third blend totals16,890-4.59%$77,777
LightGBM ML disagreement rejection12,604-3.72%$47,016

Both failed concentration, uncertainty, and false-discovery controls.

Relative lift is not profit

Raw XGBoost moneyline top ranks improved by about 2.70 percentage points relative to their population. Top-rank ROI was still -1.21%.

Rank quality must clear an executable zero-return boundary, not merely beat a worse negative baseline.

Experiment 3
Historical experiment · contextual evidence

Neither formal candidate cleared the advancement gates
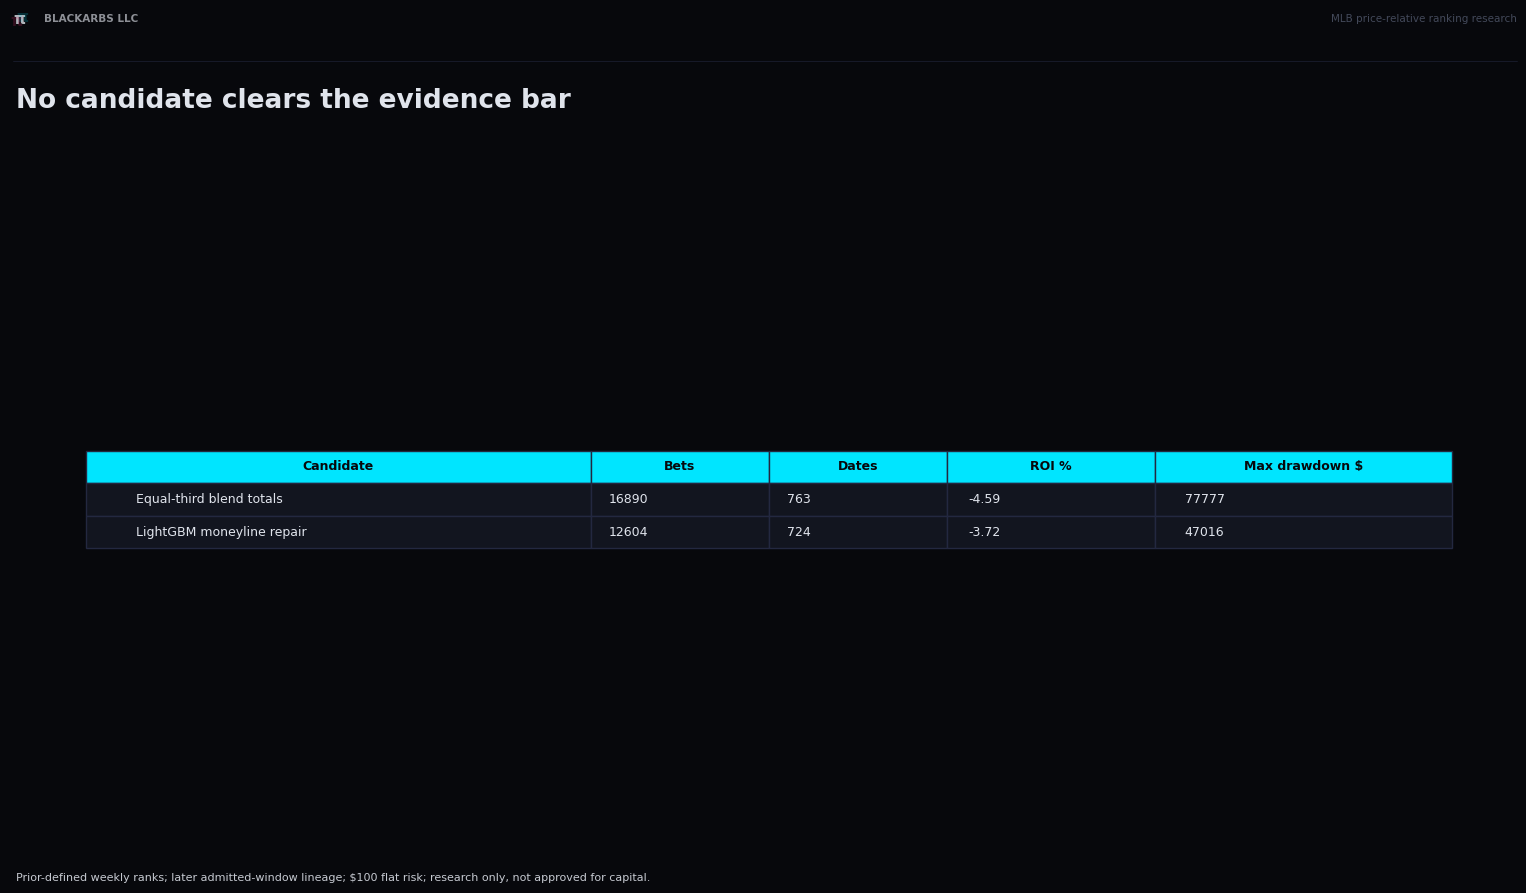
Executive scorecard for the two price-relative ranking candidates

The scorecard joins profitability, drawdown, uncertainty, concentration, and advancement status in one decision view.

Prior chart package
BlackArbs LLC · Supporting research context
III
Historical experiment · contextual evidence

Regression models chose different bets.
They still lost.

The models made different choices, so identical bets do not explain the shared losses.

Historical experiment · contextual evidence

Elastic Net predicted scores best. That did not make its wagers profitable.

FamilySpread MAE ↓Total MAE ↓
Elastic Net3.4823.524
CatBoost3.4903.667
Extra Trees3.4953.776
LightGBM3.5583.723
XGBoost3.5943.839
Ridge4.8774.525

Why the translation matters

Mean absolute error measures the average miss in predicted score margin or game total. A wager needs something different: the probability of finishing above, below, or exactly on the offered line.

A better average score forecast does not automatically provide a calibrated probability at a sportsbook's line.

Experiment 4
Historical experiment · contextual evidence

Elastic Net also led expected total-run prediction
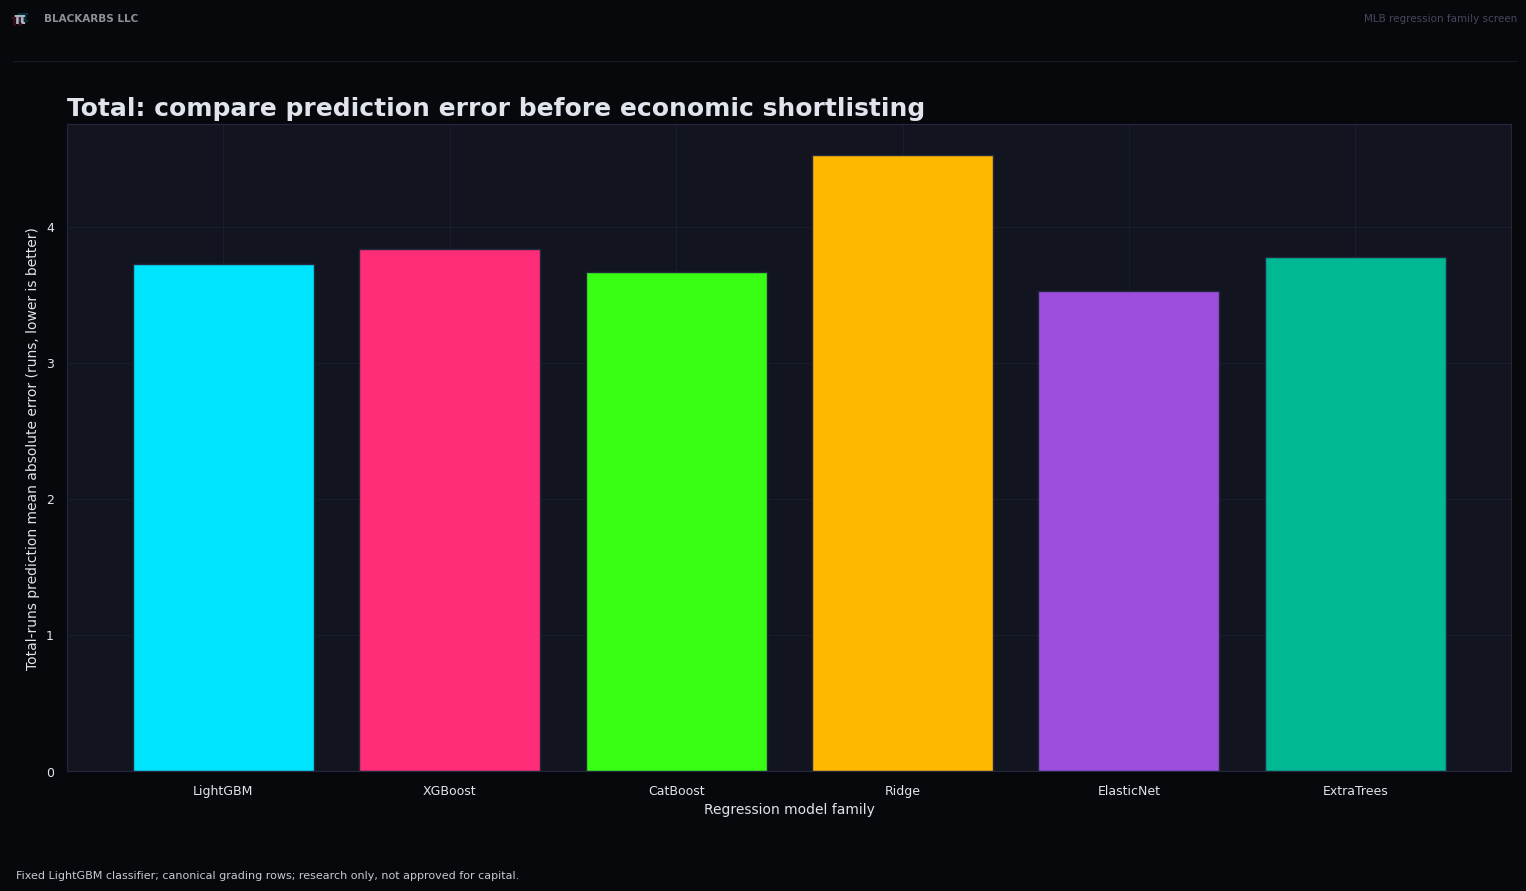
Out-of-sample total predictive error across six regression families

The next totals experiment should add a score distribution around that mean so it can estimate over, under, and push probabilities.

Prior chart package
Historical experiment · contextual evidence

Millions of model decisions collapsed into 55,468 real economic wagers

12.01M
Applicable routing decisions.
648,096
Emitted component memberships.
11.36M
Deterministic rejections.
55,468
Unique economic wagers, with no multiplied stake or duplicate authorization.

A model membership is not a separate wager or capital exposure. This verifier-owned control makes the later portfolio comparisons credible.

Experiment 5
Historical experiment · contextual evidence

Every family lost in moneyline, spread, and total markets
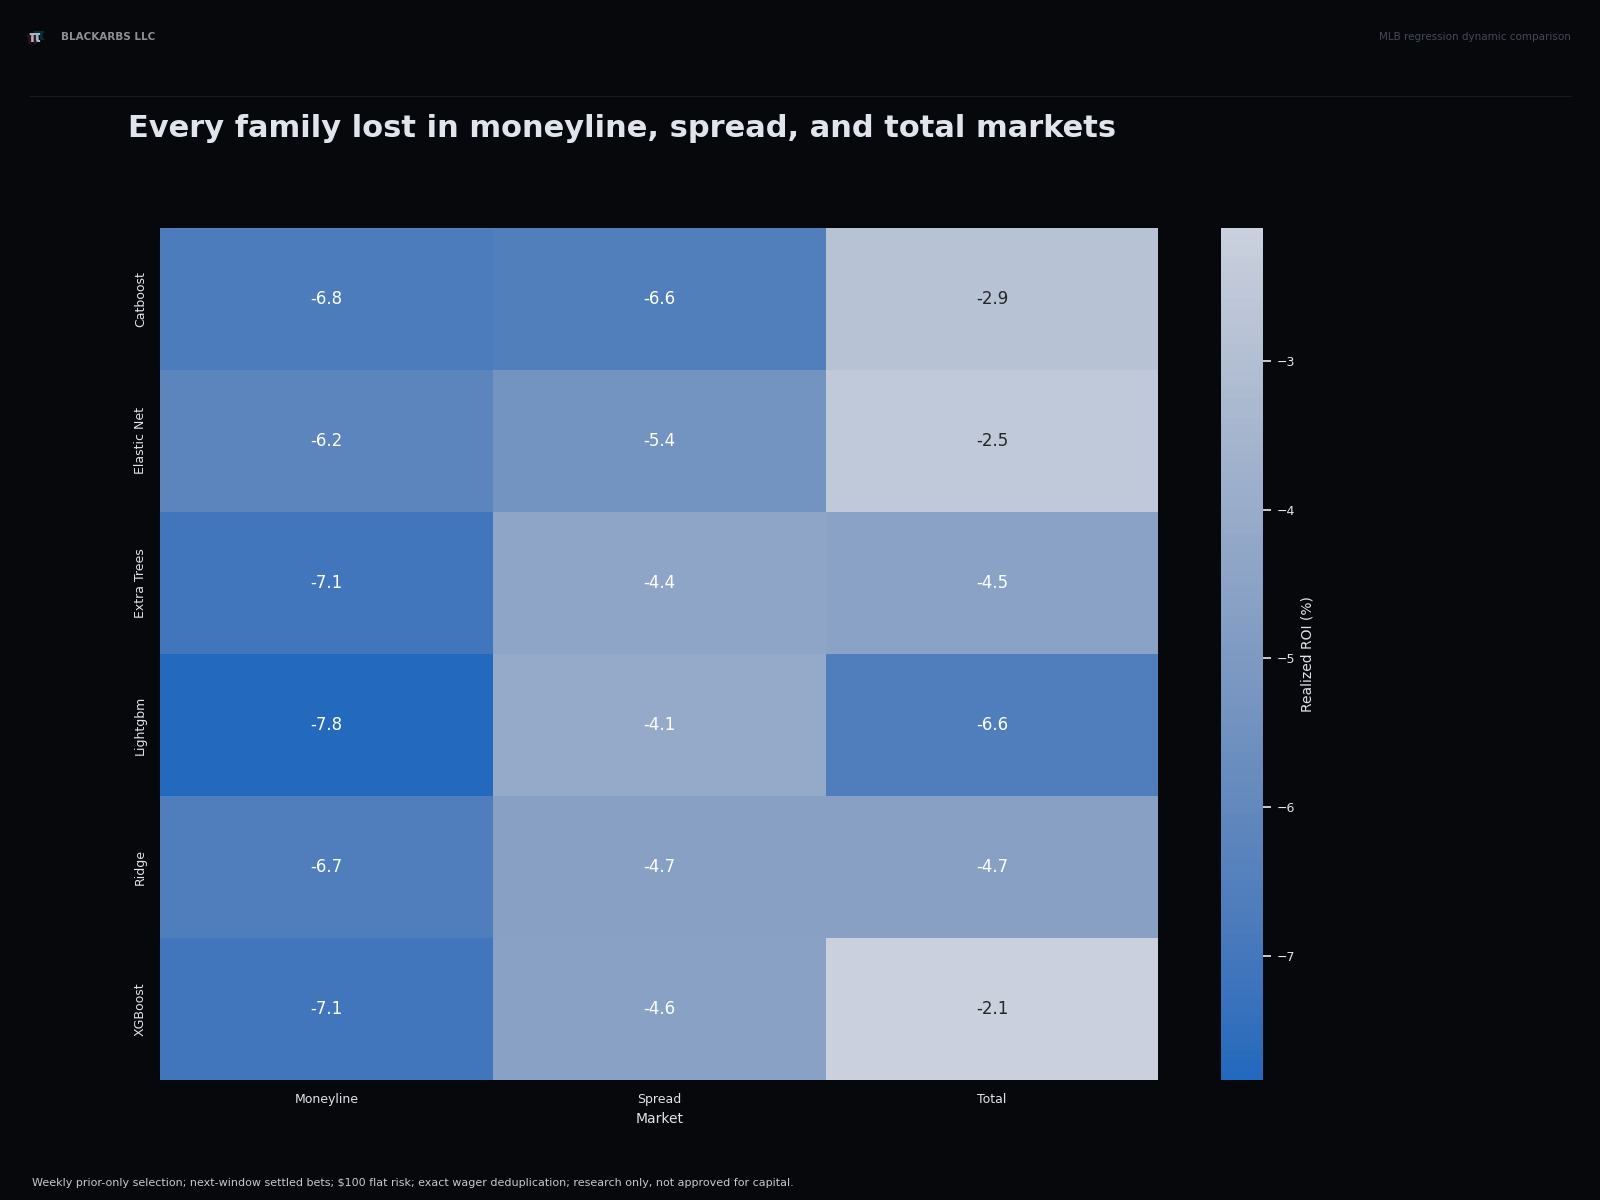
Market ROI comparison across six dynamic regression families

Totals were least negative for several families and motivate a narrow distributional pilot, but no full-period market aggregate was profitable.

Prior chart package
Historical experiment · contextual evidence

Moderate overlap proves the portfolios were materially different
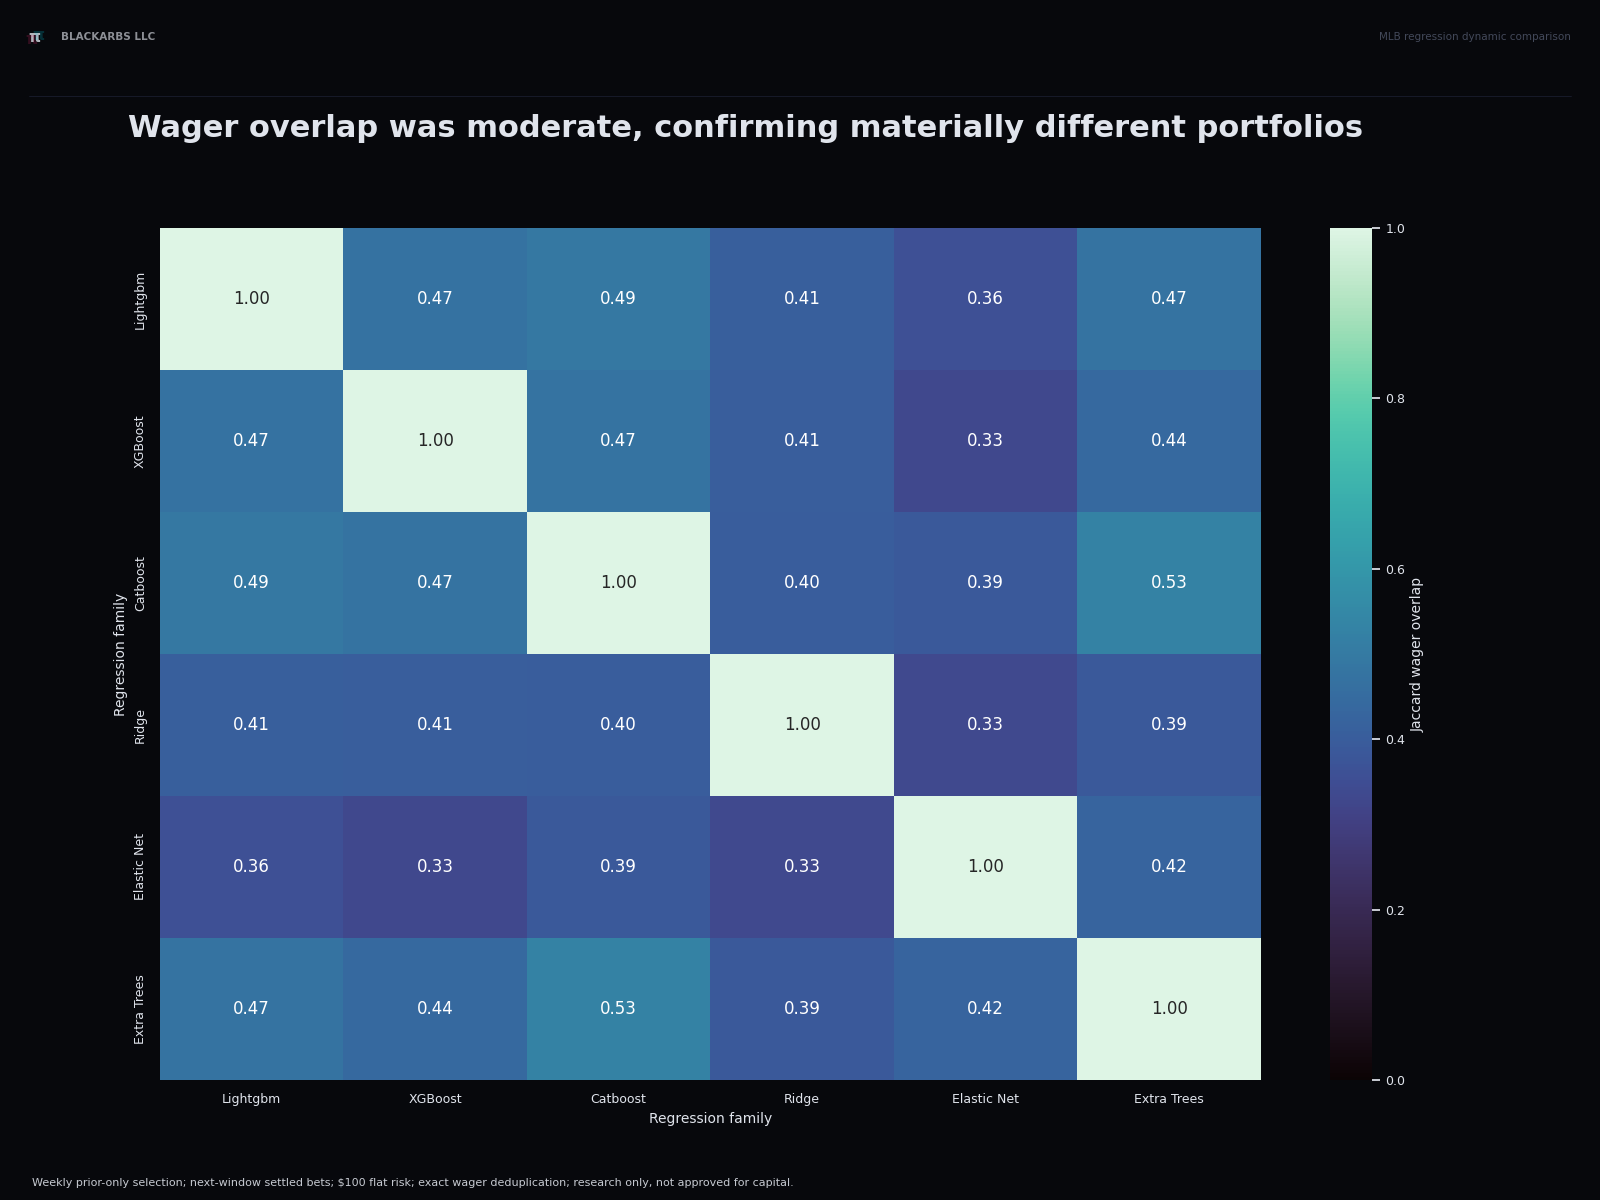
Pairwise wager overlap across six dynamic regression portfolios

The earlier common-universe package could not establish independent selection. This later overlap chart removes that confound.

Prior chart package
Historical experiment · contextual evidence

Simpler classifiers lost less. None won.

ArmProfitROIPositive seasons
Logistic L2-$21,126-3.44%0 / 4
Equal-third blend-$22,030-3.70%0 / 4
CatBoost-$36,548-5.95%0 / 4
LightGBM-$41,412-6.47%0 / 4
XGBoost-$40,378-6.49%0 / 4

What failed

  • All 20 arm-season cells were negative.
  • All 15 arm-market cells were negative.
  • Weekly historical-winner selection did not rescue any family.

Added nonlinear capacity did not solve the missing-information or selection problem.

Experiment 7
Historical experiment · contextual evidence

Historical winners did not remain winners in the next window
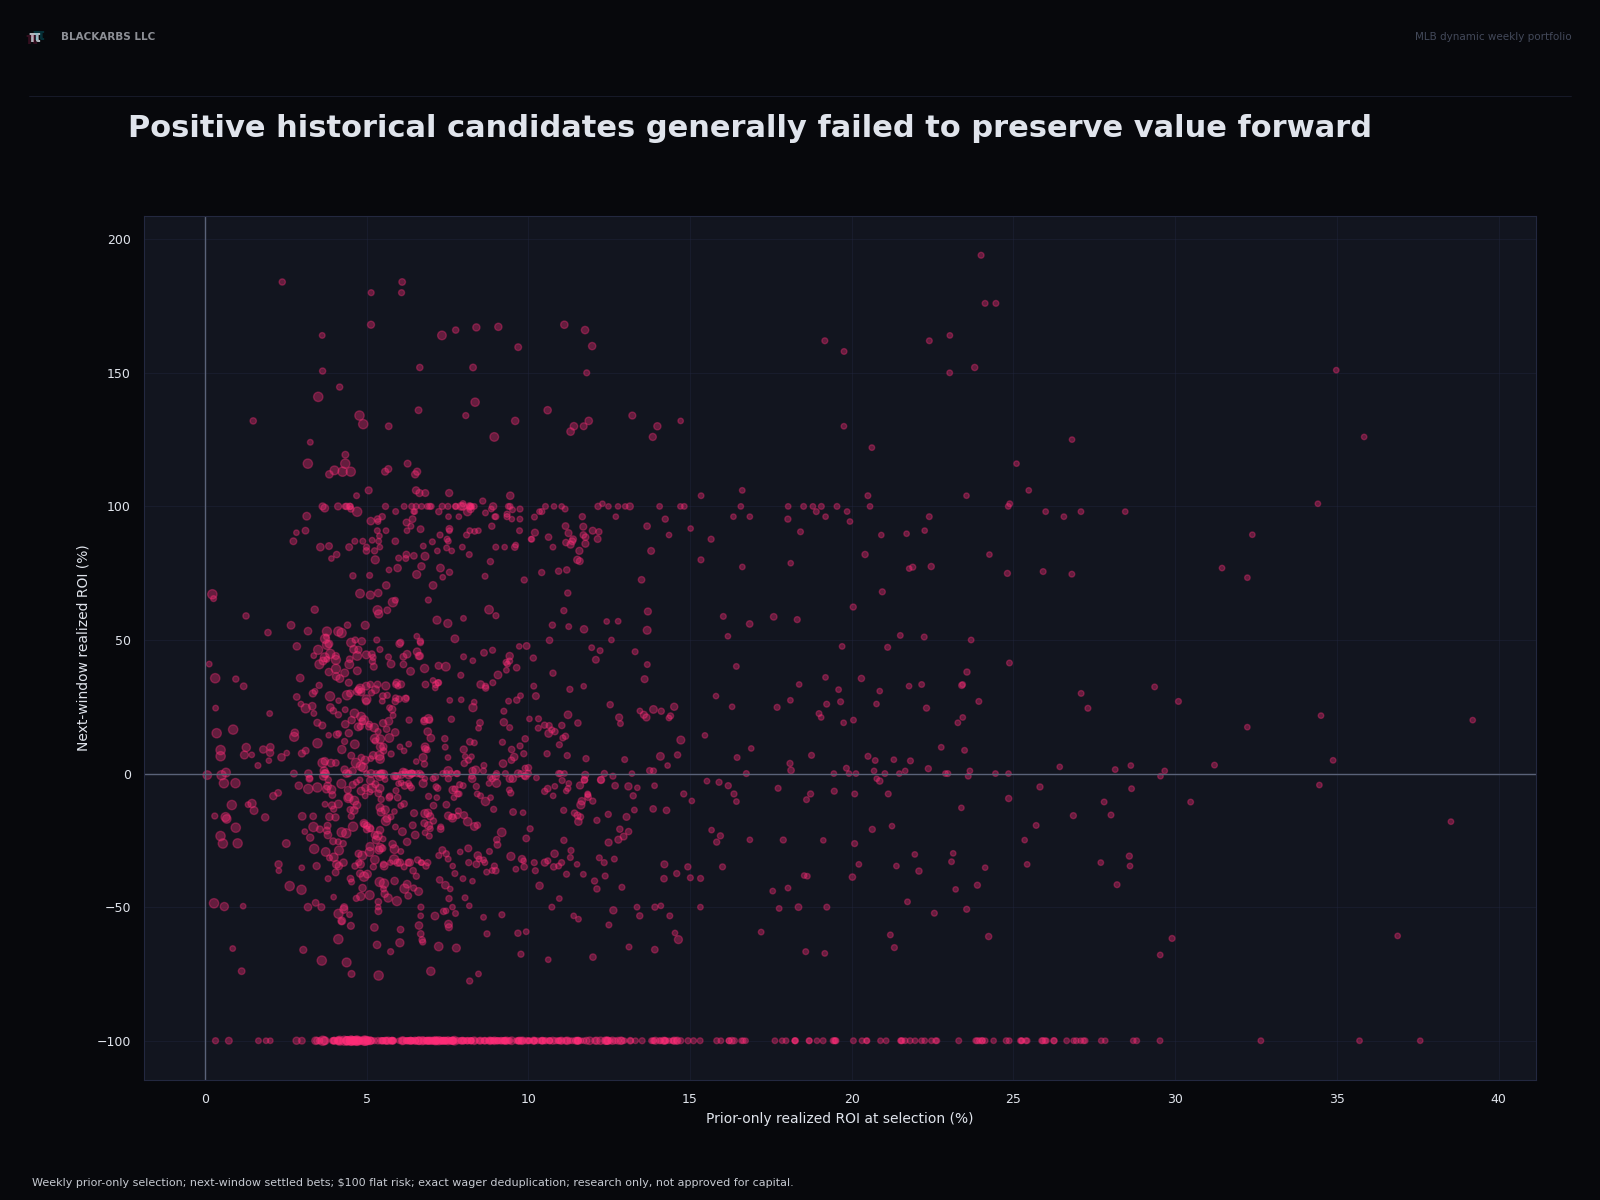
Logistic dynamic portfolio selection-audit ROI versus forward ROI

The mechanism repeats the fixed-classifier lesson: choosing components by attractive historical ROI did not survive forward settlement.

Prior chart package
BlackArbs LLC · Supporting research context
IV
Historical experiment · contextual evidence

Did baseball data improve on the sportsbook's price?

These tests asked whether baseball data improved the sportsbook's probability estimate.

Historical experiment · contextual evidence

The market made the first prediction. Models could only correct it.

1 · Market anchor

Remove the sportsbook margin from both sides, then convert the market probability to log-odds.

2 · Baseball-only correction

Ridge, Elastic Net, LightGBM, XGBoost, CatBoost, and GAM received baseball features but no market-derived features.

3 · Corrected probability

Add the learned correction to market log-odds and convert back to probability.

This was not a model-versus-market contest. It was a direct test of whether the current baseball features added information beyond the market.

Experiment design
Historical experiment · contextual evidence

Four folds came from four out-of-sample seasons: 2022, 2023, 2024, and 2025

Test 2022

Train on 1,072 eligible paired 2021 moneyline rows. The latest 20% chooses settings; then a fresh model refits all 2021 rows.

Test 2023

Train on all eligible information through 2022, select chronologically, refit, then predict 2023.

Test 2024

Expand training through 2023, repeat selection and fresh full-fold refit.

Test 2025

Expand training through 2024, then predict the untouched 2025 fold.

There are four folds because there are four evaluation seasons. The 2021 rows train the mandatory 2022 fold and are never called out-of-sample.

No lookahead
Historical experiment · contextual evidence

Zero of six families proved lower log loss than the market
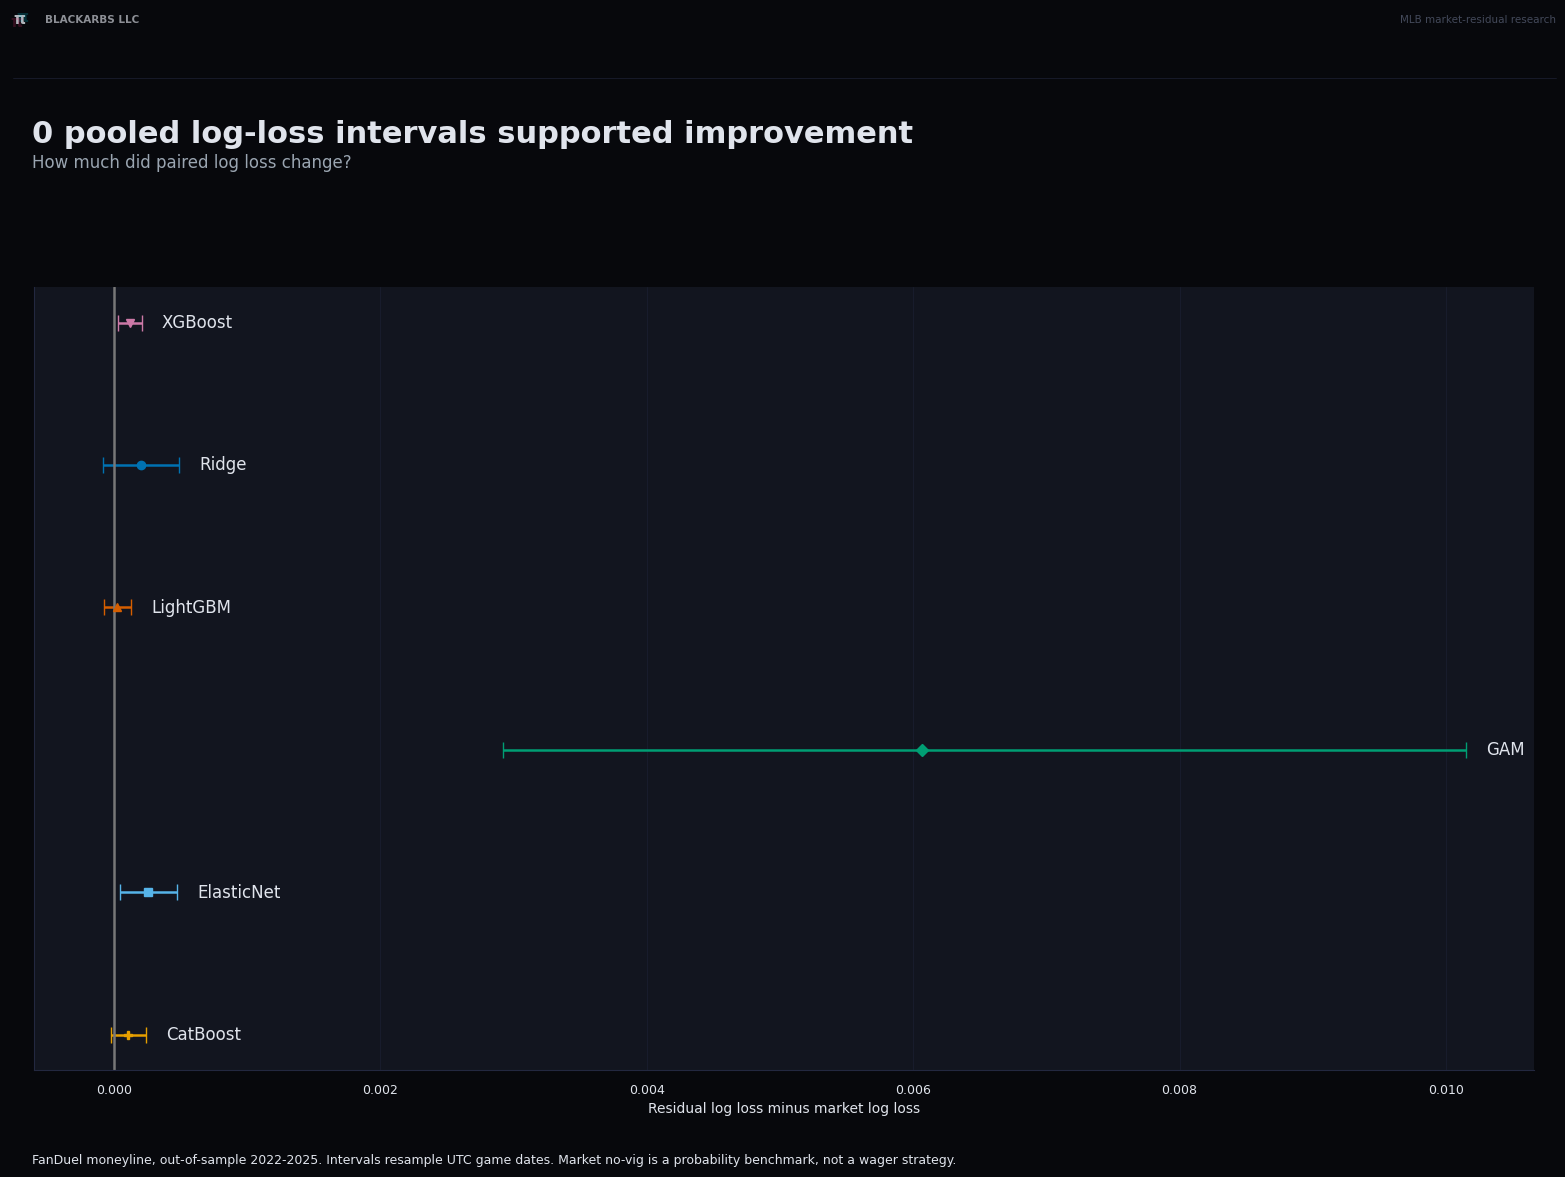
Paired residual-minus-market log-loss deltas with confidence intervals

Lower than zero would mean improvement. All point estimates were above zero; XGBoost, Elastic Net, and GAM were reliably worse.

Chart 2 · primary endpoint
Historical experiment · contextual evidence

LightGBM was closest to the market. GAM was materially worse.

FamilyResidual minus market log loss95% intervalMeaning
LightGBM+0.000024[-0.000075, +0.000128]Indistinguishable; worse point
CatBoost+0.000107[-0.000026, +0.000243]Indistinguishable; worse point
XGBoost+0.000116[+0.000027, +0.000210]Reliably worse
Ridge+0.000203[-0.000086, +0.000487]Indistinguishable; worse point
Elastic Net+0.000256[+0.000042, +0.000476]Reliably worse
GAM+0.006066[+0.002919, +0.010152]Materially worse

“Indistinguishable” does not mean tied or helpful. It means the experiment could not separate the correction from the market, and its point estimate was still worse.

Paired uncertainty
Historical experiment · contextual evidence

Higher model confidence did not reliably rescue realized economics
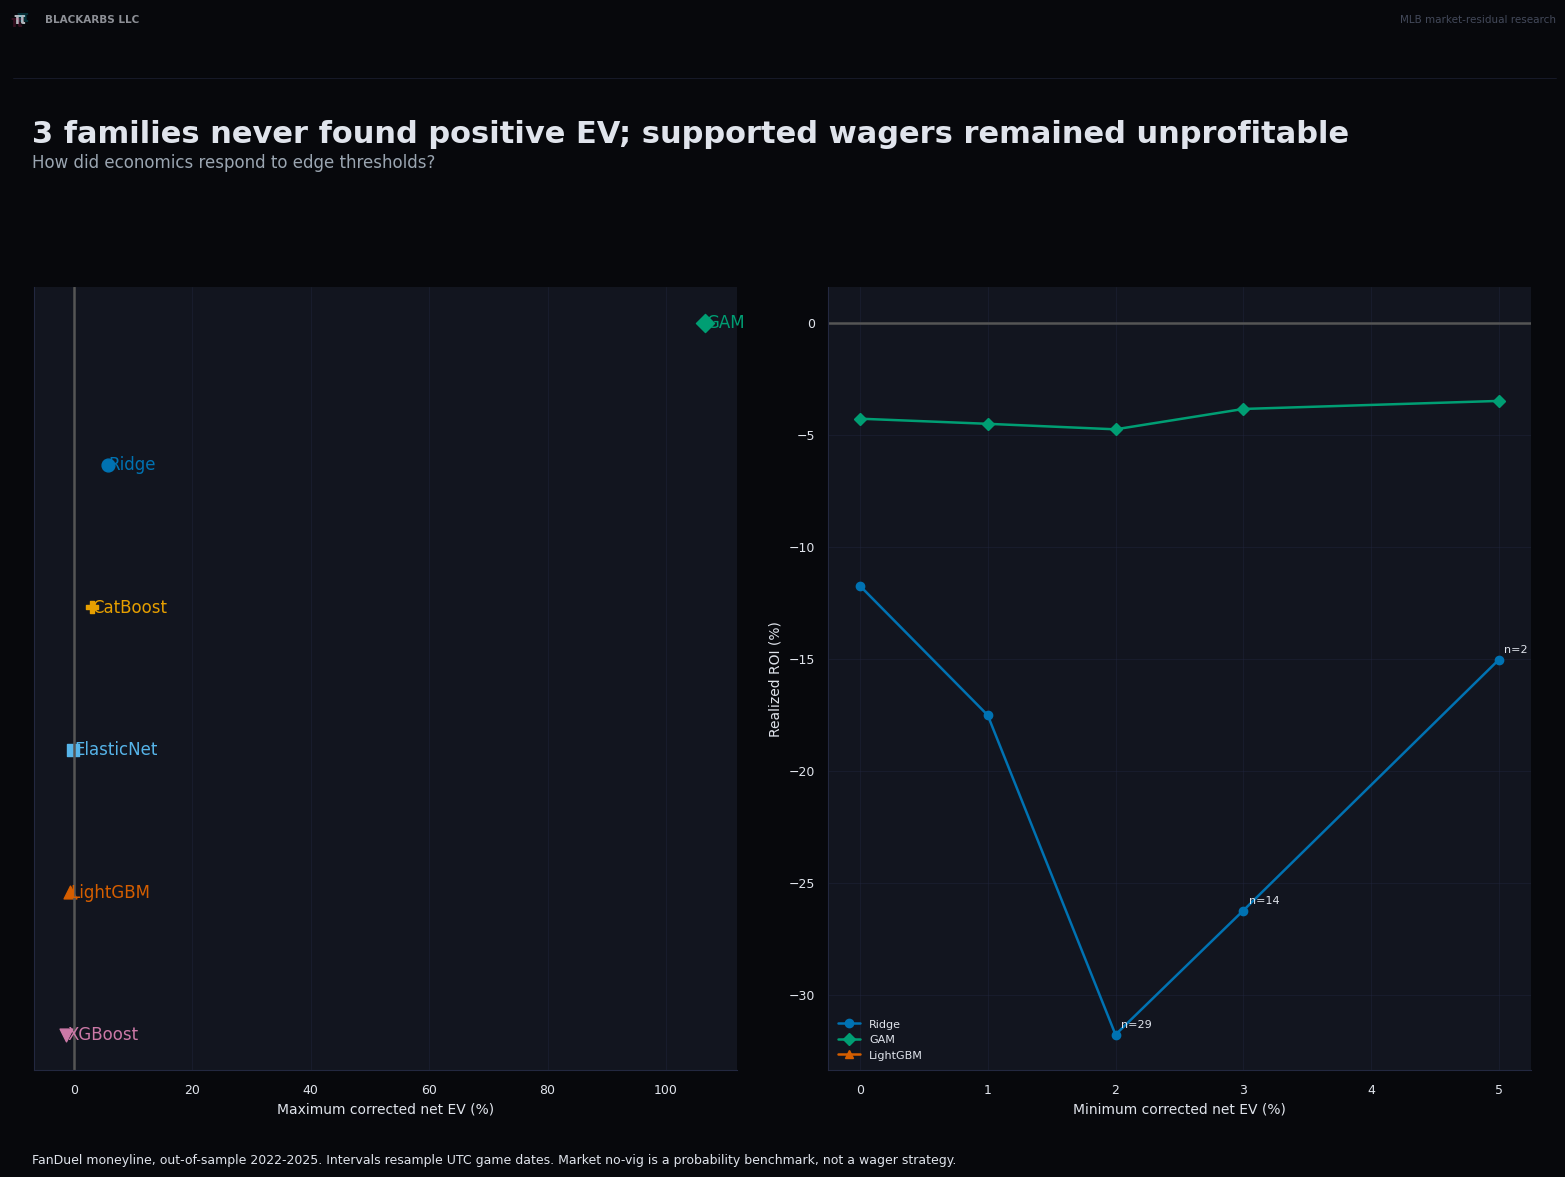
Wager count, profit, and ROI as predicted EV thresholds rise

Elastic Net, LightGBM, and XGBoost generated no positive-EV wagers. CatBoost had only 17 at zero threshold. Ridge and GAM had support but negative broad economics.

Chart 7
Historical experiment · contextual evidence

Fixed losses persisted; dynamic selection stopped after July 2022
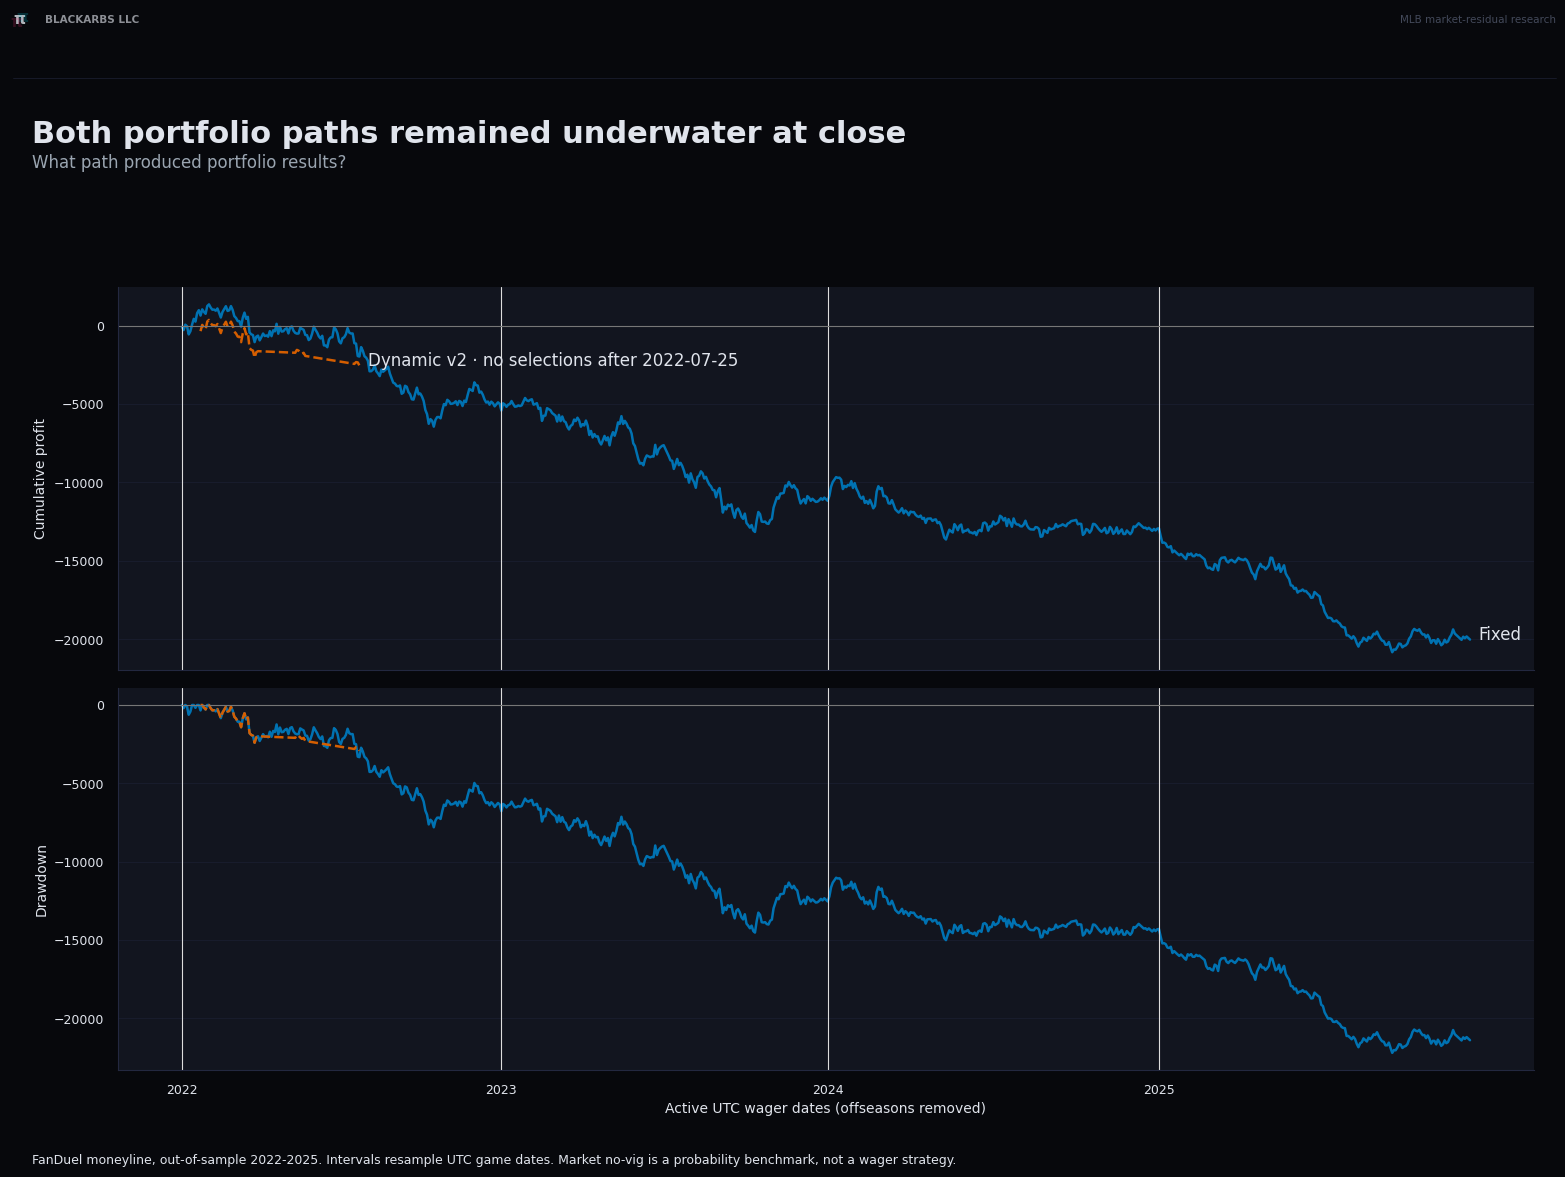
Cumulative profit and drawdown across active wager dates, with dynamic selection ending in July 2022

The dynamic line is short because it placed only 320 wagers on 46 active dates and selected nothing after 2022-07-25. That is policy abstention, not missing 2023–2025 chart data and not the classifier-alias bug.

Coverage disclosed
Historical experiment · contextual evidence

The 14%–18% positive region was statistically unresolved
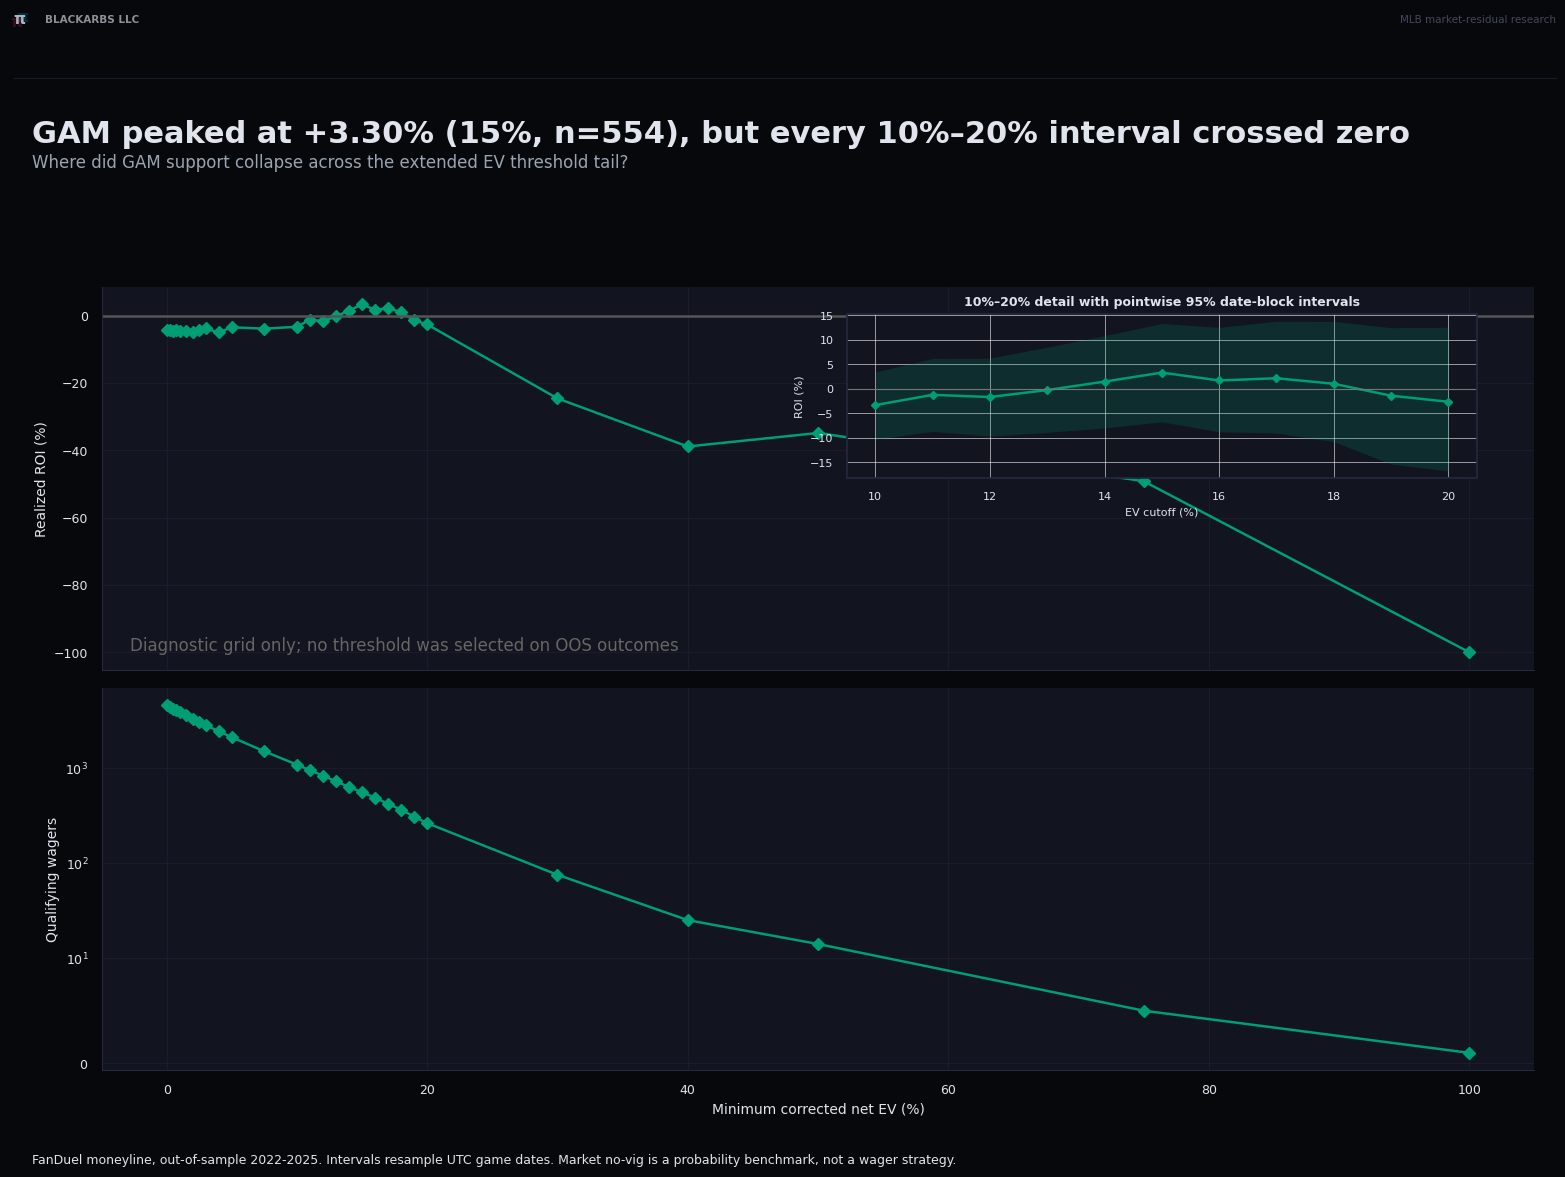
GAM wager support and pointwise confidence intervals from 10% to 20% EV thresholds

Peak point ROI was +3.30% at 15% with 554 wagers, but its interval was -6.74% to +13.32%. Every 10%–20% interval crossed zero.

Chart 14
BlackArbs LLC · Research follow-up
IX
Historical experiment · contextual evidence

Adding every available feature still did not beat the sportsbook price.

What happened when six model families received all 156 available inputs?

Historical experiment · contextual evidence

More flexibility generally made the correction worse

FamilyResidual minus market log loss95% intervalResult
Elastic Net+0.000200[-0.000004, +0.000396]Inconclusive
CatBoost+0.001145[+0.000422, +0.001833]Worse
LightGBM+0.001164[+0.000230, +0.002138]Worse
Ridge+0.001296[+0.000565, +0.002026]Worse
XGBoost+0.001548[+0.000693, +0.002441]Worse
GAM+0.091747[+0.072833, +0.116702]Materially worse

The useful next test is a small preregistered feature-family ablation with strong shrinkage, not another omnibus feature dump.

Information scope closed
Historical experiment · contextual evidence

XGBoost looked orderly, but mostly in the wrong economic direction
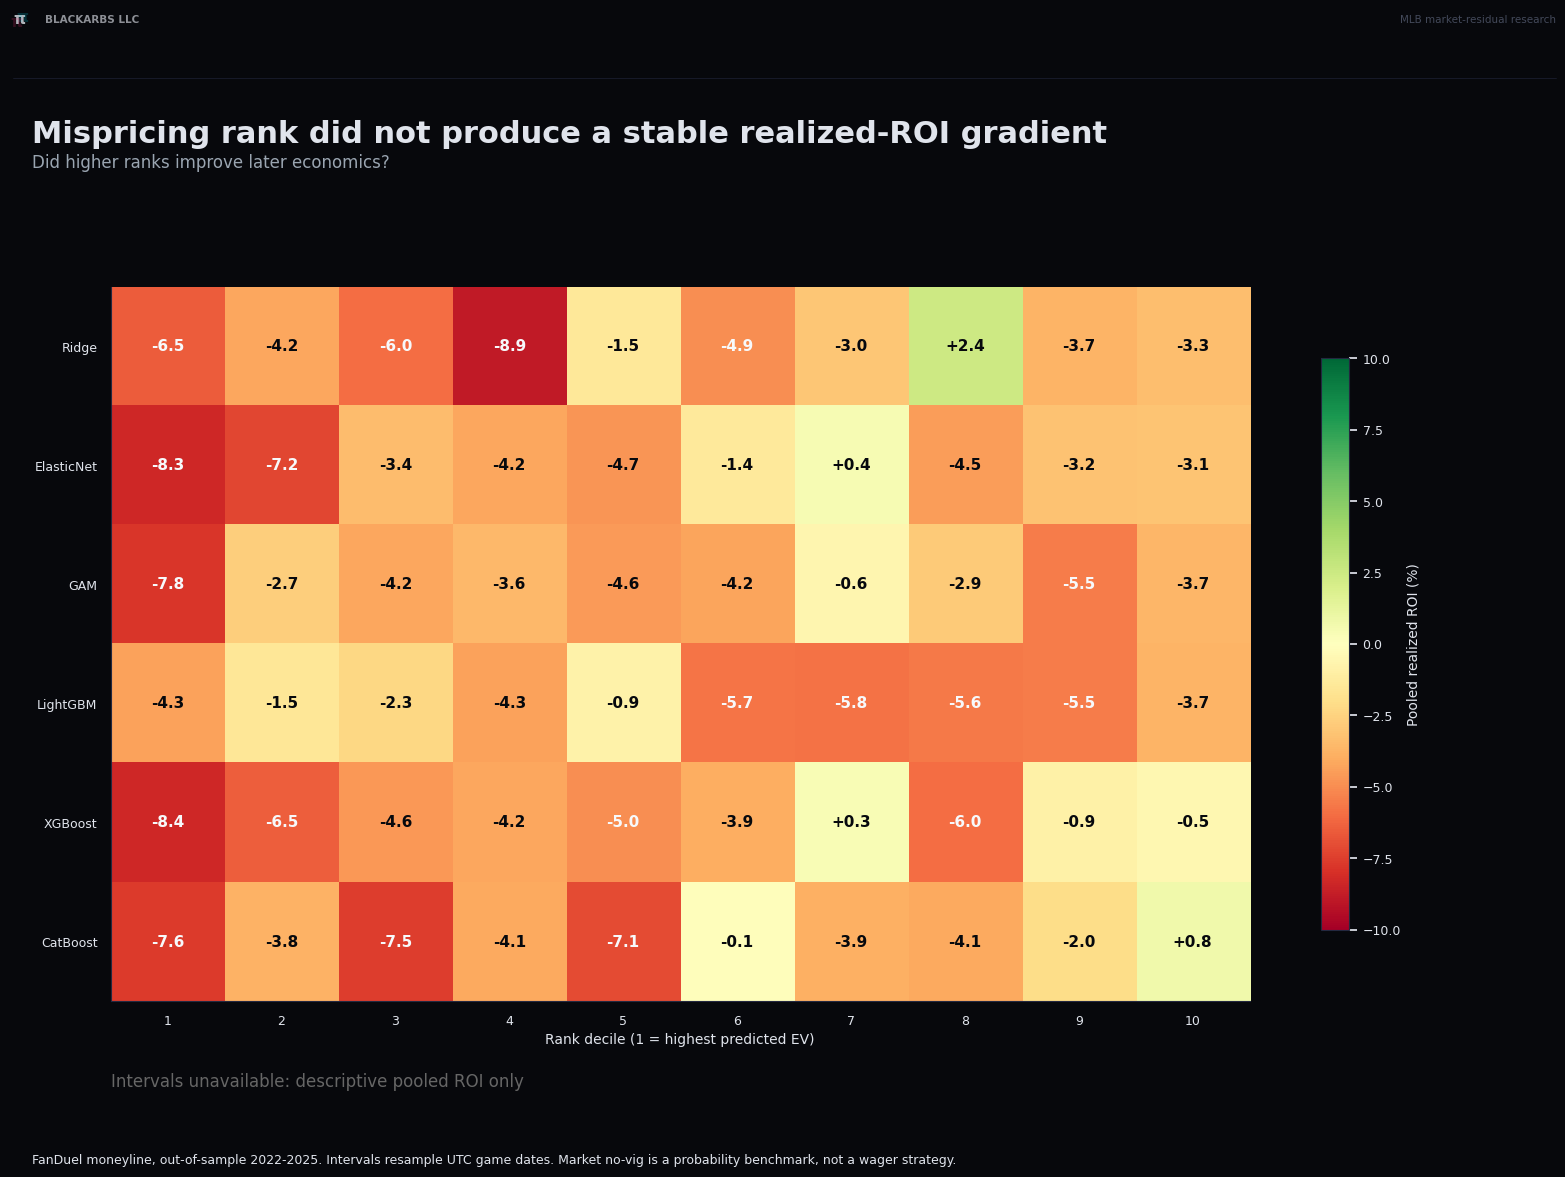
Pooled realized ROI by predicted-EV rank decile for six residual families

Decile 1 is highest predicted EV. XGBoost ROI generally improved as predicted EV weakened; CatBoost showed a noisier version. This suggests overconfident or misordered corrections, not buried positive edge.

Rank direction matters
Historical experiment · contextual evidence

The free archive could prove decision-time starter evidence for only seven games
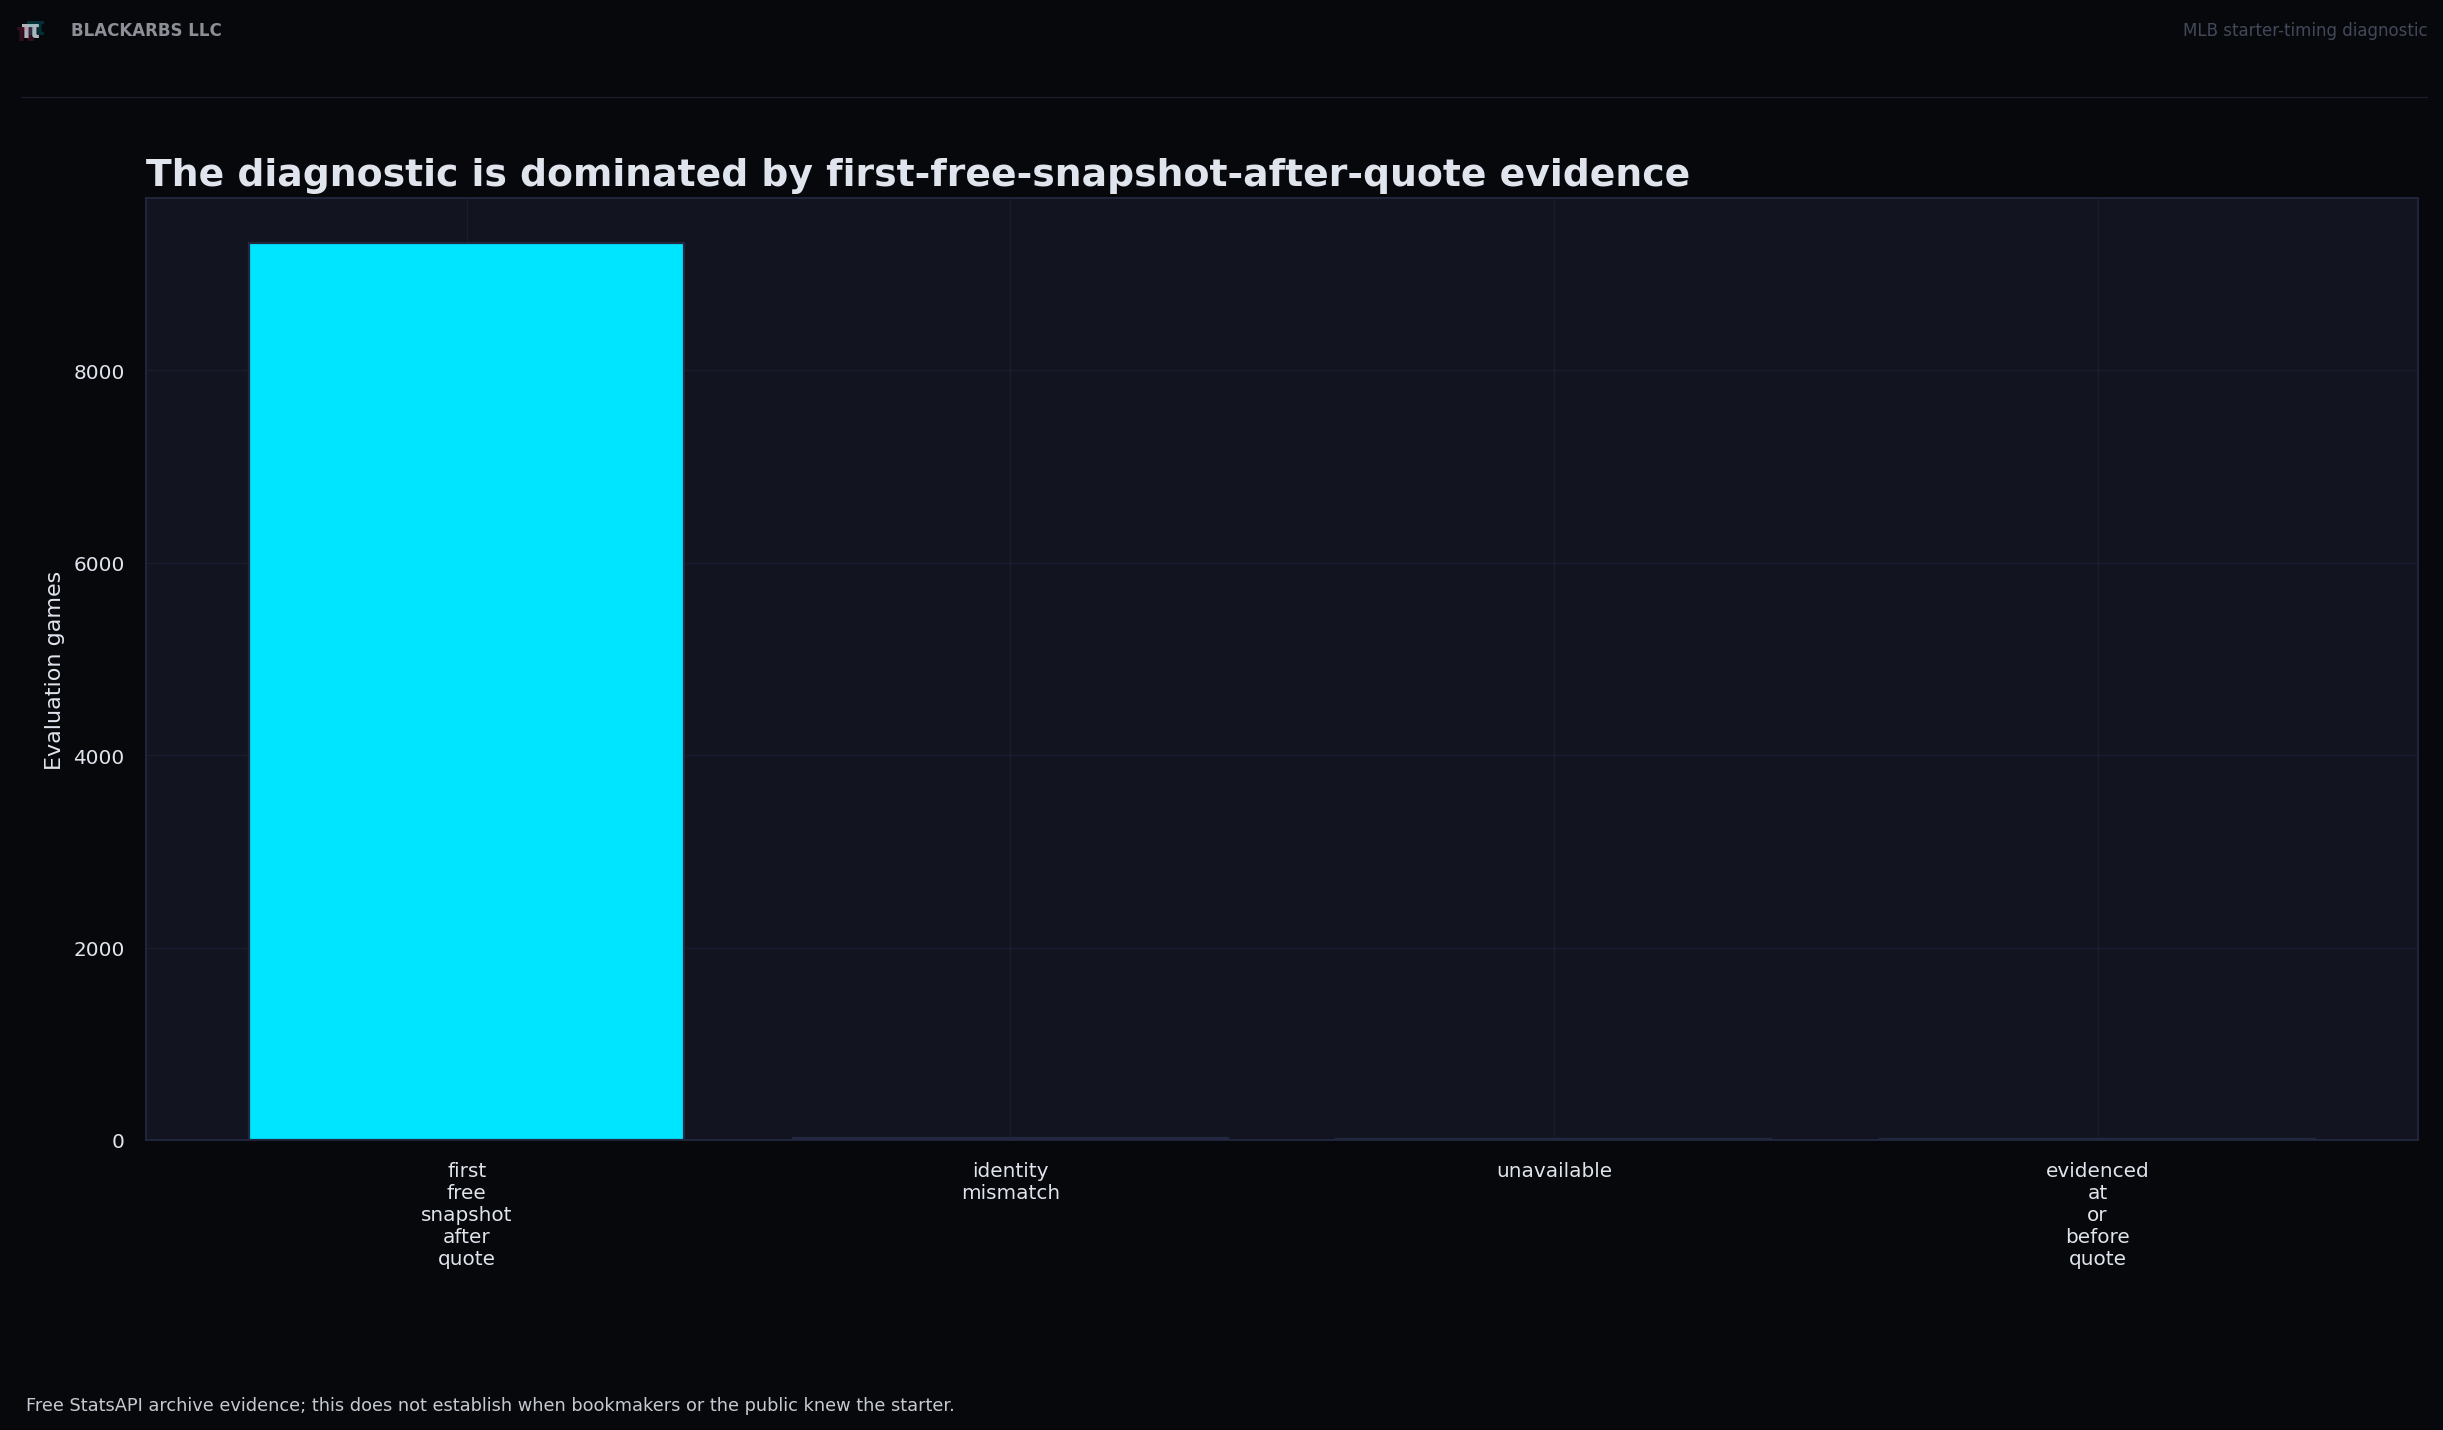
Timing-state support dominated by first free snapshots after the quote

7 games were evidenced at or before the quote; 9,322 first appeared later, 18 mismatched, and 8 were unavailable. Retrospective free reconstruction cannot power a production-grade starter-timing claim.

Support diagnosis
Historical experiment · contextual evidence

Three families differed by timing cohort, but seven clean games cannot settle why
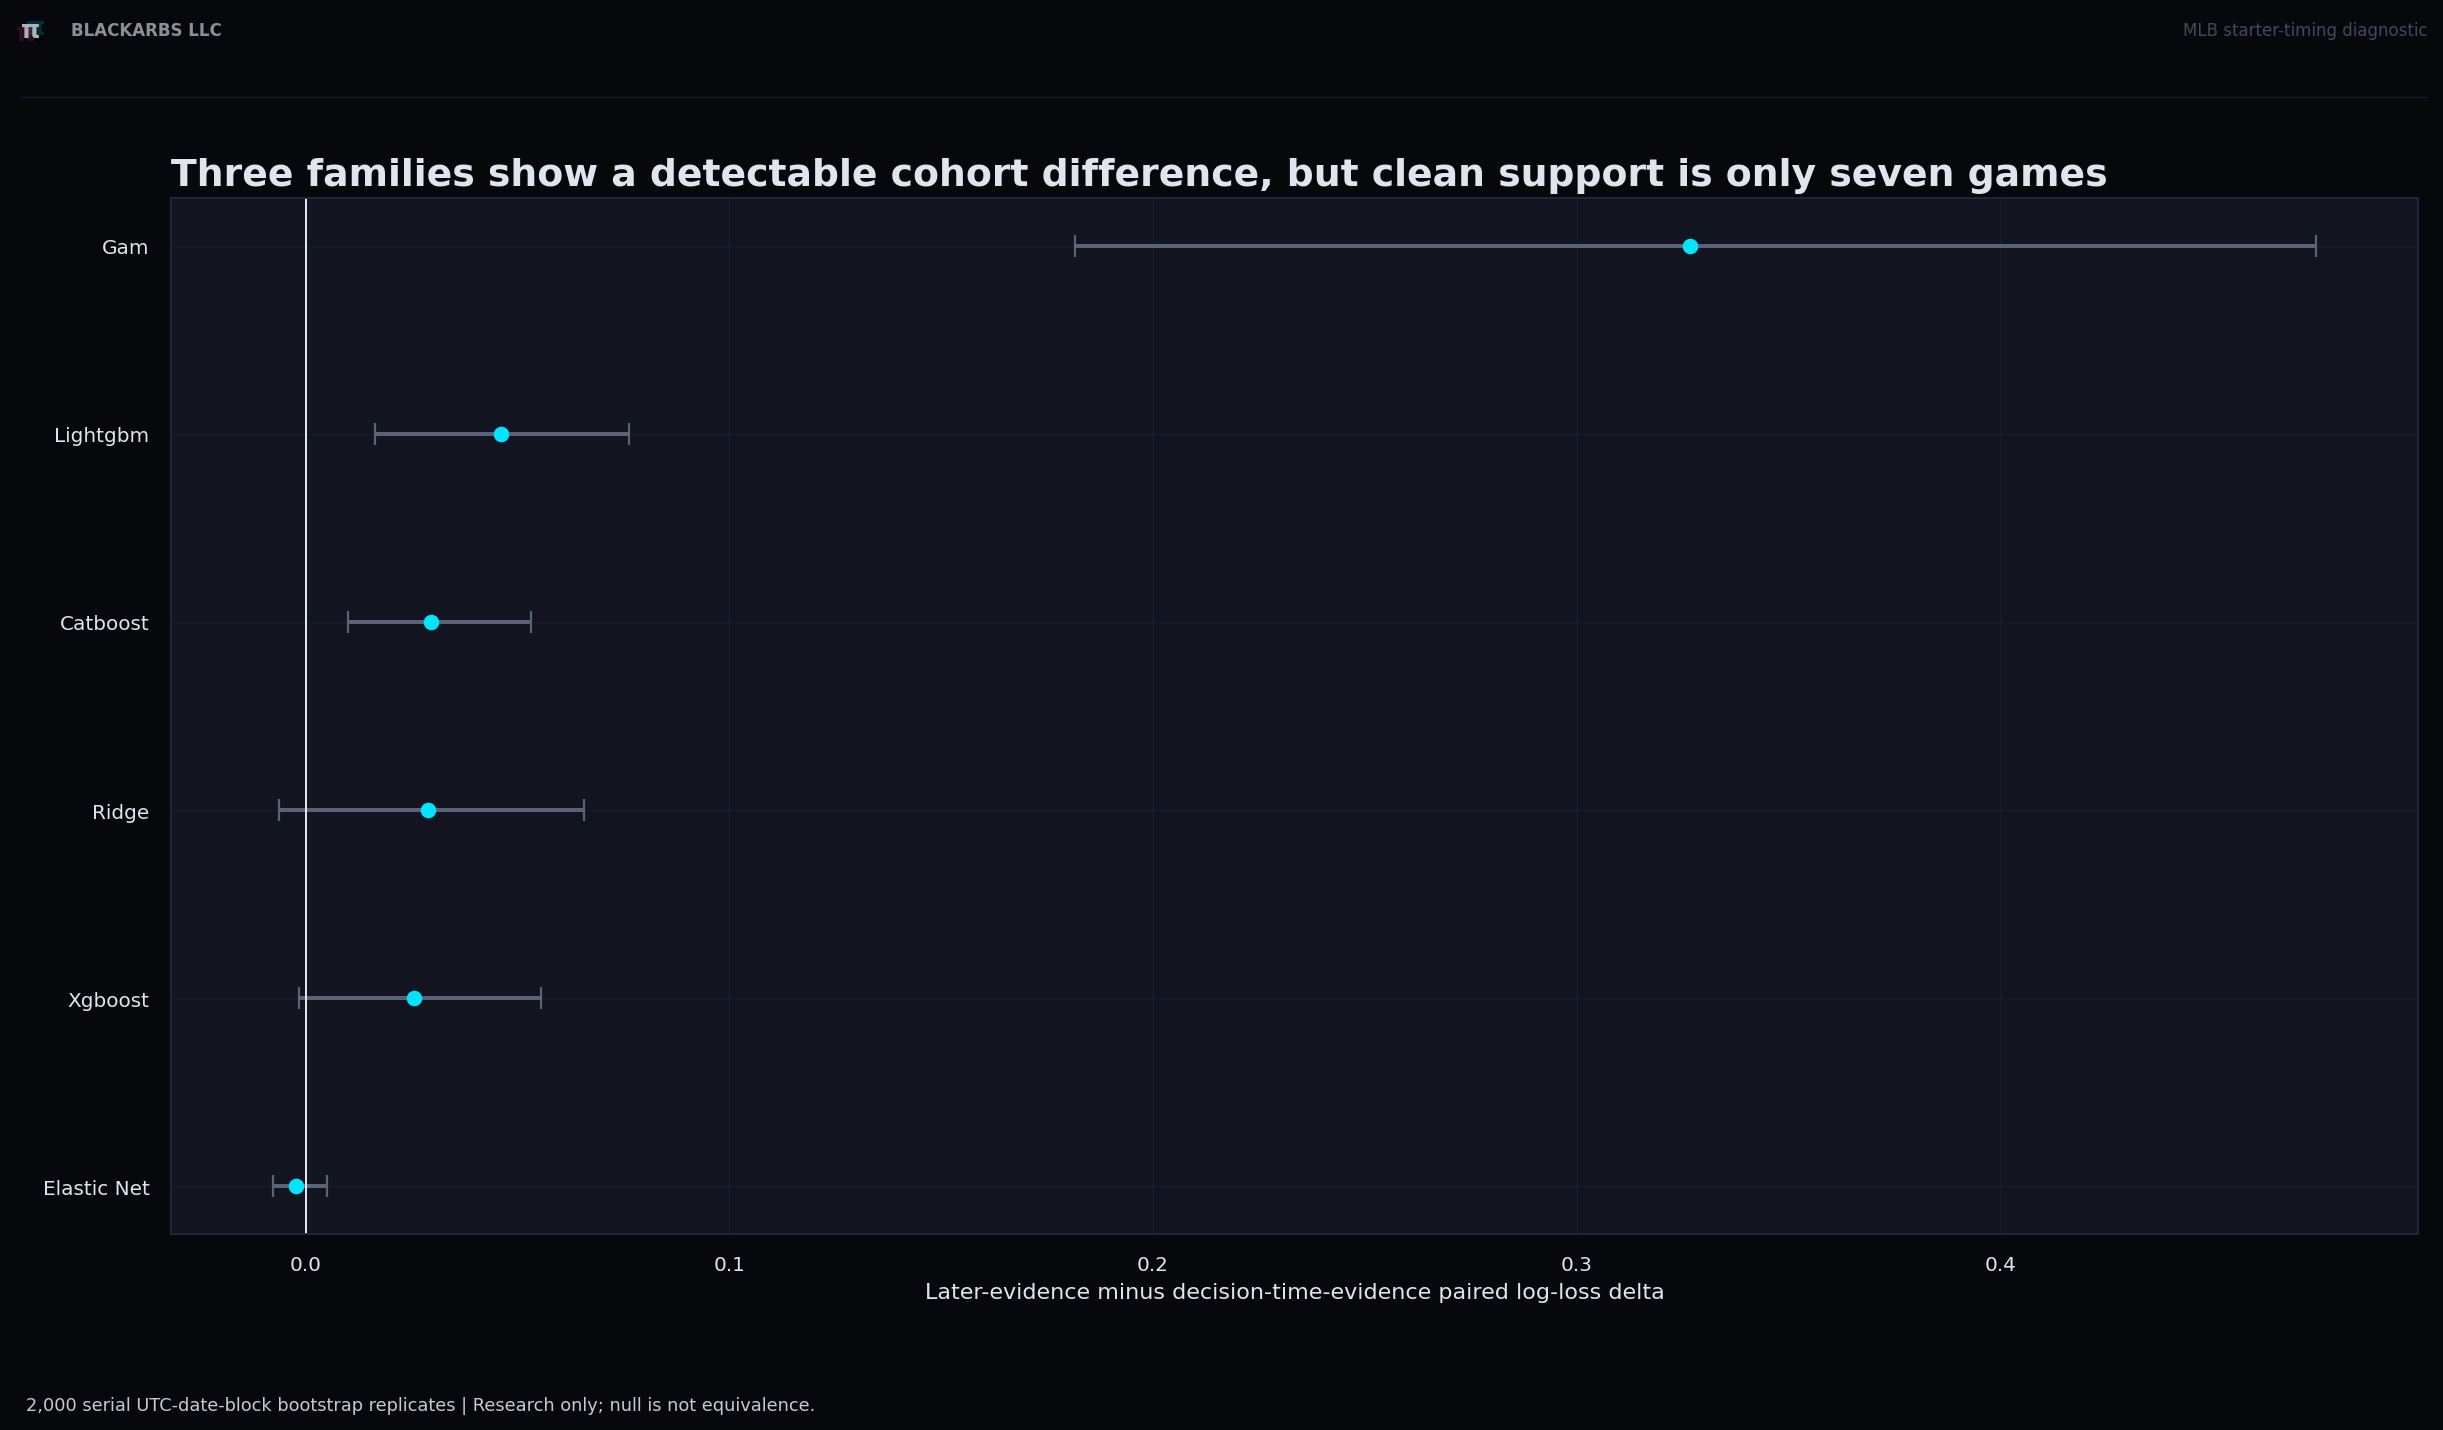
Starter-timing interaction estimates and bootstrap intervals by model family

CatBoost, GAM, and LightGBM intervals excluded zero. Treat this as a sensitivity alarm, not leakage proof. Prospectively timestamped starters and lineups are the actionable conclusion.

Diagnostic, not verdict
Historical experiment · contextual evidence

Three prerequisites are done; the information problem remains

Completed

  • Full governed feature inventory and omnibus rerun.
  • Starter date, name, rest, and missingness repairs.
  • Free timing cache and four-state offline classification.

Partially complete

  • Existing-feature program still needs only bounded family ablations.
  • Starter identity is classified, not production-proven.
  • Price proof is scoped, not yet consolidated.

Still missing

  • Prospective starters, lineups, scratches, and availability.
  • Multibook consensus and dispersion.
  • CLV lineage, distributional totals, and untouched confirmation.

The search space is narrower: finish provenance, collect new timestamped information, and stop broad sweeps of the same data.

Work completed
BlackArbs LLC · Research transition
V
Historical experiment · contextual evidence

Explain the losses, add new data, then test once.

The next steps focus on finding a repeatable edge while preserving evidence quality.

Historical experiment · contextual evidence

The next bottleneck is not another broad model sweep

Distributed price proof

Core controls pass, but vendor snapshot, book-update, close, and acceptance evidence are not projected into one lifecycle readback.

Genuinely new information

The full 156-input catalog failed broadly. Prospective players, lineups, availability, environment, projections, and multibook structure now matter more.

Thin early history

The 2022 fold remains thin for flexible corrections, especially across correlated rolling horizons.

Wrong target shape

Point error still does not model uncertainty, push probability, or asymmetric score tails at the offered line.

The broad feature-scope gap is closed. Decision-time data quality, genuinely new information, target shape, and untouched confirmation remain.

Updated diagnosis
Historical experiment · contextual evidence

The core moneyline data and controls already pass

Already validated

  • Named FanDuel observation precedes event start.
  • Both moneyline sides share one normalized source row.
  • No-vig probability uses the complete pair.
  • Selected-side probability and observed price feed canonical EV.
  • Price mutation and wager-identity drift are rejected.

Assurance extensions

  • Project existing book, pair, no-vig, selection, price, and EV evidence into one verifier view.
  • Retain vendor snapshot and bookmaker update times separately.
  • Distinguish observed offer from accepted wager and stake.
  • Add push probability before spread/total EV research.
  • Treat closing prices and multibook attribution as separate new work.

The Odds API records bookmaker-attributed snapshots, but it is an independent aggregator and does not prove FanDuel accepted a stake.

Corrected proof status
Historical experiment · contextual evidence

Project existing evidence; collect only genuinely new fields

Verifier reconciliation view

  • Read existing canonical book, market, line, and paired prices.
  • Show paired no-vig, selection, observed price, and EV together.
  • Do not create a second source of truth.

Genuinely new lineage

  • Separate vendor snapshot and book update times.
  • Accepted, rejected, or simulation-only execution state.
  • Closing-price lineage only if CLV research proceeds.

Adversarial extension

  • Wrong book, side, line, or timestamp.
  • Incomplete or drifted pairing.
  • Stale quote and changed-price response.
  • Push-aware spread/total EV.

This remains Priority 1 because every later feature and ROI claim depends on precise provenance, not because the current controls are absent.

Control extension
Historical experiment · contextual evidence

Collect what the current catalog does not know

More columns did not add more information.

What moves up

Prospectively timestamped starters, lineups, scratches, player availability, weather and roof state, projection priors, and contemporaneous market structure now outrank another omnibus catalog fit.

Keep only a bounded existing-feature ablation closeout. Put most information-research effort into sources with genuinely new decision-time content.

Priority changed
Historical experiment · contextual evidence

Do not confuse one omnibus failure with every feature family being useless

Now completed

  • 112 complete governed features.
  • Two fold-filled venue splits.
  • 38 repaired starter columns.
  • Four explicit availability states.

One final bounded test

  • Hold Elastic Net and one constrained nonlinear model fixed.
  • Ablate bullpen, schedule, team form, venue/park, and starter groups.

Stop rule

  • Stop if no group improves proper score in the declared direction.
  • Do not reopen a six-family or threshold sweep.

Starter limitation

  • Feature mechanics are repaired.
  • Production identity still needs timestamped probable-starter evidence.

The omnibus result lowers the expected value of recombining the same rolling statistics. Ablations remain diagnostic, not the main growth program.

Scope narrowed
Historical experiment · contextual evidence

Change information and model family separately

Initial models

  • One regularized residual model.
  • One constrained nonlinear residual model.
  • Hold models fixed while feature families change.
  • Report selected versus eligible governed inputs.

Information gate

  • Paired proper-score interval below zero.
  • Non-worse in at least three of four seasons.
  • Stable calibration and no one-date concentration.

Economic gate

  • Explicit no-bet control.
  • Report abstention frequency.
  • Positive uncertainty-adjusted lower bound after estimated execution costs.

Only after the information gate passes should ranking and fixed-policy economics be used for advancement.

Predeclared gate
Historical experiment · contextual evidence

Other sportsbooks can improve the benchmark and supply genuinely new information

Role A · Better benchmark

  • Median or liquidity-weighted no-vig probability.
  • Robust consensus excluding stale or incomplete books.
  • Sharper-book versus recreational-book consensus.
  • Leave-FanDuel-out consensus when FanDuel is the execution venue.

Role B · Predictive features

  • FanDuel deviation from consensus.
  • Cross-book dispersion and directional movement.
  • Sharp-soft disagreement.
  • Stale flags, leadership, lag, and movement velocity.

The plausible edge is temporary book-specific mispricing: when FanDuel sits away from the contemporaneous information aggregate.

Two roles, kept separate
Historical experiment · contextual evidence

Use only information available at the frozen decision time

Leakage control

  • Freeze one decision-timestamp policy.
  • Use contemporaneously available books only.
  • Never let closing information enter a decision-time feature.

Three benchmarks

  • FanDuel no-vig.
  • Leave-FanDuel-out consensus no-vig.
  • FanDuel plus a consensus-residual model.

Evaluation

  • Primary: proper scores and FanDuel closing-line value.
  • Downstream: fixed-policy FanDuel ROI.
  • Report book count, dispersion regime, and untouched confirmation.

Closing-line value is an intermediate information diagnostic, not a substitute for realized profit.

Multibook protocol
Historical experiment · contextual evidence

Model the probability around the offered total, not only the expected runs

Why totals

CatBoost and XGBoost totals were positive in both 2024 and 2025, although still negative across the full period.

What to model

The full conditional run-total distribution, including over, under, and push probabilities at the offered line.

How to judge it

First proper-score improvement over the audited market, then calibration, closing-line value, rank monotonicity, fixed-policy ROI, and support.

Predeclare CatBoost and XGBoost as the two nonlinear contenders. Do not reopen a six-family search.

Narrow pilot
Historical experiment · contextual evidence

Confirm narrowly, diagnose earlier, and make no-bet the default

5 · Frozen totals confirmation

Lock one or two interpretable CatBoost/XGBoost totals policies before an untouched period. Do not search thresholds or line bands inside confirmation.

6 · Closing-line-value-first ranking

Test proper score, later movement toward the model, and top-rank movement monotonicity before settled ROI.

7 · Uncertainty-shrunk selection

Shrink expected edge, penalize instability and concentration, require independent-date support, and default explicitly to no wager.

The current selector repeatedly chose attractive historical components that lost in the next window. Repeating it with more model families is low priority.

Research sequencing
Historical experiment · contextual evidence

Moneyline exclusions now outrank the older model-level clues

Primary economic clue

  • Annual-frozen LightGBM-control and XGBoost classifiers finished positive.
  • Both date-block intervals crossed zero.
  • Test whether their profits came from shared or classifier-specific wagers.

Secondary diagnostics

  • LightGBM moneyline disagreement rejection as an abstention hypothesis.
  • One frozen rule for avoiding within-season selection churn.
  • Season and price-band stability of the two classifier sleeves.

New information

  • Prospective lineup and availability evidence.
  • Leave-FanDuel-out consensus and cross-book dispersion.
  • Book leadership, lag, and stale pricing after timestamp controls pass.

The direct question is whether two positive classifier point estimates survive one untouched, post-friction confirmation.

Hypotheses, not edge
Evidence map · Experiments 1–4

Classifier, calibration, ranking, and regression sources

Fixed classifier

  • var/research/mlb_model_family_adapter_experiment_framework/run_mlb_model_family_adapter_experiment_framework_2023_2025_chg_20260714T003613Z_e5ead1f27d3a/
  • Tables: model_family_calibration_metrics.parquet, model_family_portfolio_metrics.parquet.
  • Commits: 85596cabf, 9b523363c, f46c8cd7f, 569e1d226.
  • Research-only: exact production verifier failed entrypoint and identity/readback.

Calibration and disagreement

  • var/research/mlb_cross_model_all_market_actionable_calibration/run_mlb_cross_model_all_market_actionable_calibration_20260715T032018Z/
  • Tables: disagreement_policy_comparison.parquet, correction_comparison.parquet.
  • Commits: aa91c9c09, b3c1142c8, 63450a1fa, 75ce963c3, cf0788360.

Price-relative ranking

  • var/research/mlb_price_relative_ranking_profitability_attribution/run_20260717T060000Z_chart_relabel/
  • Tables: advancement_gate.parquet, ranking_method_comparison.parquet.
  • Commits: b1963710f, f2ea81325, 354a1c0f1, 333fc380e.

Regression screening

  • var/research/mlb_regression_model_family_screening/run_mlb_regression_model_family_screening_2021_2025_chg_20260719T140818Z_5637b7dac057/
  • Table: comparison_package/regression_prediction_metrics.parquet.
  • Commits from bb669025e through 4b08f9796, plus later proof repairs.
Evidence map · Experiments 5–8

Routing, dynamic portfolios, and residual sources

Candidate routing

  • docs/reports/20260718_202303Z_qaf_check_mlb_candidate_routing_accounting_slice_008.md
  • Verified run: run_mlb_candidate_routing_accounting_2021_2025_chg_20260718T192956Z_3d577c70cdf5.
  • Commits from 5f171590f through 136ef9582.

Dynamic regression

  • docs/research/20260720T183500Z_mlb_regression_family_dynamic_portfolio_results.md
  • var/research/mlb_regression_dynamic_portfolios_2022_2025_policy_v2/comparison_chart_package/
  • Commits: 6f560da5a, 463f2e406, 0ba07d587.

Dynamic classification

  • docs/research/20260720T220000Z_mlb_classification_family_dynamic_portfolio_results.md
  • var/research/mlb_classification_dynamic_portfolios_2022_2025_policy_v2/comparison_chart_package/
  • Commit: 0ba07d587.

Residual + full-feature follow-up

  • var/research/mlb_market_residual_mispricing_research/...140850Z.../
  • var/research/mlb_full_feature_timestamp_mixing_diagnostic/full_feature_run_v1/
  • docs/research/20260722T220500Z_mlb_full_feature_timestamp_diagnostic_research_addendum.md
  • Commits: 6e3d23bdb, fbc2abfaa, 8d218132d, ccbb776eb.
Evidence map · Model-sensitive corrected economics

The economic-first section uses the final pure-sleeve and policy packages

Canonical evidence

  • var/research/mlb_model_sensitive_portfolio_disentanglement/run_mlb_model_sensitive_portfolio_disentanglement_chg_20260729T055705Z_a0af65db6f32/
  • model_sensitive_inference.parquet and incremental_over_rules_outcomes.parquet.
  • var/research/mlb_model_sensitive_policy_chart_package/run_mlb_model_sensitive_policy_chart_package_final_20260729T200000Z_a0af65db6f32/
  • unique_selection_pnl_attribution.parquet and common_wager_reconciliation.parquet.

Interpretation record

  • docs/research/20260729T203000Z_mlb_corrected_experiment_synthesis_and_research_priorities.md.
  • The 16-of-22 dynamic-selection conclusion is superseded.
  • Positive classifier point estimates remain unresolved because their intervals cross zero.
  • No model refit or new MLB replay was performed during deck assembly.

The final model-sensitive outputs lead the deck. Earlier experiments provide context and cannot overwrite the latest identities or conclusions.

Evidence boundary
Chart evidence contract

The figures are views of canonical tables, not independent calculations

Source packages

  • Model-sensitive pure-sleeve package.
  • Final corrected fixed, dynamic, and comparison package.
  • Fixed-classifier, calibration, and ranking packages.
  • Regression screening, residual, and full-feature packages.

Curated evidence set

The opening act uses exact approved pure-sleeve and comparison PNGs covering absolute economics, uncertainty, policy ROI, market and season results, identity overlap, and window-specific attribution.

Charts remain views of canonical tables. Portable assets are byte copies from validated packages; the HTML template performs no financial calculation.

Click Focus for the modal viewer or Open tab for the source-resolution PNG copied into this portable deck package.

Presentation integrity
← → · Space · Home · End · Charts: Focus or Open tab